Guest, Sign inJoin
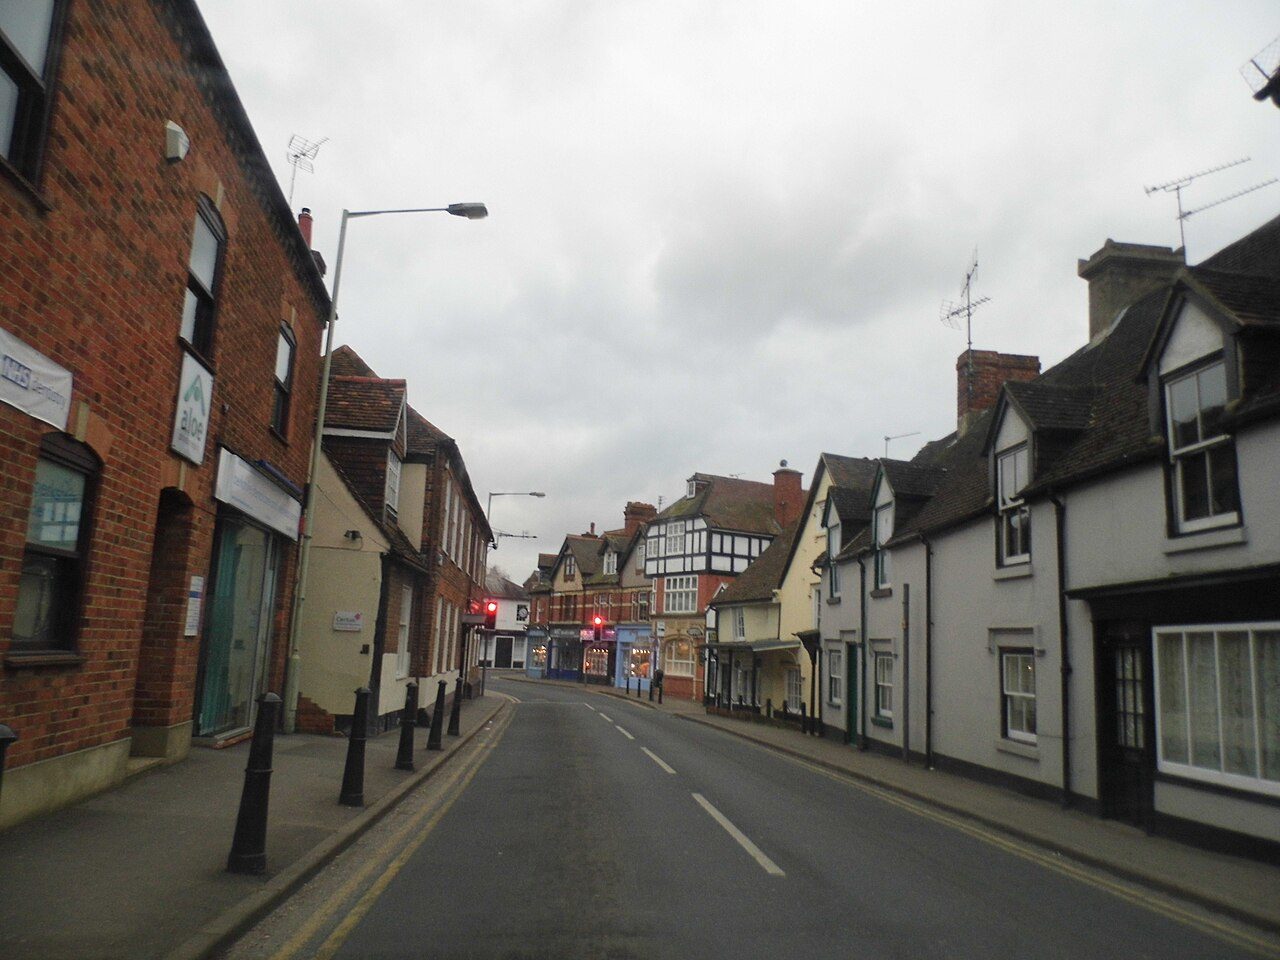
High Street TwyfordTwyford, #1 on this list · Photo: David Howard · CC BY-SA 2.0
Berkshire · 2026

Best places to live in Berkshire

Twyford ranks first of 30 Berkshire towns of 2,500+ residents, and #8 of 2,138 UK towns. 17 of the 30 grade A− or better; scores run from 79.5 down to 39.5.

The overall score, sorted within Berkshire; the letter compares each town with every UK town, and its rank among UK towns sits beside it. How grades work

#1

Twyford

Berkshire · 8,072 people
A+

Score 79.5·#8 of 2,138 UK towns

Strongest: jobs & income A+, health A+·lowest: hazard risk C+

#2

Wokingham

Berkshire · 50,320 people
A+

Score 78.4·#12 of 2,138 UK towns

Strongest: jobs & income A+, health A+·lowest: hazard risk C

#3

Woodley

Berkshire · 28,019 people
A+

Score 78.1·#14 of 2,138 UK towns

Strongest: jobs & income A, schools A·lowest: hazard risk B−

All 30 towns, ranked

By overall score against UK towns; ranks are within Berkshire, and each UK rank links to the national list. The score (0–100) blends the seven livability grades and sets the order; the letter places that score among UK towns of 2,500+, and A+ is the top 5%, so neighbours on the list often share a letter.

Every town in Berkshire →

30 towns.

#TownScoreGrade · UK rankWhat drives it
1Twyford8,072 people79.5top 0.4%A+#8 of 2,138 nationallyStrongest: jobs & income A+, health A+·lowest: hazard risk C+
2Wokingham50,320 people78.4top 0.6%A+#12 of 2,138 nationallyStrongest: jobs & income A+, health A+·lowest: hazard risk C
3Woodley28,019 people78.1top 0.7%A+#14 of 2,138 nationallyStrongest: jobs & income A, schools A·lowest: hazard risk B−
4Charvil3,158 people76.3top 1.8%A+#36 of 2,138 nationallyStrongest: jobs & income A+, health A+·lowest: hazard risk D
5Wargrave2,896 people76.0top 1.9%A+#37 of 2,138 nationallyStrongest: health A+, jobs & income A+·lowest: hazard risk C−
6Winnersh8,904 people74.3top 2.3%A+#46 of 2,138 nationallyStrongest: jobs & income A+, schools A·lowest: hazard risk C
7Sandhurst20,220 people70.4top 5.6%A#117 of 2,138 nationallyStrongest: jobs & income A+, health A·lowest: hazard risk D
8Spencers Wood and Three Mile Cross7,612 people69.8top 6.7%A#139 of 2,138 nationallyStrongest: jobs & income A+, health A+·lowest: walkability C
9Shinfield5,417 people69.7top 6.9%A#143 of 2,138 nationallyStrongest: jobs & income A+, schools A−·lowest: walkability B−
10Crowthorne15,196 people69.5top 7.1%A#147 of 2,138 nationallyStrongest: jobs & income A+, health A+·lowest: hazard risk C
11Cookham5,216 people67.5top 9.7%A#199 of 2,138 nationallyStrongest: jobs & income A+, schools A·lowest: hazard risk D
12Binfield4,851 people66.8top 10.5%A#216 of 2,138 nationallyStrongest: jobs & income A+, health A·lowest: walkability C
13Ascot24,003 people66.5top 11.1%A#229 of 2,138 nationallyStrongest: jobs & income A+, health A+·lowest: hazard risk C−
14Caversham33,038 people65.3top 12.8%A#266 of 2,138 nationallyStrongest: jobs & income A+, walkability A·lowest: hazard risk D−
15Burghfield Common6,216 people62.4top 16.8%A−#350 of 2,138 nationallyStrongest: jobs & income A, schools A−·lowest: cost of living C+
16Pangbourne3,279 people62.1top 17.6%A−#369 of 2,138 nationallyStrongest: health A+, jobs & income A+·lowest: hazard risk C−
17Arborfield Garrison4,311 people59.3top 23.9%A−#501 of 2,138 nationallyStrongest: schools A, jobs & income A−·lowest: walkability D
18Theale3,053 people56.8top 28.7%B+#604 of 2,138 nationallyStrongest: walkability A−, jobs & income A−·lowest: hazard risk C−
19Mortimer2,932 people56.4top 29.6%B+#623 of 2,138 nationallyStrongest: hazard risk A, health A−·lowest: safety C
20Maidenhead67,391 people56.1top 30.1%B+#633 of 2,138 nationallyStrongest: jobs & income A, walkability A−·lowest: hazard risk D
21Windsor31,569 people51.4top 40.1%B#847 of 2,138 nationallyStrongest: walkability A, jobs & income A·lowest: hazard risk C−
22Old Windsor and Wraysbury7,689 people51.1top 40.6%B#859 of 2,138 nationallyStrongest: jobs & income A, health A−·lowest: hazard risk D−
23Newbury42,262 people51.1top 40.7%B#861 of 2,138 nationallyStrongest: walkability A, jobs & income B·lowest: hazard risk D
24Datchet4,807 people51.1top 40.8%B#862 of 2,138 nationallyStrongest: schools A, jobs & income A−·lowest: hazard risk D−
25Thatcham25,537 people51.0top 40.9%B#866 of 2,138 nationallyStrongest: jobs & income A−, cost of living B+·lowest: schools C−
26Bracknell78,662 people50.4top 42.1%B#892 of 2,138 nationallyStrongest: jobs & income B+, walkability B+·lowest: safety C
27Reading203,789 people47.0top 49.9%B−#1,058 of 2,138 nationallyStrongest: walkability A+, schools A−·lowest: safety C−
28Lambourn3,141 people46.6bottom 49.1%B−#1,079 of 2,138 nationallyStrongest: cost of living A−, health B·lowest: schools D−
29Hungerford5,184 people46.3bottom 48.4%B−#1,096 of 2,138 nationallyStrongest: walkability A−, cost of living B+·lowest: schools C−
30Slough166,868 people39.5bottom 32.7%C#1,432 of 2,138 nationallyStrongest: schools A, walkability A·lowest: safety D
Quick answers

Questions people ask

What is the best place to live in Berkshire?

Twyford ranks first of 30 graded towns of 2,500+: jobs & income (A+) and health (A+) are its strongest grades; hazard risk (C+) is its lowest. Wokingham and Woodley follow.

How are these towns ranked?

By the overall grade, which blends seven livability grades (cost of living, safety, schools, health, jobs & income, walkability, hazard risk) from public data, each comparing a town with every UK town. The rank is within Berkshire. How grades work.

Why isn’t my town on this list?

The list covers places of 2,500+ residents with an overall grade. Smaller places, and towns missing figures the overall grade needs, show their subject grades on their own pages; every town in Berkshire is listed on the county page.

County by county

Best places to live, county by county

Sources: TownRatings grades: our own summary of the data, ranked against UK towns only. All under the Open Government Licence v3.0.

Contains public sector information licensed under the Open Government Licence v3.0. Contains HM Land Registry data © Crown copyright and database right 2026. Contains OS data © Crown copyright and database right 2026 (ONS boundaries). Northern Ireland: Source: NISRA; contains Land & Property Services data and Ordnance Survey of Northern Ireland information, © Crown copyright, licensed under the Open Government Licence v3.0. Scotland: contains National Records of Scotland data, Registers of Scotland data and SEPA data, © Crown copyright / © SEPA 2025, licensed under the Open Government Licence v3.0.