Guest, Sign inJoin
Bunting over the Market Place at Saffron WaldenSaffron Walden, #1 on this list · Photo: Peter S · CC BY-SA 2.0
Essex · 2026

Best places to live in Essex

Saffron Walden ranks first of 81 Essex towns of 2,500+ residents, and #15 of 2,138 UK towns. 26 of the 81 grade A− or better; scores run from 78.1 down to 13.9.

The overall score, sorted within Essex; the letter compares each town with every UK town, and its rank among UK towns sits beside it. How grades work

#1

Saffron Walden

Essex · 16,609 people
A+

Score 78.1·#15 of 2,138 UK towns

Strongest: schools A+, health A·lowest: hazard risk C

#2

Stansted Mountfitchet

Essex · 8,629 people
A+

Score 76.6·#30 of 2,138 UK towns

Strongest: health A, jobs & income A·lowest: hazard risk C
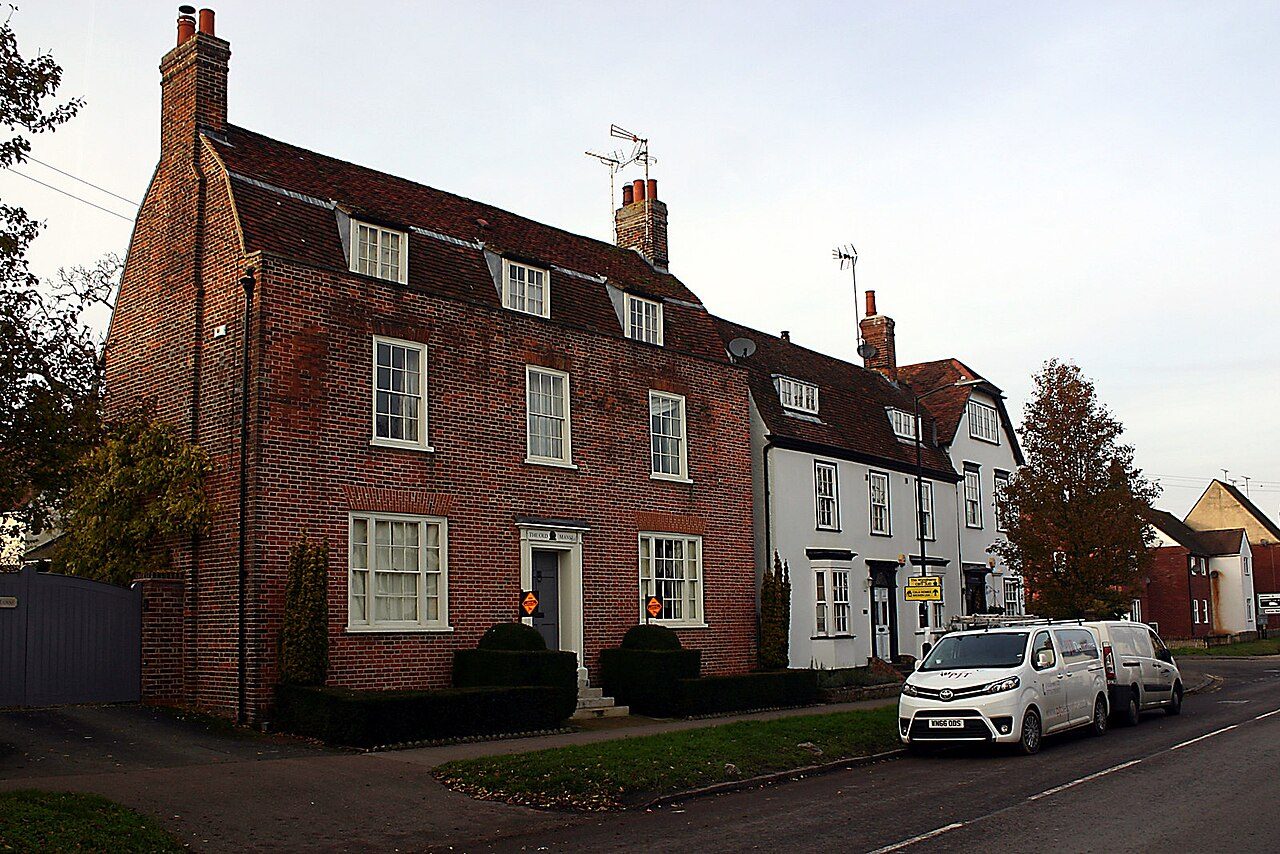
#3

Newport

Essex · 2,945 people
A+

Score 74.6·#43 of 2,138 UK towns

Strongest: health A+, jobs & income A·lowest: hazard risk C+

All 81 towns, ranked

By overall score against UK towns; ranks are within Essex, and each UK rank links to the national list. The score (0–100) blends the seven livability grades and sets the order; the letter places that score among UK towns of 2,500+, and A+ is the top 5%, so neighbours on the list often share a letter.

Every town in Essex →

81 towns.

#TownScoreGrade · UK rankWhat drives it
1Saffron Walden16,609 people78.1top 0.7%A+#15 of 2,138 nationallyStrongest: schools A+, health A·lowest: hazard risk C
2Stansted Mountfitchet8,629 people76.6top 1.5%A+#30 of 2,138 nationallyStrongest: health A, jobs & income A·lowest: hazard risk C
3Newport2,945 people74.6top 2.2%A+#43 of 2,138 nationallyStrongest: health A+, jobs & income A·lowest: hazard risk C+
4West Bergholt3,175 people73.7top 2.6%A+#53 of 2,138 nationallyStrongest: health A, jobs & income A·lowest: cost of living B−
5Great Totham2,773 people73.6top 2.7%A+#54 of 2,138 nationallyStrongest: safety A+, health A·lowest: walkability C−
6Hockley and Hawkwell15,430 people70.7top 5.4%A#113 of 2,138 nationallyStrongest: jobs & income A+, health A·lowest: cost of living C
7South Woodham Ferrers16,029 people69.1top 7.5%A#154 of 2,138 nationallyStrongest: jobs & income A, health A−·lowest: schools B−
8Danbury6,196 people68.4top 8.3%A#171 of 2,138 nationallyStrongest: schools A, health A·lowest: cost of living C
9Elsenham3,414 people67.9top 9.0%A#185 of 2,138 nationallyStrongest: health A, jobs & income A·lowest: walkability C+
10Billericay34,068 people67.9top 9.0%A#186 of 2,138 nationallyStrongest: jobs & income A+, health A·lowest: cost of living D
11Great Notley7,659 people67.6top 9.5%A#196 of 2,138 nationallyStrongest: jobs & income A+, health A·lowest: cost of living C
12Ingatestone5,411 people66.5top 11.0%A#228 of 2,138 nationallyStrongest: jobs & income A, walkability A·lowest: cost of living C
13Ashingdon6,490 people66.4top 11.3%A#233 of 2,138 nationallyStrongest: safety A, jobs & income A·lowest: cost of living C+
14Writtle4,703 people66.2top 11.7%A#241 of 2,138 nationallyStrongest: schools A, walkability A−·lowest: cost of living C+
15Great Leighs2,968 people64.8top 13.5%A#280 of 2,138 nationallyStrongest: schools A−, health A−·lowest: cost of living C+
16Wivenhoe7,354 people64.6top 13.8%A#285 of 2,138 nationallyStrongest: health A, jobs & income A·lowest: schools C−
17Boreham3,561 people63.0top 15.9%A−#332 of 2,138 nationallyStrongest: schools A, hazard risk A·lowest: walkability C+
18Great Dunmow10,395 people62.9top 16.2%A−#338 of 2,138 nationallyStrongest: health A−, jobs & income B+·lowest: hazard risk C+
19Takeley and Little Canfield5,553 people62.8top 16.3%A−#339 of 2,138 nationallyStrongest: jobs & income A, schools A·lowest: safety C−
20Brentwood55,339 people62.5top 16.7%A−#348 of 2,138 nationallyStrongest: walkability A, schools A·lowest: safety C
21Theydon Bois3,540 people61.5top 19.3%A−#404 of 2,138 nationallyStrongest: jobs & income A+, walkability A·lowest: cost of living D
22Galleywood6,410 people61.4top 19.6%A−#410 of 2,138 nationallyStrongest: hazard risk A, schools B+·lowest: safety C+
23Doddinghurst4,067 people61.2top 20.1%A−#420 of 2,138 nationallyStrongest: safety A, jobs & income A·lowest: cost of living C
24Tollesbury2,811 people61.2top 20.2%A−#422 of 2,138 nationallyStrongest: safety A, health A−·lowest: hazard risk D
25Kelvedon and Feering4,771 people60.3top 22.2%A−#464 of 2,138 nationallyStrongest: schools A+, jobs & income A−·lowest: hazard risk D
26Broomfield3,491 people60.2top 22.4%A−#468 of 2,138 nationallyStrongest: walkability A+, schools A·lowest: safety D−
27Tiptree9,302 people58.3top 26.0%B+#546 of 2,138 nationallyStrongest: schools A−, health B+·lowest: safety B−
28Chelmsford110,612 people58.0top 26.7%B+#562 of 2,138 nationallyStrongest: walkability A, schools A·lowest: safety D
29Little Dunmow2,644 people57.8top 26.9%B+#565 of 2,138 nationallyStrongest: health A, hazard risk A·lowest: schools C−
30Rayleigh32,383 people57.3top 27.8%B+#586 of 2,138 nationallyStrongest: jobs & income A, walkability A−·lowest: cost of living C
31Buckhurst Hill11,749 people56.9top 28.4%B+#598 of 2,138 nationallyStrongest: walkability A+, jobs & income A·lowest: cost of living D
32Thaxted3,111 people56.5top 29.3%B+#616 of 2,138 nationallyStrongest: health A, cost of living B+·lowest: hazard risk C−
33Epping10,693 people55.0top 33.2%B+#699 of 2,138 nationallyStrongest: walkability A+, schools A·lowest: cost of living D
34Lawford4,488 people54.5top 34.2%B+#720 of 2,138 nationallyStrongest: schools A, jobs & income B+·lowest: cost of living D−
35North Weald Bassett4,323 people52.9top 36.7%B#774 of 2,138 nationallyStrongest: schools A, health B+·lowest: cost of living C−
36Chigwell12,251 people52.9top 36.8%B#776 of 2,138 nationallyStrongest: walkability A+, jobs & income A−·lowest: cost of living D
37Colchester130,259 people51.7top 39.4%B#832 of 2,138 nationallyStrongest: walkability A, cost of living A−·lowest: safety D
38Hullbridge5,709 people51.3top 40.2%B#850 of 2,138 nationallyStrongest: schools B+, health B·lowest: cost of living C
39West Mersea7,071 people50.7top 41.3%B#873 of 2,138 nationallyStrongest: health B+, safety B+·lowest: schools C
40Loughton33,338 people50.6top 41.7%B#882 of 2,138 nationallyStrongest: walkability A+, schools B+·lowest: cost of living C−
41Thundersley and South Benfleet49,886 people50.6top 41.8%B#884 of 2,138 nationallyStrongest: jobs & income A, walkability B+·lowest: cost of living D
42Coggeshall3,767 people50.4top 42.0%B#889 of 2,138 nationallyStrongest: walkability B+, health B+·lowest: hazard risk D
43Chafford Hundred and West Thurrock23,589 people50.2top 42.5%B#899 of 2,138 nationallyStrongest: walkability A, schools A−·lowest: safety D
44Wickford27,533 people49.7top 44.0%B#930 of 2,138 nationallyStrongest: jobs & income A−, walkability B+·lowest: cost of living C−
45Burnham-on-Crouch7,806 people49.2top 44.8%B#949 of 2,138 nationallyStrongest: walkability A−, cost of living B·lowest: hazard risk C−
46Lower Nazeing3,631 people48.1top 47.5%B−#1,006 of 2,138 nationallyStrongest: jobs & income A−, health B+·lowest: hazard risk D−
47Sible Hedingham4,261 people45.8bottom 47.4%B−#1,116 of 2,138 nationallyStrongest: health B+, cost of living B·lowest: walkability C−
48Purfleet-on-Thames5,881 people45.1bottom 45.9%B−#1,148 of 2,138 nationallyStrongest: walkability A+, schools B+·lowest: safety D
49Berechurch7,702 people44.8bottom 44.8%C+#1,172 of 2,138 nationallyStrongest: hazard risk A, cost of living A·lowest: safety D
50Chipping Ongar3,922 people43.6bottom 42.1%C+#1,232 of 2,138 nationallyStrongest: hazard risk B+, health B+·lowest: cost of living C−
51Runwell8,086 people43.5bottom 41.8%C+#1,238 of 2,138 nationallyStrongest: walkability B+, jobs & income B·lowest: safety C−
52Braintree43,179 people42.9bottom 40.0%C+#1,277 of 2,138 nationallyStrongest: walkability A−, cost of living B·lowest: safety C−
53Earls Colne3,360 people42.8bottom 39.7%C+#1,282 of 2,138 nationallyStrongest: walkability B, cost of living B·lowest: schools C−
54Stanford-le-Hope29,527 people42.7bottom 39.6%C+#1,285 of 2,138 nationallyStrongest: walkability B+, jobs & income B−·lowest: cost of living C
55Halstead13,902 people42.6bottom 39.5%C+#1,288 of 2,138 nationallyStrongest: cost of living B, walkability B·lowest: hazard risk C−
56South Ockendon22,441 people42.0bottom 38.1%C+#1,319 of 2,138 nationallyStrongest: walkability A, hazard risk A·lowest: health D
57Mayland3,740 people41.6bottom 37.4%C+#1,333 of 2,138 nationallyStrongest: jobs & income B+, safety B·lowest: schools D−
58Maldon23,389 people41.6bottom 37.2%C+#1,336 of 2,138 nationallyStrongest: walkability B+, cost of living B·lowest: hazard risk D
59Aveley9,364 people41.4bottom 36.8%C+#1,346 of 2,138 nationallyStrongest: schools A, walkability A−·lowest: safety C−
60Hatfield Peverel3,622 people41.2bottom 36.4%C+#1,355 of 2,138 nationallyStrongest: jobs & income B+, walkability B·lowest: cost of living C−
61Grays44,340 people40.9bottom 35.7%C+#1,370 of 2,138 nationallyStrongest: walkability A, hazard risk A·lowest: safety C−
62Southend-on-Sea182,295 people39.6bottom 32.8%C#1,430 of 2,138 nationallyStrongest: walkability A+, schools A−·lowest: safety D
63Witham27,395 people38.4bottom 30.3%C#1,484 of 2,138 nationallyStrongest: walkability A−, cost of living B·lowest: safety C−
64Canvey Island38,004 people38.0bottom 29.1%C#1,510 of 2,138 nationallyStrongest: walkability B+, schools B·lowest: health C−
65Kirby Cross6,036 people37.0bottom 26.4%C#1,568 of 2,138 nationallyStrongest: hazard risk A, safety A−·lowest: cost of living D−
66Rochford12,617 people36.2bottom 23.9%C−#1,622 of 2,138 nationallyStrongest: walkability B+, schools C+·lowest: safety D
67Southminster4,548 people36.1bottom 23.6%C−#1,628 of 2,138 nationallyStrongest: cost of living B+, walkability B·lowest: schools D−
68Tilbury14,187 people35.9bottom 23.1%C−#1,639 of 2,138 nationallyStrongest: walkability A+, schools B+·lowest: safety D−
69Brightlingsea8,678 people35.8bottom 23.0%C−#1,642 of 2,138 nationallyStrongest: walkability B, schools B−·lowest: cost of living D
70Great Wakering6,774 people35.3bottom 21.5%C−#1,673 of 2,138 nationallyStrongest: hazard risk B−, walkability B−·lowest: schools D
71Chadwell St Mary10,680 people35.2bottom 21.2%C−#1,680 of 2,138 nationallyStrongest: hazard risk A, walkability A−·lowest: safety D
72East Tilbury5,751 people34.3bottom 18.9%C−#1,731 of 2,138 nationallyStrongest: walkability A−, jobs & income B−·lowest: safety C−
73Silver End3,913 people32.9bottom 15.9%C−#1,795 of 2,138 nationallyStrongest: cost of living B−, jobs & income C·lowest: walkability C
74Frinton-on-Sea4,865 people32.1bottom 13.9%D#1,838 of 2,138 nationallyStrongest: walkability A−, hazard risk B·lowest: cost of living D−
75Harlow93,570 people32.0bottom 13.8%D#1,839 of 2,138 nationallyStrongest: walkability A−, hazard risk B·lowest: safety D
76Waltham Abbey18,645 people30.5bottom 11.4%D#1,891 of 2,138 nationallyStrongest: walkability A−, jobs & income C+·lowest: safety D
77Basildon115,935 people29.3bottom 9.6%D#1,931 of 2,138 nationallyStrongest: walkability A, hazard risk B·lowest: safety D−
78Walton-on-the-Naze6,980 people17.4bottom 0.2%D−#2,134 of 2,138 nationallyStrongest: walkability A−, health C−·lowest: jobs & income D−
79Harwich20,219 people16.1bottom 0.1%D−#2,136 of 2,138 nationallyStrongest: walkability A−, health C−·lowest: jobs & income D
80Clacton-on-Sea53,190 people14.8bottom 0.1%D−#2,137 of 2,138 nationallyStrongest: walkability A−, hazard risk B−·lowest: schools D−
81Jaywick5,080 people13.9bottom 0.1%D−#2,138 of 2,138 nationallyStrongest: walkability B, cost of living C+·lowest: safety D−
Quick answers

Questions people ask

What is the best place to live in Essex?

Saffron Walden ranks first of 81 graded towns of 2,500+: schools (A+) and health (A) are its strongest grades; hazard risk (C) is its lowest. Stansted Mountfitchet and Newport follow.

How are these towns ranked?

By the overall grade, which blends seven livability grades (cost of living, safety, schools, health, jobs & income, walkability, hazard risk) from public data, each comparing a town with every UK town. The rank is within Essex. How grades work.

Why isn’t my town on this list?

The list covers places of 2,500+ residents with an overall grade. Smaller places, and towns missing figures the overall grade needs, show their subject grades on their own pages; every town in Essex is listed on the county page.

County by county

Best places to live, county by county

Sources: TownRatings grades: our own summary of the data, ranked against UK towns only. All under the Open Government Licence v3.0.

Contains public sector information licensed under the Open Government Licence v3.0. Contains HM Land Registry data © Crown copyright and database right 2026. Contains OS data © Crown copyright and database right 2026 (ONS boundaries). Northern Ireland: Source: NISRA; contains Land & Property Services data and Ordnance Survey of Northern Ireland information, © Crown copyright, licensed under the Open Government Licence v3.0. Scotland: contains National Records of Scotland data, Registers of Scotland data and SEPA data, © Crown copyright / © SEPA 2025, licensed under the Open Government Licence v3.0.