Guest, Sign inJoin
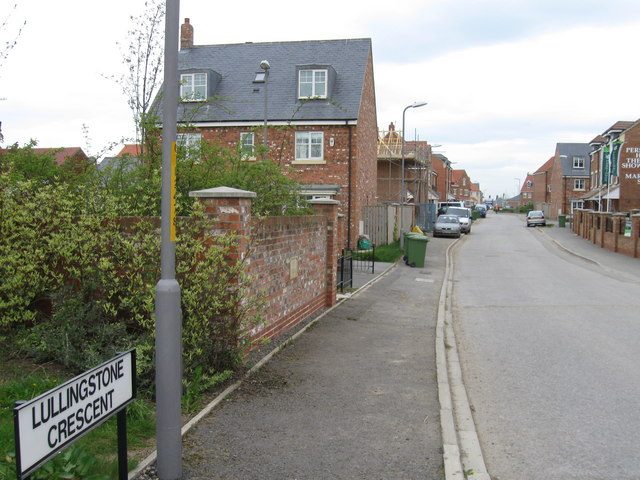
Lullingstone Crescent, Ingleby BarwickIngleby Barwick, #1 on this list · Photo: Alex McGregor · CC BY-SA 2.0
North Yorkshire · 2026

Best places to live in North Yorkshire

Ingleby Barwick ranks first of 54 North Yorkshire towns of 2,500+ residents, and #10 of 2,138 UK towns. 16 of the 54 grade A− or better; scores run from 78.9 down to 22.0.

The overall score, sorted within North Yorkshire; the letter compares each town with every UK town, and its rank among UK towns sits beside it. How grades work

#1

Ingleby Barwick

North Yorkshire · 23,380 people
A+

Score 78.9·#10 of 2,138 UK towns

Strongest: jobs & income A+, schools A+·lowest: walkability D−
#2

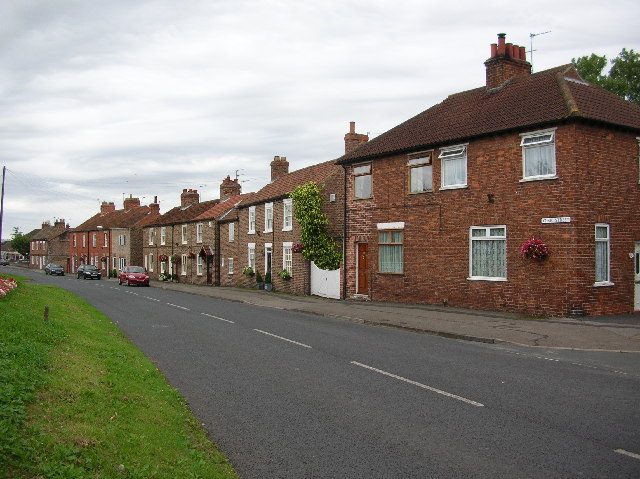
Dunnington

North Yorkshire · 3,256 people
A+

Score 71.4·#96 of 2,138 UK towns

Strongest: safety A+, jobs & income A+·lowest: cost of living D

#3

Pannal

North Yorkshire · 2,530 people
A

Score 70.7·#114 of 2,138 UK towns

Strongest: jobs & income A+, safety A+·lowest: cost of living D

All 54 towns, ranked

By overall score against UK towns; ranks are within North Yorkshire, and each UK rank links to the national list. The score (0–100) blends the seven livability grades and sets the order; the letter places that score among UK towns of 2,500+, and A+ is the top 5%, so neighbours on the list often share a letter.

Every town in North Yorkshire →

56 towns, 54 ranked.

#TownScoreGrade · UK rankWhat drives it
1Ingleby Barwick23,380 people78.9top 0.5%A+#10 of 2,138 nationallyStrongest: jobs & income A+, schools A+·lowest: walkability D−
2Dunnington3,256 people71.4top 4.6%A+#96 of 2,138 nationallyStrongest: safety A+, jobs & income A+·lowest: cost of living D
3Pannal2,530 people70.7top 5.5%A#114 of 2,138 nationallyStrongest: jobs & income A+, safety A+·lowest: cost of living D
4Bishopthorpe3,333 people70.2top 5.9%A#123 of 2,138 nationallyStrongest: safety A+, jobs & income A·lowest: hazard risk D−
5Haxby10,176 people67.9top 9.1%A#188 of 2,138 nationallyStrongest: jobs & income A, safety A·lowest: hazard risk C−
6Copmanthorpe3,671 people67.5top 9.6%A#198 of 2,138 nationallyStrongest: safety A+, jobs & income A·lowest: cost of living C−
7Strensall6,060 people65.6top 12.3%A#255 of 2,138 nationallyStrongest: jobs & income A, safety A·lowest: cost of living C−
8Upper Poppleton3,520 people64.9top 13.5%A#279 of 2,138 nationallyStrongest: jobs & income A+, safety A+·lowest: cost of living D
9Harrogate75,522 people64.2top 14.3%A#296 of 2,138 nationallyStrongest: walkability A, jobs & income A−·lowest: safety C+
10Great Ayton4,348 people62.4top 16.9%A−#353 of 2,138 nationallyStrongest: health A−, cost of living A−·lowest: hazard risk C−
11Ripon16,593 people62.3top 17.4%A−#363 of 2,138 nationallyStrongest: walkability A, schools A−·lowest: hazard risk C
12Knaresborough15,781 people61.0top 20.8%A−#434 of 2,138 nationallyStrongest: walkability A−, schools A−·lowest: hazard risk C−
13Thorpe Willoughby3,482 people60.6top 21.5%A−#449 of 2,138 nationallyStrongest: health A−, safety B+·lowest: walkability C−
14Romanby3,825 people59.3top 23.9%A−#500 of 2,138 nationallyStrongest: safety A−, jobs & income A−·lowest: schools D
15Bedale3,289 people59.2top 24.0%A−#504 of 2,138 nationallyStrongest: schools A, walkability A−·lowest: safety C
16Marske-by-the-Sea7,576 people58.8top 24.7%A−#519 of 2,138 nationallyStrongest: hazard risk A, schools A·lowest: jobs & income C+
17Yarm9,601 people57.0top 28.2%B+#593 of 2,138 nationallyStrongest: schools A, jobs & income A−·lowest: safety D−
18Brayton4,092 people56.6top 29.1%B+#612 of 2,138 nationallyStrongest: safety A, health B·lowest: walkability C+
19Sherburn in Elmet8,569 people56.0top 30.4%B+#641 of 2,138 nationallyStrongest: schools A−, jobs & income B+·lowest: hazard risk D
20New Marske2,990 people55.4top 32.1%B+#675 of 2,138 nationallyStrongest: hazard risk A, schools A−·lowest: walkability D
21Richmond8,076 people54.3top 34.6%B+#729 of 2,138 nationallyStrongest: walkability A−, cost of living B·lowest: jobs & income C+
22Tadcaster6,339 people53.4top 35.9%B#757 of 2,138 nationallyStrongest: walkability B+, jobs & income B·lowest: hazard risk C
23Barlby3,499 people53.2top 36.2%B#764 of 2,138 nationallyStrongest: jobs & income A−, health A−·lowest: hazard risk D−
24Easingwold5,036 people53.1top 36.5%B#770 of 2,138 nationallyStrongest: walkability A−, health B+·lowest: cost of living C
25Boroughbridge3,064 people52.8top 36.9%B#779 of 2,138 nationallyStrongest: health B+, hazard risk B+·lowest: safety C
26Cross Hills4,809 people51.7top 39.2%B#828 of 2,138 nationallyStrongest: walkability B+, jobs & income B+·lowest: hazard risk D−
27Skipton15,050 people50.4top 42.1%B#891 of 2,138 nationallyStrongest: walkability A+, schools A−·lowest: hazard risk D−
28Stokesley4,906 people50.1top 42.7%B#903 of 2,138 nationallyStrongest: health A−, walkability B−·lowest: hazard risk D
29Settle2,710 people48.7top 46.1%B−#977 of 2,138 nationallyStrongest: walkability A+, health B+·lowest: schools D
30Sutton-in-Craven2,719 people47.6top 48.6%B−#1,031 of 2,138 nationallyStrongest: walkability B+, cost of living B·lowest: hazard risk D−
31York141,696 people47.3top 49.4%B−#1,047 of 2,138 nationallyStrongest: walkability A+, schools A−·lowest: hazard risk D
32Skelton (Redcar and Cleveland)6,895 people47.2top 49.4%B−#1,048 of 2,138 nationallyStrongest: hazard risk A, schools A−·lowest: jobs & income C−
33Huntington12,420 people47.0top 50.0%B−#1,060 of 2,138 nationallyStrongest: walkability A, jobs & income B·lowest: hazard risk C
34Saltburn-by-the-Sea5,874 people46.9bottom 49.8%B−#1,065 of 2,138 nationallyStrongest: schools A−, walkability B+·lowest: jobs & income C−
35Sowerby4,727 people46.7bottom 49.3%B−#1,076 of 2,138 nationallyStrongest: cost of living B+, walkability B+·lowest: schools D
36Brotton5,399 people46.6bottom 49.1%B−#1,080 of 2,138 nationallyStrongest: hazard risk A, cost of living A−·lowest: jobs & income D
37Norton-on-Derwent7,909 people45.0bottom 45.3%B−#1,163 of 2,138 nationallyStrongest: walkability A, hazard risk B·lowest: jobs & income C
38Guisborough18,091 people44.9bottom 45.1%B−#1,166 of 2,138 nationallyStrongest: cost of living B+, schools B·lowest: hazard risk C−
39Loftus4,273 people44.3bottom 43.3%C+#1,205 of 2,138 nationallyStrongest: schools A, cost of living A·lowest: jobs & income D−
40Redcar37,666 people42.2bottom 38.9%C+#1,301 of 2,138 nationallyStrongest: cost of living A−, schools A−·lowest: safety D
41Thirsk5,891 people42.2bottom 38.7%C+#1,304 of 2,138 nationallyStrongest: walkability A−, health B·lowest: hazard risk D
42Kirkbymoorside2,763 people40.3bottom 34.6%C#1,393 of 2,138 nationallyStrongest: hazard risk A, walkability A−·lowest: schools D−
43Pickering7,260 people38.5bottom 30.4%C#1,482 of 2,138 nationallyStrongest: walkability A, schools B−·lowest: cost of living D
44Northallerton13,314 people38.1bottom 29.4%C#1,504 of 2,138 nationallyStrongest: walkability A+, cost of living B+·lowest: safety D
45Selby19,480 people36.2bottom 24.0%C−#1,619 of 2,138 nationallyStrongest: walkability A, cost of living A−·lowest: hazard risk D−
46Thornaby-on-Tees23,352 people35.4bottom 21.9%C−#1,665 of 2,138 nationallyStrongest: cost of living A, walkability B+·lowest: safety D−
47East Ayton and West Ayton2,809 people35.3bottom 21.4%C−#1,676 of 2,138 nationallyStrongest: safety A−, health B·lowest: cost of living D−
48Malton6,320 people34.1bottom 18.5%C−#1,738 of 2,138 nationallyStrongest: walkability A, safety C+·lowest: cost of living D
49Hunmanby2,900 people33.9bottom 18.0%C−#1,750 of 2,138 nationallyStrongest: hazard risk A, safety B·lowest: cost of living C−
50Middlesbrough148,232 people33.4bottom 17.0%C−#1,771 of 2,138 nationallyStrongest: cost of living A−, walkability B+·lowest: safety D−
51Filey6,664 people31.5bottom 13.2%D#1,854 of 2,138 nationallyStrongest: walkability A, hazard risk A·lowest: jobs & income D
52Eston29,625 people30.7bottom 11.8%D#1,884 of 2,138 nationallyStrongest: cost of living A, walkability B·lowest: safety D−
53Scarborough59,505 people23.6bottom 3.1%D−#2,071 of 2,138 nationallyStrongest: walkability A+, hazard risk C+·lowest: safety D
54Whitby12,603 people22.0bottom 1.8%D−#2,100 of 2,138 nationallyStrongest: walkability A+, hazard risk C·lowest: cost of living D−
–Catterick Garrison town2,718 people70.1top 6.1%AStrongest: schools A, safety A·lowest: hazard risk D
–Catterick Garrison Garrison town14,212 people49.9top 43.1%BStrongest: walkability A, cost of living A·lowest: schools C−

Military garrison towns and university campuses keep their grades but aren’t ranked: most residents serve in the forces or are students.

Quick answers

Questions people ask

What is the best place to live in North Yorkshire?

Ingleby Barwick ranks first of 54 graded towns of 2,500+: jobs & income (A+) and schools (A+) are its strongest grades; walkability (D−) is its lowest. Dunnington and Pannal follow.

How are these towns ranked?

By the overall grade, which blends seven livability grades (cost of living, safety, schools, health, jobs & income, walkability, hazard risk) from public data, each comparing a town with every UK town. The rank is within North Yorkshire. How grades work.

Why isn’t my town on this list?

The list covers places of 2,500+ residents with an overall grade. Smaller places, and towns missing figures the overall grade needs, show their subject grades on their own pages; every town in North Yorkshire is listed on the county page.

County by county

Best places to live, county by county

Sources: TownRatings grades: our own summary of the data, ranked against UK towns only. All under the Open Government Licence v3.0.

Contains public sector information licensed under the Open Government Licence v3.0. Contains HM Land Registry data © Crown copyright and database right 2026. Contains OS data © Crown copyright and database right 2026 (ONS boundaries). Northern Ireland: Source: NISRA; contains Land & Property Services data and Ordnance Survey of Northern Ireland information, © Crown copyright, licensed under the Open Government Licence v3.0. Scotland: contains National Records of Scotland data, Registers of Scotland data and SEPA data, © Crown copyright / © SEPA 2025, licensed under the Open Government Licence v3.0.