Guest, Sign inJoin
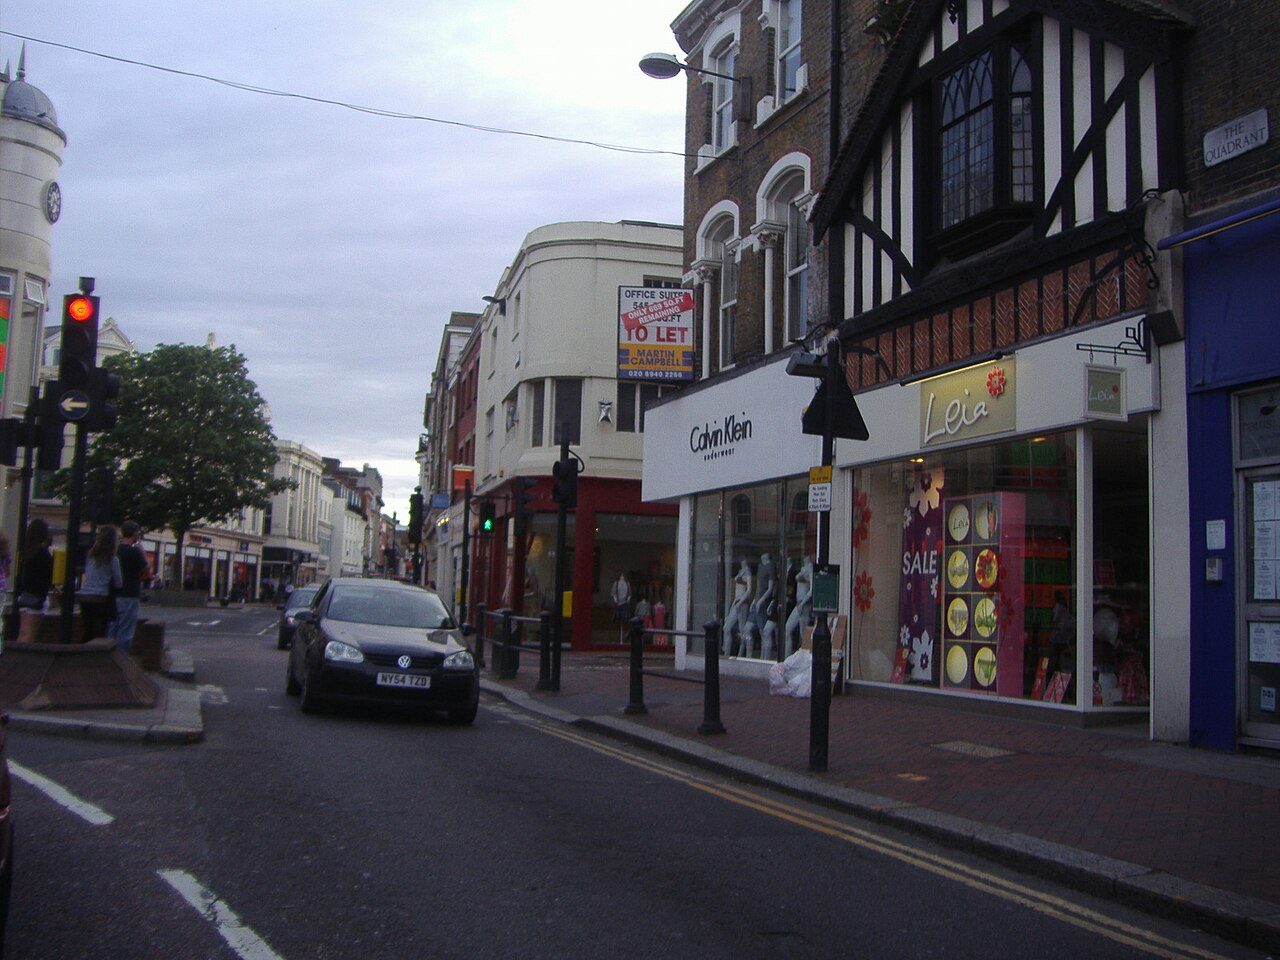
The Quadrant, Richmond town centreRichmond upon Thames, #1 on this list · Photo: David Howard · CC BY-SA 2.0
London · 2026

London’s boroughs, ranked

Richmond upon Thames ranks first of 33 London boroughs, and #152 of 2,138 UK towns. 6 of the 33 grade A− or better; scores run from 69.2 down to 42.3.

The overall score, sorted within London; the letter compares each borough with every UK town, and its rank among UK towns sits beside it. How grades work

#1

Richmond upon Thames

London · 192,888 people
A

Score 69.2·#152 of 2,138 UK towns

Strongest: walkability A+, schools A+·lowest: hazard risk C−
#2

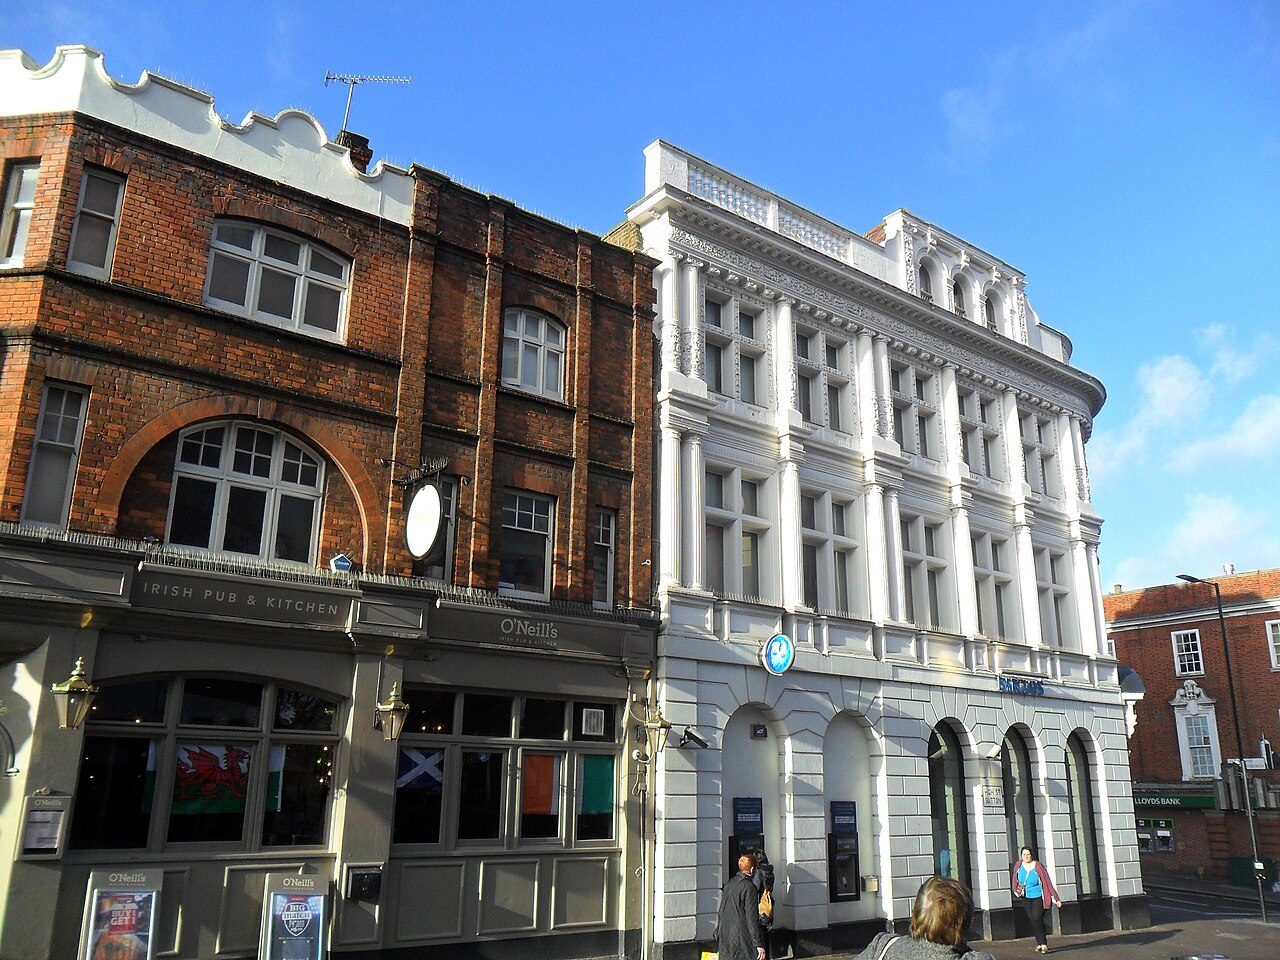
Sutton

London · 208,858 people
A

Score 68.2·#176 of 2,138 UK towns

Strongest: walkability A+, schools A+·lowest: safety C

#3

Kingston upon Thames

London · 166,333 people
A

Score 68.1·#179 of 2,138 UK towns

Strongest: walkability A+, schools A+·lowest: hazard risk D

All 33 boroughs, ranked

By overall score against UK towns; ranks are within London, and each UK rank links to the national list. The score (0–100) blends the seven livability grades and sets the order; the letter places that score among UK towns of 2,500+, and A+ is the top 5%, so neighbours on the list often share a letter.

London’s boroughs →

33 boroughs.

#TownScoreGrade · UK rankWhat drives it
1Richmond upon Thames192,888 people69.2top 7.4%A#152 of 2,138 nationallyStrongest: walkability A+, schools A+·lowest: hazard risk C−
2Sutton208,858 people68.2top 8.5%A#176 of 2,138 nationallyStrongest: walkability A+, schools A+·lowest: safety C
3Kingston upon Thames166,333 people68.1top 8.7%A#179 of 2,138 nationallyStrongest: walkability A+, schools A+·lowest: hazard risk D
4Bromley325,469 people66.8top 10.6%A#219 of 2,138 nationallyStrongest: walkability A+, schools A·lowest: hazard risk C−
5Bexley246,074 people61.5top 18.9%A−#395 of 2,138 nationallyStrongest: walkability A+, schools A·lowest: safety C
6City of London7,820 people61.3top 20.0%A−#417 of 2,138 nationallyStrongest: walkability A+, jobs & income A+·lowest: safety D−
7Merton214,931 people58.0top 26.7%B+#561 of 2,138 nationallyStrongest: walkability A+, schools A·lowest: hazard risk C−
8Harrow260,534 people57.6top 27.2%B+#573 of 2,138 nationallyStrongest: walkability A+, schools A·lowest: hazard risk C
9Barnet388,572 people56.3top 29.7%B+#625 of 2,138 nationallyStrongest: walkability A+, schools A+·lowest: safety C
10Havering259,401 people54.8top 33.4%B+#704 of 2,138 nationallyStrongest: walkability A+, schools B+·lowest: safety C
11Wandsworth326,725 people54.2top 34.8%B+#734 of 2,138 nationallyStrongest: walkability A+, schools A·lowest: hazard risk C−
12Kensington and Chelsea143,348 people54.2top 34.9%B+#736 of 2,138 nationallyStrongest: walkability A+, schools A+·lowest: safety D
13Redbridge309,509 people53.5top 35.8%B#755 of 2,138 nationallyStrongest: walkability A+, schools A+·lowest: safety C−
14Hillingdon307,089 people52.3top 38.4%B#810 of 2,138 nationallyStrongest: walkability A+, schools A−·lowest: safety C−
15Hounslow286,591 people49.6top 44.1%B#933 of 2,138 nationallyStrongest: walkability A+, schools A·lowest: safety C−
16Hammersmith and Fulham182,187 people49.0top 45.7%B−#968 of 2,138 nationallyStrongest: walkability A+, schools A+·lowest: safety D
17Westminster203,571 people48.9top 45.8%B−#970 of 2,138 nationallyStrongest: walkability A+, schools A·lowest: safety D−
18Croydon389,242 people48.8top 45.9%B−#973 of 2,138 nationallyStrongest: walkability A+, schools B+·lowest: safety D
19Ealing367,271 people48.5top 46.5%B−#984 of 2,138 nationallyStrongest: walkability A+, schools A·lowest: safety C−
20Southwark307,076 people48.0top 47.7%B−#1,011 of 2,138 nationallyStrongest: walkability A+, schools A·lowest: safety D
21Waltham Forest278,129 people46.9bottom 49.7%B−#1,067 of 2,138 nationallyStrongest: walkability A+, schools A·lowest: safety C−
22Camden209,342 people46.3bottom 48.2%B−#1,099 of 2,138 nationallyStrongest: walkability A+, hazard risk A·lowest: safety D−
23Newham351,065 people45.3bottom 46.4%B−#1,139 of 2,138 nationallyStrongest: walkability A+, schools A·lowest: safety D
24Greenwich288,117 people45.1bottom 45.7%B−#1,153 of 2,138 nationallyStrongest: walkability A+, schools A−·lowest: safety D
25Enfield329,822 people44.2bottom 43.1%C+#1,209 of 2,138 nationallyStrongest: walkability A+, schools A−·lowest: safety C−
26Tower Hamlets311,072 people43.9bottom 42.4%C+#1,225 of 2,138 nationallyStrongest: walkability A+, schools A·lowest: safety D
27Islington216,309 people43.5bottom 41.8%C+#1,237 of 2,138 nationallyStrongest: walkability A+, hazard risk A·lowest: safety D
28Lambeth317,108 people43.5bottom 41.7%C+#1,240 of 2,138 nationallyStrongest: walkability A+, schools B+·lowest: safety D
29Haringey264,069 people43.0bottom 40.2%C+#1,273 of 2,138 nationallyStrongest: walkability A+, schools A−·lowest: safety D
30Lewisham300,764 people42.9bottom 40.1%C+#1,275 of 2,138 nationallyStrongest: walkability A+, schools B+·lowest: safety D
31Brent340,611 people42.8bottom 39.7%C+#1,283 of 2,138 nationallyStrongest: walkability A+, schools A−·lowest: cost of living D
32Hackney258,464 people42.4bottom 39.2%C+#1,293 of 2,138 nationallyStrongest: walkability A+, schools A·lowest: safety D
33Barking and Dagenham218,236 people42.3bottom 38.9%C+#1,300 of 2,138 nationallyStrongest: walkability A+, schools B+·lowest: safety D
Quick answers

Questions people ask

What is the best London borough to live in?

Richmond upon Thames ranks first of 33 boroughs: walkability (A+) and schools (A+) are its strongest grades; hazard risk (C−) is its lowest. Sutton and Kingston upon Thames follow.

How are these boroughs ranked?

By the overall grade, which blends seven livability grades (cost of living, safety, schools, health, jobs & income, walkability, hazard risk) from public data, each comparing a town with every UK town. The rank is within London. How grades work.

Why isn’t my town on this list?

The list covers places of 2,500+ residents with an overall grade. Smaller places, and towns missing figures the overall grade needs, show their subject grades on their own pages; every town in London is listed on the county page.

County by county

Best places to live, county by county

Sources: TownRatings grades: our own summary of the data, ranked against UK towns only. All under the Open Government Licence v3.0.

Contains public sector information licensed under the Open Government Licence v3.0. Contains HM Land Registry data © Crown copyright and database right 2026. Contains OS data © Crown copyright and database right 2026 (ONS boundaries). Northern Ireland: Source: NISRA; contains Land & Property Services data and Ordnance Survey of Northern Ireland information, © Crown copyright, licensed under the Open Government Licence v3.0. Scotland: contains National Records of Scotland data, Registers of Scotland data and SEPA data, © Crown copyright / © SEPA 2025, licensed under the Open Government Licence v3.0.