Guest, Sign inJoin
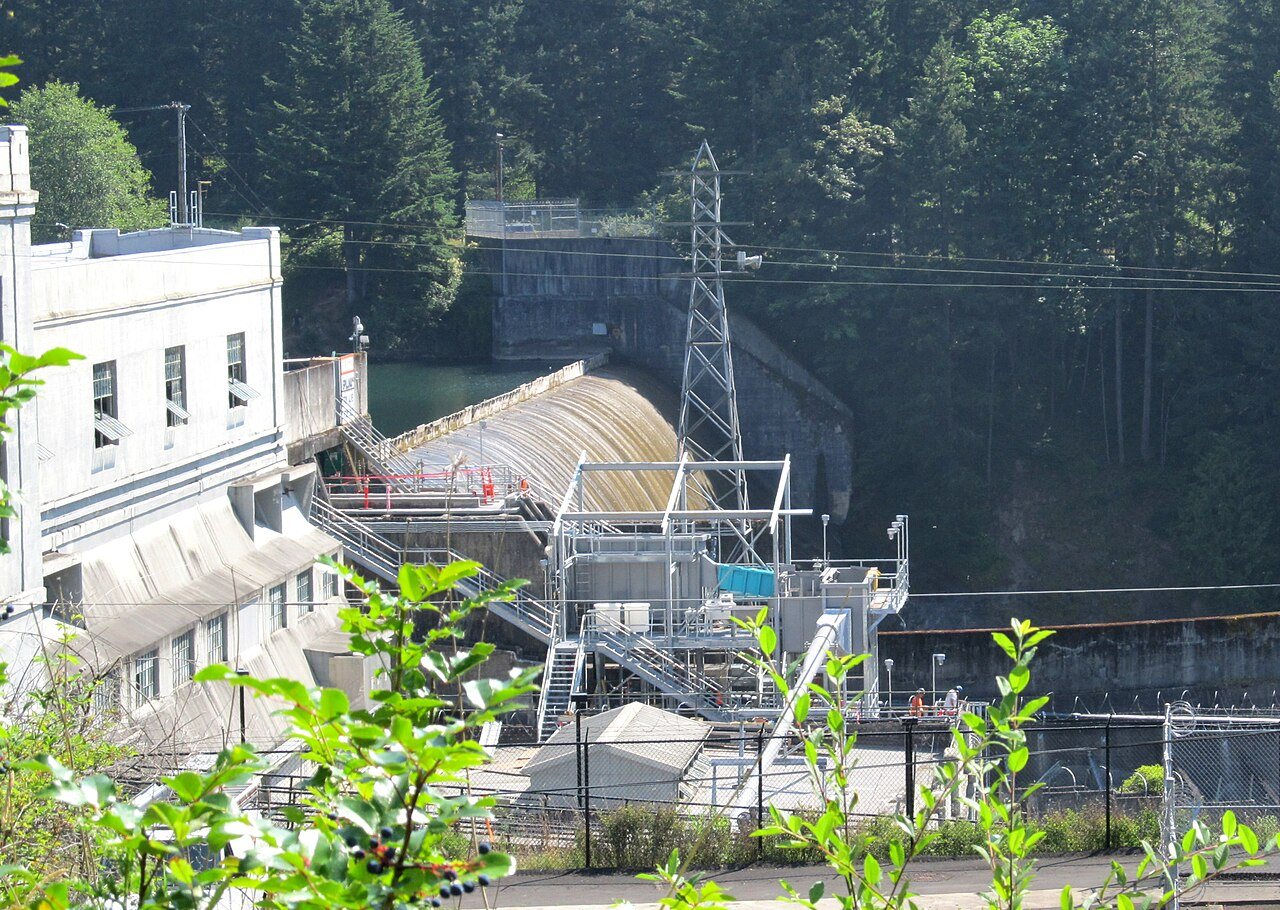
River Mill Hydroelectric ProjectEstacada, #1 on this list · River Mill Hydroelectric Project · Photo: Lockley · CC BY-SA 3.0
Oregon rankings · Growth

Fastest-growing towns in Oregon

Estacada has grown fastest of Oregon’s 106 towns of 2,500+: up 31.7% from 4,414 residents in April 2020 to an estimated 5,814 in July 2025 (Census Bureau estimates). The typical town here changed +0.5%; 46 of the 106 lost residents.

Census Bureau population estimates, Vintage 2025: July 1, 2025 against the April 2020 base, both on January 2025 town lines (people a town annexed are in its base, not its growth). Estimates, not counts. Unincorporated communities (census-designated places) get no estimate, so they aren’t listed. A described list: no letters. How grades work

#1

Estacada

Clackamas County
+31.7%

4,414 in 2020·5,814 in 2025·+1,400 people

#2

Happy Valley

Clackamas County
+23.5%

23,411 in 2020·28,916 in 2025·+5,505 people

#3

Woodburn

Marion County
+22.5%

26,084 in 2020·31,948 in 2025·+5,864 people

All 106 towns

Growth since 2020, highest first.

106 towns ranked. Not here? See why a town may be missing.

#TownGrowth since 2020People addedResidents
1EstacadaClackamas County+31.7%+1,4004,414 → 5,814April 2020 → July 2025
2Happy ValleyClackamas County+23.5%+5,50523,411 → 28,916April 2020 → July 2025
3WoodburnMarion County+22.5%+5,86426,084 → 31,948April 2020 → July 2025
4CorneliusWashington County+21.8%+2,77912,741 → 15,520April 2020 → July 2025
5MillersburgLinn County+17.5%+5333,050 → 3,5832020 base revised by Census
6BoardmanMorrow County+17.4%+6673,828 → 4,495April 2020 → July 2025
7RedmondDeschutes County+15.7%+5,24133,306 → 38,547April 2020 → July 2025
8PrinevilleCrook County+11.8%+1,26410,730 → 11,994April 2020 → July 2025
9UmatillaUmatilla County+11.4%+8397,381 → 8,220April 2020 → July 2025
10LebanonLinn County+9.4%+1,74618,521 → 20,267April 2020 → July 2025
11PhoenixJackson County+8.8%+3974,523 → 4,920April 2020 → July 2025
12BendDeschutes County+8.2%+8,11099,232 → 107,342April 2020 → July 2025
13Wood VillageMultnomah County+7.0%+3094,397 → 4,706April 2020 → July 2025
14PhilomathBenton County+6.5%+3475,352 → 5,699April 2020 → July 2025
15LafayetteYamhill County+6.3%+2774,428 → 4,705April 2020 → July 2025
16Junction CityLane County+6.3%+4256,799 → 7,224April 2020 → July 2025
17DallasPolk County+5.9%+1,00016,890 → 17,890April 2020 → July 2025
18NewbergYamhill County+5.7%+1,45325,443 → 26,896April 2020 → July 2025
19TigardWashington County+5.7%+3,10354,826 → 57,929April 2020 → July 2025
20SandyClackamas County+5.4%+68212,641 → 13,323April 2020 → July 2025
21MadrasJefferson County+4.8%+3617,468 → 7,829April 2020 → July 2025
22Sweet HomeLinn County+4.8%+4739,835 → 10,308April 2020 → July 2025
23MilwaukieClackamas County+4.5%+95421,160 → 22,114April 2020 → July 2025
24St. HelensColumbia County+4.5%+61913,831 → 14,450April 2020 → July 2025
25HillsboroWashington County+4.4%+4,636106,490 → 111,126April 2020 → July 2025
26WilsonvilleClackamas County+4.3%+1,14326,690 → 27,833April 2020 → July 2025
27Forest GroveWashington County+4.0%+1,04026,212 → 27,252April 2020 → July 2025
28MonmouthPolk County+3.7%+41411,129 → 11,543April 2020 → July 2025
29SalemMarion County+3.6%+6,263175,516 → 181,779April 2020 → July 2025
30IndependencePolk County+3.6%+3519,844 → 10,195April 2020 → July 2025
31FairviewMultnomah County+3.3%+34810,414 → 10,762April 2020 → July 2025
32ScappooseColumbia County+3.2%+2558,002 → 8,257April 2020 → July 2025
33Lincoln CityLincoln County+3.1%+3009,817 → 10,117April 2020 → July 2025
34HarrisburgLinn County+3.0%+1113,654 → 3,765April 2020 → July 2025
35StaytonMarion County+3.0%+2498,239 → 8,488April 2020 → July 2025
36CorvallisBenton County+2.6%+1,56259,937 → 61,499April 2020 → July 2025
37HermistonUmatilla County+2.5%+48419,422 → 19,906April 2020 → July 2025
38Cottage GroveLane County+2.3%+24710,604 → 10,851April 2020 → July 2025
39Mount AngelMarion County+1.8%+623,392 → 3,454April 2020 → July 2025
40Eagle PointJackson County+1.8%+1769,685 → 9,861April 2020 → July 2025
41OntarioMalheur County+1.8%+20711,750 → 11,957April 2020 → July 2025
42NyssaMalheur County+1.7%+543,203 → 3,257April 2020 → July 2025
43Oregon CityClackamas County+1.5%+58237,593 → 38,175April 2020 → July 2025
44Klamath FallsKlamath County+1.5%+33721,774 → 22,111April 2020 → July 2025
45SutherlinDouglas County+1.4%+1178,518 → 8,635April 2020 → July 2025
46NewportLincoln County+1.3%+13510,248 → 10,383April 2020 → July 2025
47AlbanyLinn County+1.0%+53856,356 → 56,894April 2020 → July 2025
48McMinnvilleYamhill County+0.7%+25634,391 → 34,647April 2020 → July 2025
49EugeneLane County+0.7%+1,281177,337 → 178,618April 2020 → July 2025
50TualatinWashington County+0.7%+19927,940 → 28,139April 2020 → July 2025
51Central PointJackson County+0.7%+12619,013 → 19,139April 2020 → July 2025
52WinstonDouglas County+0.6%+355,645 → 5,680April 2020 → July 2025
53WarrentonClatsop County+0.6%+356,277 → 6,312April 2020 → July 2025
54MedfordJackson County+0.5%+45386,041 → 86,494April 2020 → July 2025
55SherwoodWashington County+0.4%+7920,456 → 20,535April 2020 → July 2025
56BeavertonWashington County+0.3%+26597,577 → 97,842April 2020 → July 2025
57Myrtle CreekDouglas County+0.3%+93,472 → 3,481April 2020 → July 2025
58RoseburgDouglas County+0.2%+5023,643 → 23,693April 2020 → July 2025
59Grants PassJosephine County+0.2%+7039,169 → 39,239April 2020 → July 2025
60TalentJackson County+0.1%+86,288 → 6,296April 2020 → July 2025
61AumsvilleMarion County−0.1%−44,245 → 4,241April 2020 → July 2025
62FlorenceLane County−0.1%−129,480 → 9,468April 2020 → July 2025
63SilvertonMarion County−0.2%−1810,468 → 10,450April 2020 → July 2025
64Baker CityBaker County−0.3%−2910,100 → 10,071April 2020 → July 2025
65PendletonUmatilla County−0.5%−7917,068 → 16,989April 2020 → July 2025
66KeizerMarion County−0.6%−22639,366 → 39,140April 2020 → July 2025
67TillamookTillamook County−0.7%−355,197 → 5,162April 2020 → July 2025
68SpringfieldLane County−0.7%−45761,888 → 61,431April 2020 → July 2025
69Hood RiverHood River County−0.8%−658,380 → 8,315April 2020 → July 2025
70DaytonYamhill County−0.8%−212,668 → 2,647April 2020 → July 2025
71BandonCoos County−0.8%−273,324 → 3,297April 2020 → July 2025
72North PlainsWashington County−0.8%−283,442 → 3,414April 2020 → July 2025
73GervaisMarion County−0.8%−222,594 → 2,572April 2020 → July 2025
74La GrandeUnion County−0.9%−11213,097 → 12,985April 2020 → July 2025
75CanbyClackamas County−0.9%−17218,176 → 18,004April 2020 → July 2025
76SeasideClatsop County−0.9%−687,160 → 7,092April 2020 → July 2025
77ReedsportDouglas County−1.0%−424,313 → 4,271April 2020 → July 2025
78HubbardMarion County−1.0%−353,434 → 3,399April 2020 → July 2025
79JeffersonMarion County−1.0%−353,334 → 3,299April 2020 → July 2025
80MolallaClackamas County−1.3%−13110,235 → 10,104April 2020 → July 2025
81GladstoneClackamas County−1.4%−16412,029 → 11,865April 2020 → July 2025
82CreswellLane County−1.4%−775,643 → 5,566April 2020 → July 2025
83Shady CoveJackson County−1.4%−443,083 → 3,039April 2020 → July 2025
84BurnsHarney County−1.4%−392,731 → 2,692April 2020 → July 2025
85DundeeYamhill County−1.5%−473,240 → 3,193April 2020 → July 2025
86VenetaLane County−1.5%−765,214 → 5,138April 2020 → July 2025
87CoquilleCoos County−1.6%−644,007 → 3,943April 2020 → July 2025
88The DallesWasco County−1.7%−27716,022 → 15,745April 2020 → July 2025
89Milton-FreewaterUmatilla County−1.8%−1267,155 → 7,029April 2020 → July 2025
90Coos BayCoos County−2.0%−31416,000 → 15,686April 2020 → July 2025
91ToledoLincoln County−2.1%−733,546 → 3,473April 2020 → July 2025
92JacksonvilleJackson County−2.3%−693,041 → 2,972April 2020 → July 2025
93GreshamMultnomah County−2.4%−2,746114,259 → 111,513April 2020 → July 2025
94AshlandJackson County−2.5%−52621,415 → 20,889April 2020 → July 2025
95OakridgeLane County−2.5%−813,208 → 3,127April 2020 → July 2025
96PortlandMultnomah County−2.7%−17,357652,466 → 635,109April 2020 → July 2025
97Lake OswegoClackamas County−2.7%−1,11140,833 → 39,722April 2020 → July 2025
98King CityWashington County−2.8%−1435,187 → 5,044April 2020 → July 2025
99West LinnClackamas County−2.9%−79927,366 → 26,567April 2020 → July 2025
100SublimityMarion County−2.9%−872,969 → 2,882April 2020 → July 2025
101SheridanYamhill County−3.0%−1916,434 → 6,2432020 base revised by Census
102TroutdaleMultnomah County−3.2%−51816,294 → 15,776April 2020 → July 2025
103North BendCoos County−3.3%−34010,306 → 9,966April 2020 → July 2025
104AstoriaClatsop County−3.4%−34610,184 → 9,838April 2020 → July 2025
105SistersDeschutes County−4.2%−1283,062 → 2,934April 2020 → July 2025
106BrookingsCurry County−4.6%−3116,742 → 6,431April 2020 → July 2025
Quick answers

Questions people ask

What is the fastest-growing town in Oregon?

Estacada (Clackamas County): it grew 31.7%, from 4,414 residents in April 2020 to an estimated 5,814 in July 2025. Happy Valley (+23.5%) and Woodburn (+22.5%) follow.

How are these towns ranked?

By the percent change in residents from the Census Bureau’s April 2020 estimates base to its latest July 1 estimate, highest first, on the exact change: two towns shown with the same tenth of a percent keep the order of their unrounded figures, and only an identical change shares a rank (T). The base is the 2020 Census count redrawn on today’s town lines, so a town that annexed land since 2020 changes only by births, deaths and moves, not by the people it took in. How grades work.

Why isn’t my town on this list?

The list covers the towns TownRatings grades that had 2,500+ residents in the 2020 estimates base (106 in Oregon). Census-designated places (unincorporated communities) have no Census Bureau estimates, so they never appear; a town incorporated since 2020, or one TownRatings merges with its twin township, isn’t listed either. Every town is on the Oregon page.

Go deeper

More Oregon lists

Every list ranks the same 2,500+ towns, so a town’s rank means the same thing on each.

All Oregon rankings →
Other states

Fastest-growing towns in other states