Guest, Sign inJoin
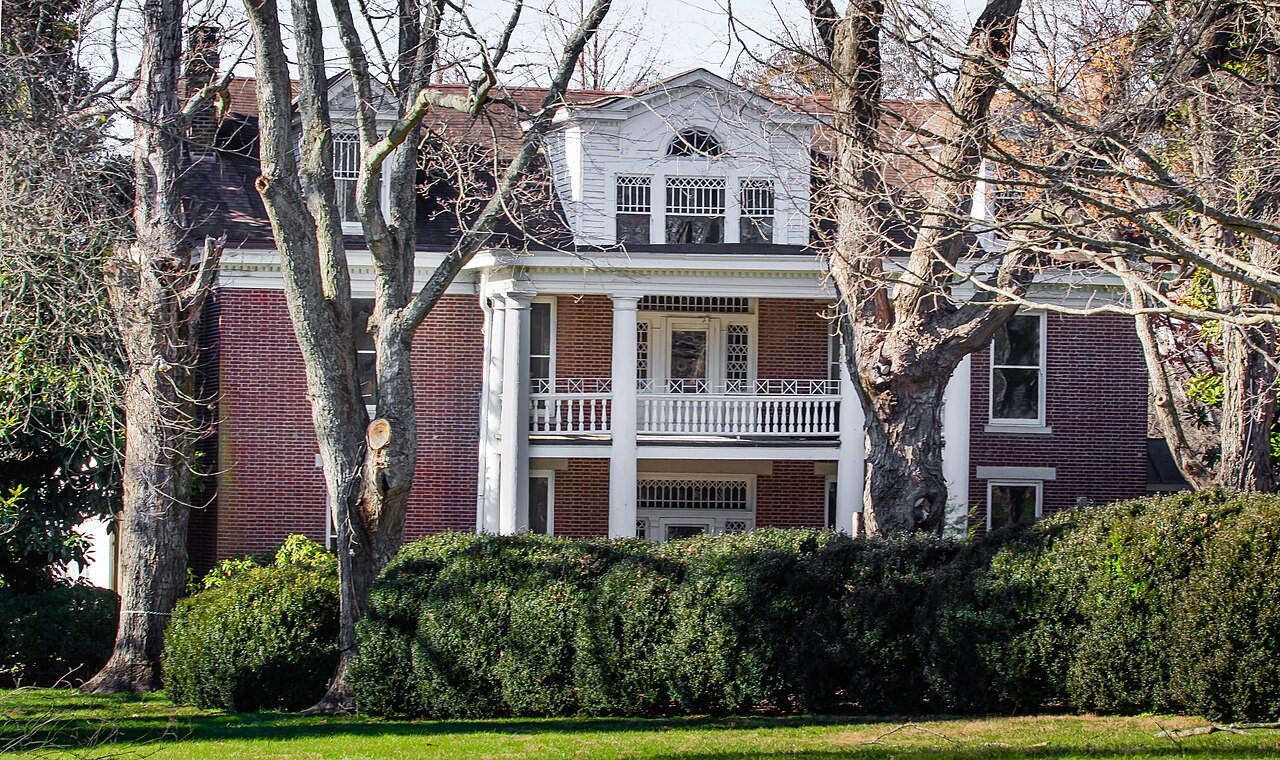
Lebanon squareLebanon, #1 on this list · Photo: Eric Polk(Epolk) · Public domain
Tennessee rankings · Growth

Fastest-growing towns in Tennessee

Lebanon has grown fastest of Tennessee’s 146 towns of 2,500+: up 38.8% from 38,495 residents in April 2020 to an estimated 53,412 in July 2025 (Census Bureau estimates). The typical town here changed +4.2%; 30 of the 146 lost residents.

Census Bureau population estimates, Vintage 2025: July 1, 2025 against the April 2020 base, both on January 2025 town lines (people a town annexed are in its base, not its growth). Estimates, not counts. Unincorporated communities (census-designated places) get no estimate, so they aren’t listed. A described list: no letters. How grades work

#1

Lebanon

Wilson County
+38.8%

38,495 in 2020·53,412 in 2025·+14,917 people

#2

White House

Sumner County
+37.3%

13,014 in 2020·17,872 in 2025·+4,858 people
All 146 towns

Growth since 2020, highest first.

146 towns ranked. Not here? See why a town may be missing.

#TownGrowth since 2020People addedResidents
1LebanonWilson County+38.8%+14,91738,495 → 53,412April 2020 → July 2025
2White HouseSumner County+37.3%+4,85813,014 → 17,872April 2020 → July 2025
3Thompson's StationWilliamson County+27.2%+2,0257,444 → 9,469April 2020 → July 2025
4AlcoaBlount County+24.6%+2,70610,983 → 13,689April 2020 → July 2025
5Lenoir CityLoudon County+24.2%+2,43910,091 → 12,530April 2020 → July 2025
6GallatinSumner County+22.8%+10,12744,463 → 54,590April 2020 → July 2025
7MillingtonShelby County+22.4%+2,37310,580 → 12,953April 2020 → July 2025
8Spring HillWilliamson County+21.0%+10,66050,676 → 61,336April 2020 → July 2025
9OaklandFayette County+20.6%+1,8508,985 → 10,835April 2020 → July 2025
10ColumbiaMaury County+20.3%+8,45941,613 → 50,072April 2020 → July 2025
11Pleasant ViewCheatham County+20.3%+9794,818 → 5,797April 2020 → July 2025
12SmyrnaRutherford County+19.2%+10,22153,100 → 63,321April 2020 → July 2025
13JonesboroughWashington County+19.1%+1,1235,867 → 6,990April 2020 → July 2025
14DandridgeJefferson County+18.0%+6023,345 → 3,947April 2020 → July 2025
15White BluffDickson County+16.9%+6533,863 → 4,516April 2020 → July 2025
16LoudonLoudon County+16.1%+9685,995 → 6,963April 2020 → July 2025
17FairviewWilliamson County+15.9%+1,4929,385 → 10,877April 2020 → July 2025
18Mount JulietWilson County+14.9%+5,86439,308 → 45,172April 2020 → July 2025
19NolensvilleWilliamson County+14.3%+1,97213,817 → 15,789April 2020 → July 2025
20DunlapSequatchie County+13.8%+7375,352 → 6,089April 2020 → July 2025
21MedinaGibson County+13.4%+6885,125 → 5,813April 2020 → July 2025
22HohenwaldLewis County+13.3%+4873,664 → 4,151April 2020 → July 2025
23ClarksvilleMontgomery County+13.2%+22,040166,789 → 188,829April 2020 → July 2025
24ManchesterCoffee County+12.8%+1,56512,211 → 13,776April 2020 → July 2025
25Oak RidgeAnderson County+12.7%+3,99531,400 → 35,395April 2020 → July 2025
26SmithvilleDeKalb County+12.1%+6085,012 → 5,620April 2020 → July 2025
27MurfreesboroRutherford County+12.0%+18,353152,825 → 171,178April 2020 → July 2025
28WinchesterFranklin County+11.3%+1,0569,382 → 10,438April 2020 → July 2025
29ShelbyvilleBedford County+11.1%+2,60323,543 → 26,146April 2020 → July 2025
30MunfordTipton County+10.9%+6886,308 → 6,996April 2020 → July 2025
31MorristownHamblen County+10.2%+3,11630,401 → 33,517April 2020 → July 2025
32LewisburgMarshall County+10.0%+1,22512,292 → 13,517April 2020 → July 2025
33CookevillePutnam County+9.7%+3,36334,849 → 38,212April 2020 → July 2025
34La VergneRutherford County+8.9%+3,44238,704 → 42,146April 2020 → July 2025
35Ashland CityCheatham County+8.8%+4595,191 → 5,650April 2020 → July 2025
36CrossvilleCumberland County+8.8%+1,06512,048 → 13,113April 2020 → July 2025
37Hartsville/Trousdale CountyTrousdale County+8.8%+1,01711,606 → 12,623April 2020 → July 2025
38Jefferson CityJefferson County+8.3%+6998,404 → 9,103April 2020 → July 2025
39AthensMcMinn County+8.3%+1,16814,095 → 15,263April 2020 → July 2025
40CoopertownRobertson County+8.2%+3664,477 → 4,843April 2020 → July 2025
41FranklinWilliamson County+8.0%+6,67083,556 → 90,226April 2020 → July 2025
42Bean StationGrainger County+7.9%+2332,957 → 3,190April 2020 → July 2025
43LafayetteMacon County+7.5%+4205,600 → 6,020April 2020 → July 2025
44ClevelandBradley County+7.0%+3,36247,810 → 51,172April 2020 → July 2025
45LynchburgMoore County+7.0%+4536,467 → 6,920April 2020 → July 2025
46SpringfieldRobertson County+6.9%+1,30118,789 → 20,090April 2020 → July 2025
47FarragutKnox County+6.9%+1,61623,505 → 25,121April 2020 → July 2025
48ChattanoogaHamilton County+6.9%+12,485181,659 → 194,144April 2020 → July 2025
49Mount PleasantMaury County+6.7%+3194,784 → 5,103April 2020 → July 2025
50AtokaTipton County+6.3%+63510,010 → 10,645April 2020 → July 2025
51LivingstonOverton County+6.3%+2453,902 → 4,147April 2020 → July 2025
52DicksonDickson County+6.1%+97916,072 → 17,051April 2020 → July 2025
53KnoxvilleKnox County+6.0%+11,361190,660 → 202,021April 2020 → July 2025
54ArlingtonShelby County+5.9%+87314,830 → 15,703April 2020 → July 2025
55DaytonRhea County+5.8%+4287,391 → 7,8192020 base revised by Census
56MadisonvilleMonroe County+5.7%+2955,133 → 5,428April 2020 → July 2025
57SomervilleFayette County+5.7%+1963,426 → 3,622April 2020 → July 2025
58Johnson CityWashington County+5.5%+3,93171,012 → 74,943April 2020 → July 2025
59LawrenceburgLawrence County+5.2%+60611,630 → 12,236April 2020 → July 2025
60EtowahMcMinn County+5.2%+1873,599 → 3,786April 2020 → July 2025
61AlgoodPutnam County+5.0%+1973,968 → 4,165April 2020 → July 2025
62WoodburyCannon County+4.7%+1262,702 → 2,828April 2020 → July 2025
63TullahomaCoffee County+4.6%+94320,336 → 21,279April 2020 → July 2025
64SweetwaterMonroe County+4.5%+2896,417 → 6,706April 2020 → July 2025
65SeviervilleSevier County+4.5%+81118,199 → 19,010April 2020 → July 2025
66Oliver SpringsAnderson County+4.4%+1463,287 → 3,433April 2020 → July 2025
67SavannahHardin County+4.4%+3277,362 → 7,6892020 base revised by Census
68HendersonChester County+4.3%+2716,319 → 6,590April 2020 → July 2025
69ClintonAnderson County+4.3%+42910,037 → 10,466April 2020 → July 2025
70Church HillHawkins County+4.3%+2996,998 → 7,297April 2020 → July 2025
71Red BankHamilton County+4.2%+50511,900 → 12,405April 2020 → July 2025
72GreenevilleGreene County+4.2%+65315,488 → 16,141April 2020 → July 2025
73HarrimanRoane County+4.2%+2505,942 → 6,192April 2020 → July 2025
74LouisvilleBlount County+4.2%+1844,378 → 4,562April 2020 → July 2025
75Nashville+4.2%+30,017715,887 → 745,904April 2020 → July 2025
76PortlandSumner County+4.1%+54413,114 → 13,658April 2020 → July 2025
77HendersonvilleSumner County+4.0%+2,48261,784 → 64,266April 2020 → July 2025
78GatlinburgSevier County+3.9%+1413,574 → 3,715April 2020 → July 2025
79TusculumGreene County+3.8%+1263,295 → 3,421April 2020 → July 2025
80BristolSullivan County+3.7%+99227,115 → 28,107April 2020 → July 2025
81KingsportSullivan County+3.6%+2,00355,527 → 57,530April 2020 → July 2025
82CollegedaleHamilton County+3.6%+39911,100 → 11,499April 2020 → July 2025
83LakelandShelby County+3.6%+49813,924 → 14,422April 2020 → July 2025
84KingstonRoane County+3.5%+2146,085 → 6,2992020 base revised by Census
85GreenbrierRobertson County+3.3%+2296,941 → 7,170April 2020 → July 2025
86OneidaScott County+3.1%+1183,781 → 3,899April 2020 → July 2025
87Soddy-DaisyHamilton County+3.1%+40313,071 → 13,474April 2020 → July 2025
88WestmorelandSumner County+3.1%+862,793 → 2,8792020 base revised by Census
89RockwoodRoane County+3.0%+1645,443 → 5,607April 2020 → July 2025
90WaverlyHumphreys County+3.0%+1284,302 → 4,430April 2020 → July 2025
91NewportCocke County+3.0%+2036,846 → 7,049April 2020 → July 2025
92Pigeon ForgeSevier County+2.9%+1886,410 → 6,598April 2020 → July 2025
93MontereyPutnam County+2.9%+802,747 → 2,827April 2020 → July 2025
94New TazewellClaiborne County+2.4%+682,778 → 2,846April 2020 → July 2025
95LexingtonHenderson County+2.4%+1947,936 → 8,130April 2020 → July 2025
96MilanGibson County+2.4%+1968,171 → 8,367April 2020 → July 2025
97SelmerMcNairy County+2.3%+1024,473 → 4,575April 2020 → July 2025
98MillersvilleSumner County+2.2%+1396,299 → 6,438April 2020 → July 2025
99MartinWeakley County+2.1%+22710,833 → 11,060April 2020 → July 2025
100Mount CarmelHawkins County+2.1%+1125,428 → 5,540April 2020 → July 2025
101McKenzieCarroll County+1.9%+1055,527 → 5,632April 2020 → July 2025
102CentervilleHickman County+1.8%+643,525 → 3,589April 2020 → July 2025
103MaryvilleBlount County+1.7%+54231,900 → 32,442April 2020 → July 2025
104JacksonMadison County+1.7%+1,13668,203 → 69,339April 2020 → July 2025
105ParisHenry County+1.6%+16210,306 → 10,468April 2020 → July 2025
106HarrogateClaiborne County+1.4%+634,391 → 4,454April 2020 → July 2025
107ColliervilleShelby County+1.4%+72651,183 → 51,909April 2020 → July 2025
108UnicoiUnicoi County+1.3%+483,813 → 3,861April 2020 → July 2025
109McMinnvilleWarren County+1.1%+15613,787 → 13,943April 2020 → July 2025
110JasperMarion County+0.8%+283,608 → 3,636April 2020 → July 2025
111HuntingdonCarroll County+0.6%+254,437 → 4,462April 2020 → July 2025
112SpartaWhite County+0.4%+225,016 → 5,038April 2020 → July 2025
113RogersvilleHawkins County+0.4%+194,671 → 4,690April 2020 → July 2025
114BrightonTipton County+0.4%+112,881 → 2,892April 2020 → July 2025
115CamdenBenton County+0.4%+143,676 → 3,690April 2020 → July 2025
116PulaskiGiles County+0.1%+68,388 → 8,394April 2020 → July 2025
117FayettevilleLincoln County−0.1%−57,073 → 7,068April 2020 → July 2025
118BrentwoodWilliamson County−0.1%−6445,377 → 45,313April 2020 → July 2025
119Signal MountainHamilton County−0.2%−228,846 → 8,824April 2020 → July 2025
120Estill SpringsFranklin County−0.3%−92,701 → 2,6922020 base revised by Census
121HumboldtGibson County−0.6%−467,887 → 7,841April 2020 → July 2025
122ErwinUnicoi County−1.0%−616,080 → 6,019April 2020 → July 2025
123CovingtonTipton County−1.0%−888,673 → 8,585April 2020 → July 2025
124East RidgeHamilton County−1.1%−25122,172 → 21,921April 2020 → July 2025
125ElizabethtonCarter County−1.2%−18114,531 → 14,350April 2020 → July 2025
126GoodlettsvilleDavidson County−1.5%−26917,775 → 17,506April 2020 → July 2025
127DyersburgDyer County−1.7%−26816,174 → 15,906April 2020 → July 2025
128Kingston SpringsCheatham County−2.2%−622,820 → 2,758April 2020 → July 2025
129WhitevilleHardeman County−2.2%−1034,585 → 4,4822020 base revised by Census
130TrentonGibson County−2.4%−1004,237 → 4,137April 2020 → July 2025
131BartlettShelby County−2.4%−1,37657,792 → 56,416April 2020 → July 2025
132DresdenWeakley County−2.6%−792,990 → 2,911April 2020 → July 2025
133BolivarHardeman County−3.0%−1565,199 → 5,043April 2020 → July 2025
134MemphisShelby County−3.0%−18,863628,510 → 609,647April 2020 → July 2025
135GermantownShelby County−3.2%−1,33341,334 → 40,001April 2020 → July 2025
136Union CityObion County−3.3%−36711,181 → 10,814April 2020 → July 2025
137La FolletteCampbell County−3.5%−2607,436 → 7,176April 2020 → July 2025
138NewbernDyer County−3.7%−1233,345 → 3,222April 2020 → July 2025
139RipleyLauderdale County−3.9%−3057,804 → 7,499April 2020 → July 2025
140South PittsburgMarion County−5.3%−1643,091 → 2,927April 2020 → July 2025
141BrownsvilleHaywood County−6.2%−6139,914 → 9,301April 2020 → July 2025
142Oak HillDavidson County−6.3%−3064,887 → 4,581April 2020 → July 2025
143Belle MeadeDavidson County−10.0%−2912,912 → 2,621April 2020 → July 2025
144Forest HillsDavidson County−11.2%−5645,037 → 4,473April 2020 → July 2025
145CliftonWayne County−11.7%−3122,656 → 2,344April 2020 → July 2025
146TiptonvilleLake County−16.2%−6463,979 → 3,333April 2020 → July 2025
Quick answers

Questions people ask

What is the fastest-growing town in Tennessee?

Lebanon (Wilson County): it grew 38.8%, from 38,495 residents in April 2020 to an estimated 53,412 in July 2025. White House (+37.3%) and Thompson's Station (+27.2%) follow.

How are these towns ranked?

By the percent change in residents from the Census Bureau’s April 2020 estimates base to its latest July 1 estimate, highest first, on the exact change: two towns shown with the same tenth of a percent keep the order of their unrounded figures, and only an identical change shares a rank (T). The base is the 2020 Census count redrawn on today’s town lines, so a town that annexed land since 2020 changes only by births, deaths and moves, not by the people it took in. How grades work.

Why isn’t my town on this list?

The list covers the towns TownRatings grades that had 2,500+ residents in the 2020 estimates base (146 in Tennessee). Census-designated places (unincorporated communities) have no Census Bureau estimates, so they never appear; a town incorporated since 2020, or one TownRatings merges with its twin township, isn’t listed either. Every town is on the Tennessee page.

Go deeper

More Tennessee lists

Every list ranks the same 2,500+ towns, so a town’s rank means the same thing on each.

All Tennessee rankings →
Other states

Fastest-growing towns in other states