263 years in pictures
Census counts: 385 in 1790, a low of 385 in 1790, 2,708 in 2020. The archive holds 5 old photos and papers going back to 1930 and 4 maps from 1928 on.
- 1763Thornton is settled
Each edition grades its towns against each other only.
For most people who can afford it, yes. Thornton grades B+ overall, ranked 51st of 125 in New Hampshire. It reports less crime per resident than 92% of U.S. towns. It is healthier than 87% of U.S. towns and its schools outperform 79% of the state's. The trade-off is money: the typical home is worth about $428K, 5.1 years of the Lebanon area’s $83K median household income. 48% of the land in Thornton is conserved, against 18% in New Hampshire’s towns and 4.3% across U.S. towns. On hazard risk, just 5 of New Hampshire’s 187 towns do worse. Most errands need a car: it is less walkable than 75% of U.S. towns.
Where Thornton beats most towns, and one thing worth knowing.
48.3% of the town is conserved land, across 3 parks and preserves.
Each subject compared with towns across the country (schools within New Hampshire), ordered by how far Thornton is from typical.
How TownRatings grades towns →
Census counts: 385 in 1790, a low of 385 in 1790, 2,708 in 2020. The archive holds 5 old photos and papers going back to 1930 and 4 maps from 1928 on.
Museums, parks, gardens and other places to visit around Thornton. Close and well known come first.
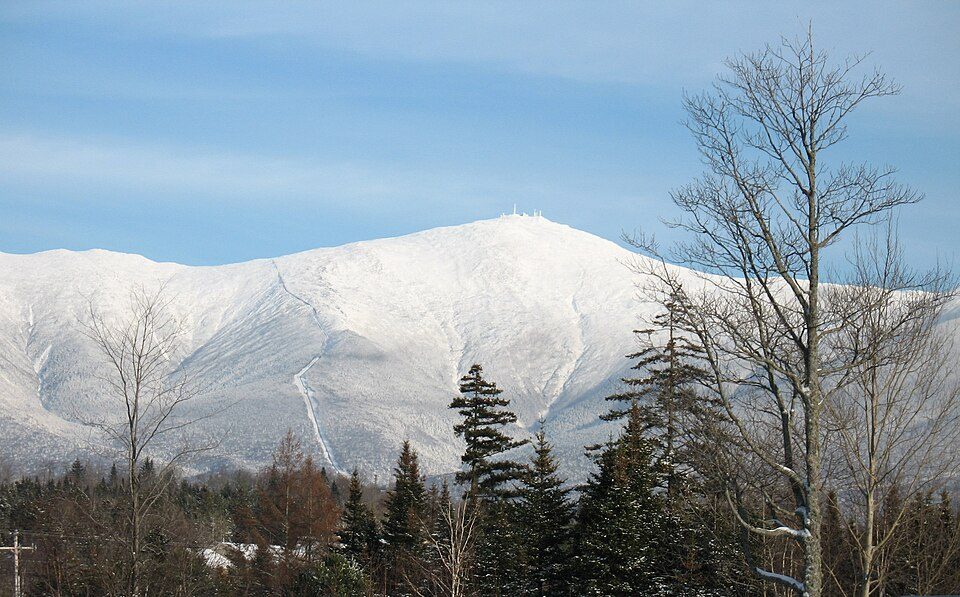
Big draw28 mi MountainMount Washington
29 mi LakeLake Winnipesaukee
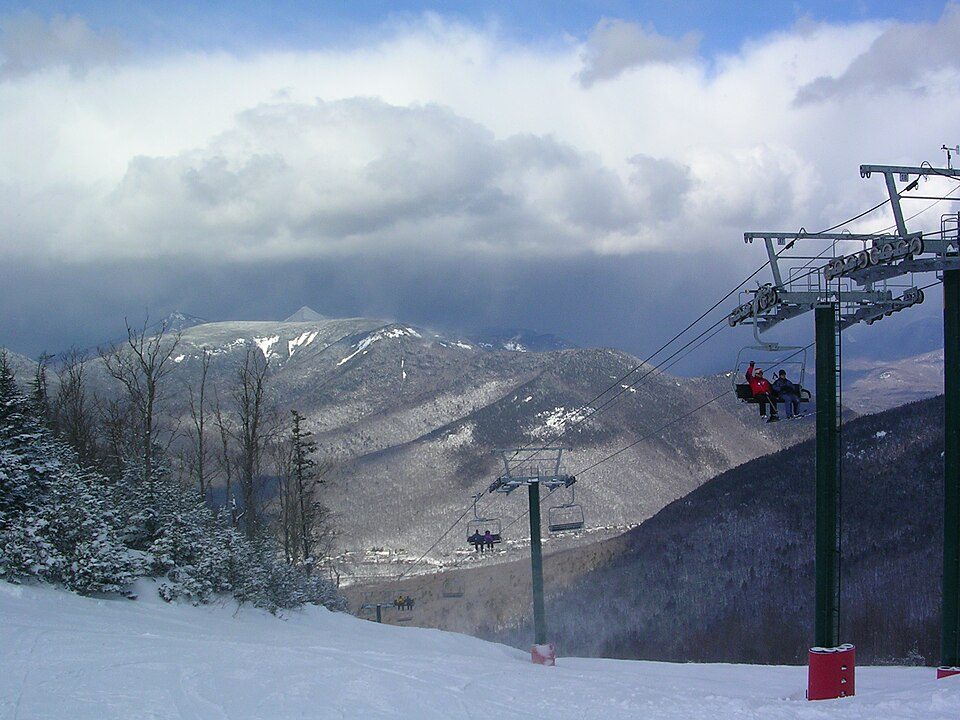
5 mi Ski areaWaterville Valley Resort84 runs · 1,990 ft vertical
16 mi National forestWhite Mountain National Forest
16 mi Ski areaCannon Mountain104 runs · 2,201 ft vertical
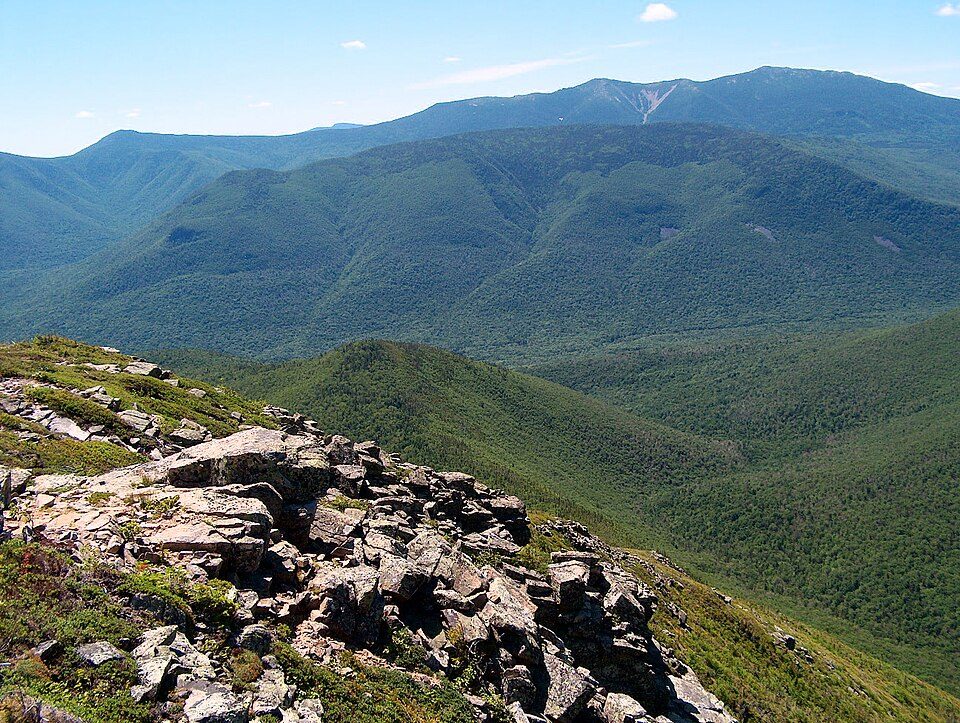
7 mi Ski areaLoon Mountain Resort80 runs · 2,189 ft verticalMount Washington: wwoods, CC BY-SA 3.0 · Lake Winnipesaukee: No machine-readable author provided. JohnJHenderson~commonswiki assumed (based o, Public domain · Waterville Valley Resort: MConradWard, CC BY-SA 4.0 · White Mountain National Forest: Ken Gallager at English Wikipedia, Public domain · Cannon Mountain: Mikespenard at English Wikipedia, CC BY-SA 3.0 · Loon Mountain Resort: Own work, Public domain
Who provides power, water and the rest in Thornton, and how to reach them.
EPA SDWIS (Oct 9, 2026) · HIFLD + EIA-861 2025 · Census 2020 ZCTAs · NCES 2024–25 · registration: vote.gov, updated Nov 19, 2024.
Ordered by what stands out in Thornton.
Thornton is a second-home town and is safe by national standards but not by New Hampshire’s; it also carries more natural-hazard risk than most of New Hampshire (mostly inland flooding).
Its 15,563 conserved acres are a larger share of the town than in 97% of New Hampshire towns.
65 miles of trail in 3 parks and preserves. Thornton’s trail density is 1.3 miles per square mile, where New Hampshire’s towns sit at 1.2 and U.S. towns at 0.4. The biggest park or preserve is Hubbard Brook Experimental Forest, at 88 acres.
| Biggest places to walk | Trails | Acres |
|---|---|---|
| 1. Hubbard Brook Experimental Forest | — | 88 |
| 2. Crawfords Memorial Field | — | 2 |
| 3. Pemigewasset Wildlife Management Area | — | 1 |
Trails & parks © OpenStreetMap contributors · Conserved land: USGS PAD-US
Its public schools are run by the Thornton School District. Its one school is below.
| School | Level | Students | Letter |
|---|---|---|---|
| Thornton Central SchoolLargest public elementary schoolGrades K–8 | Grades K–8 | 172 | A |
NCES · EDFacts · graded within NH on state tests and graduation
At 4.9 crimes per 1,000 residents a year, it reports less crime than 76% of New Hampshire’s graded towns.
Thornton’s property crime rate is 1 per 1,000 residents.
| Thornton | New Hampshire towns | U.S. towns | |
|---|---|---|---|
| Property crimes per 1,000 (2025) | 1 per 1,000 residents | 4.5 | 9.9 |
| Violent crimes per 1,000 (2025) | 0.7 per 1,000 residents | 0.7 | 1.6 |
FBI crime data, 2025 · crimes reported to police
Within New Hampshire it is healthier than 50% of the 126 graded towns: New Hampshire sets a high bar.
28% of Thornton adults have obesity. Thornton beats the New Hampshire average on 0 of 32 CDC measures and trails it on 2. 29% of Thornton adults feel lonely.
| Thornton | New Hampshire towns | U.S. towns | |
|---|---|---|---|
| Obesity (CDC PLACES) | 28% | 32% | 35% |
| Feel lonely (CDC PLACES) | 29% | 30% | 33% |
| Frequent mental distress (CDC PLACES) | 15% | 16% | 17% |
| Sleep under 7 hours (CDC PLACES) | 32% | 33% | 36% |
| What stands out | Thornton | NH |
|---|---|---|
| More adults with arthritis | 31.6% | 27.6% |
| More adults who have had cancer | 11% | 9.8% |
CDC PLACES 2025 · modeled estimates for adults · CMS · HRSA
FEMA rates its natural-hazard risk higher than 98% of New Hampshire towns, with expected losses of about $572 per resident a year; that rating is what its D for hazard risk is built on.
The FEMA risk score in Thornton is 86 of 100. Since 1979, 31 flood insurance claims have been paid out in Thornton.
FEMA flood insurance claims · FEMA National Risk Index · OpenFEMA
33.6% of homes are seasonal or vacation homes, against 10.1% statewide, which helps explain the older median age.
Adults 35 to 64 are 57% of residents (40% statewide); adults 18 to 34 are 10% of residents (21% statewide). 14% of residents are under 18 in Thornton. Thornton has grown 7% since 2020, to 2,895 residents in the Census Bureau’s 2025 estimate.
| Thornton | New Hampshire towns | U.S. towns | |
|---|---|---|---|
| Median age | 51.1 years | 44.6 years | 40.5 years |
| Under 18 | 14% | 18% | 22% |
| Bachelor’s degree or more, 25+ | 46% | 39% | 29% |
| Aged 65 or older | 19% | 20% | 18% |
47% women, 53% men
That’s an even split within the survey’s margin of ±4.3 points. Across New Hampshire, 50.1% of residents are women.
| Thornton | NH | U.S. | |
|---|---|---|---|
| Under 10 | 5.3% | 9.3% | 11.6% |
| 10 to 17 | 8.7% | 8.9% | 10.3% |
| 18 to 24 | 3.5% | 8.7% | 9.1% |
| 25 to 34 | 6.9% | 12.7% | 13.7% |
| 35 to 44 | 11.3% | 12.4% | 13.2% |
| 45 to 54 | 20.1% | 12.4% | 12.2% |
| 55 to 64 | 25.3% | 15.5% | 12.7% |
| 65 to 74 | 13.8% | 12.2% | 10.2% |
| 75 and older | 5.3% | 7.9% | 7% |
| No diploma | 0.8% | 5.6% | 10.4% |
| High school | 27.6% | 26.8% | 26% |
| Some college | 16% | 17.2% | 19.1% |
| Associate’s | 9.3% | 9.8% | 8.8% |
| Bachelor’s | 29% | 24.5% | 21.6% |
| Graduate | 17.3% | 16.1% | 14.1% |
Census population estimates, 2025 · U.S. Census Bureau · ACS 2020-2024 5-year estimates · in a town of 2,900, single groups can be off by several points
29.8% of workers work from home, against 16.8% across New Hampshire.
Most working residents leave Thornton for work: only 6% work in town. Since 2013, Thornton has added 72 jobs, to 357 in 2023. The top destinations are Plymouth (15%), Lincoln (13%) and Campton (9%).
| Thornton | New Hampshire towns | U.S. towns | |
|---|---|---|---|
| Average trip to work | 23 minutes | 28 minutes | 25 minutes |
| Working residents who work in town | 5.7% | 10% | 8% |
| Median household income | $90,000 | $103,000 | $80,000 |
| Below the poverty line | 9.2% | 6.7% | 9.6% |
Census LEHD 2023 · ACS
Thornton has cold, snowy winters and pleasant summers. July afternoons reach 80°, January nights drop to 8° and about 68 inches of snow falls in a winter.
NOAA U.S. Climate Normals, 1991–2020
Typical home values rose 4.5% in the year to September 2026.
| Thornton | New Hampshire towns | U.S. towns | |
|---|---|---|---|
| Households that own their home | 88% | 82% | 73% |
| Median rent | $1,270 a month | $1,393 a month | $1,185 a month |
Zillow Home Value Index · Redfin Data Center
1 within 15 miles of the center of Thornton
About 5 of every 100 Thornton residents are enrolled in college, about the same as New Hampshire.
Where Thornton’s working residents go each day. Line width shows the share.
Census LEHD 2023
5 notable people were born in Thornton.


Town in New Hampshire, United States
Thornton is a town in Grafton County, New Hampshire, United States. The population was 2,708 at the 2020 census, up from 2,490 at the 2010 census.
From Wikipedia, licensed CC BY-SA 4.0 · facts via Wikidata (CC0)
3 towns share a border with Thornton.
| Town | NH rank | Overall | Cost | Safety | Schools | Health |
|---|---|---|---|---|---|---|
| Thornton | #51 | B+ | C− | A | A− | A |
| Campton | #76 | B | C− | B+ | B+ | A |
| Woodstock | — | — | B− | — | B | A |
| Waterville Valley | — | — | — | — | — | — |
Woodstock has fewer than 2,500 residents, so it gets subject grades but no overall grade. Woodstock reports no FBI crime data of its own. Waterville Valley isn’t graded (fewer than 1,000 residents, or not enough data). Compare Thornton with a neighbor →
Short answers, built from the data on this page.
For most people who can afford it, yes. Thornton grades B+ overall, better than 71% of U.S. towns and #51 of 125 in New Hampshire. It grades A for health, A for safety and A− for schools. Hazard risk is its weak spot, with a D.
Yes. Cost of living, which also weighs rents, property taxes and how many households pay 30% or more of their income for housing, grades C−.
5 notable people were born here, including Orison Swett Marden and Jeremiah Rankin.