167 years in pictures
Census counts: 1,189 in 1860, 7,314 in 2020. The archive holds 13 old photos and papers going back to 1908 and 4 maps from 1919 on.
2 places on the National Register of Historic Places.
- 1859Belmont is settled
Each edition grades its towns against each other only.

Belmont is a solid, middle-of-the-road choice. It grades C overall, ranked 107th of 125 in New Hampshire, with no subject far below average. Its best mark is safety: crime is low: it reports less per resident than 63% of U.S. towns. Its lowest everyday mark is in schools: its schools rank behind 72% of the state's. A typical home there costs about $460K, 5 years of the Laconia area’s $93K median household income. On health, just 12 of New Hampshire’s 187 towns do worse. Its National Register listings include Belmont Public Library and Dudley Gilman Homestead. On civic life, just 10 of New Hampshire’s 187 towns do worse.
Where Belmont beats most towns.
Where Belmont’s working residents go each day. Line width shows the share.
Census LEHD 2023
Each subject compared with towns across the country (schools within New Hampshire), ordered by how far Belmont is from typical.
How TownRatings grades towns →
Census counts: 1,189 in 1860, 7,314 in 2020. The archive holds 13 old photos and papers going back to 1908 and 4 maps from 1919 on.
2 places on the National Register of Historic Places.
Who provides power, water and the rest in Belmont, and how to reach them.
EPA SDWIS (Oct 9, 2026) · HIFLD + EIA-861 2025 · Census 2020 ZCTAs · NCES 2024–25 · registration: vote.gov, updated Nov 19, 2024.
Ordered by what stands out in Belmont.
Belmont has a longer frost-free season than almost anywhere else in New Hampshire and is healthier than towns with similar incomes.
Most working residents leave Belmont for work: only 8% work in town. At $69,000, Belmont’s median household income is against $103,000 in New Hampshire’s towns and $80,000 across U.S. towns. 9.6% of Belmont workers work from home.
| Belmont | New Hampshire towns | U.S. towns | |
|---|---|---|---|
| Median household income | $69,000 | $103,000 | $80,000 |
| Work from home | 9.6% | 16% | 11% |
| Below the poverty line | 10% | 6.7% | 9.6% |
| Average trip to work | 25 minutes | 28 minutes | 25 minutes |
Census LEHD 2023 · ACS
Its public schools are run by the Shaker Regional School District. Two of its 3 schools are below, each with why it’s listed. The largest public high school is Belmont High School, with 361 students.
| School | Level | Students | Letter |
|---|---|---|---|
| Belmont Middle SchoolLargest public middle schoolGrades 5–8 | Grades 5–8 | 350 | C |
| Belmont High SchoolLargest public high schoolGrades 9–12 | Grades 9–12 | 361 | C+ |
NCES · EDFacts · graded within NH on state tests and graduation
Expected storm and flood damage is higher than in 70% of U.S. communities. Since 1984, 17 flood insurance claims have been paid out in Belmont.
FEMA flood insurance claims · FEMA National Risk Index · OpenFEMA
The Lakeport 2 weather station, 5 miles away, records that the frost-free season runs about 170 days, the #2 highest of 321 New Hampshire places with climate records.
Belmont has cold, snowy winters and pleasant summers. At 81°F, Belmont’s July high is close to New Hampshire’s towns (82°F) and below U.S. towns (85°F).
NOAA U.S. Climate Normals, 1991–2020
New Hampshire has less reported crime than most states, so among its own towns Belmont sits closer to the middle.
| Belmont | New Hampshire towns | U.S. towns | |
|---|---|---|---|
| Violent crimes per 1,000 (2025) | 1.7 per 1,000 residents | 0.7 | 1.6 |
| Property crimes per 1,000 (2025) | 9.8 per 1,000 residents | 4.4 | 9.9 |
FBI crime data, 2025 · crimes reported to police
The median rent in Belmont is $996 a month. The typical Belmont home is worth about $460,000, up 1.5% in a year, 10% below the New Hampshire typical home.
| Belmont | New Hampshire towns | U.S. towns | |
|---|---|---|---|
| Median rent | $996 a month | $1,393 a month | $1,185 a month |
| Households that own their home | 82% | 82% | 73% |
Census ACS, 2020–24 · Zillow Home Value Index · Redfin Data Center
9.6 miles of trail in 12 parks and preserves. Of the 126 New Hampshire towns we compare, none has a lower trail density than Belmont. The biggest park or preserve is Tioga River Wildlife and Conservation Area, at 208 acres.
| Belmont | New Hampshire towns | U.S. towns | |
|---|---|---|---|
| Miles of trail per square mile | 0.3 miles per square mile | 1.2 | 0.4 |
| Conserved land | 6.2% | 18% | 4.3% |
| Biggest places to walk | Trails | Acres |
|---|---|---|
| 1. Jeff Marden Town Forest | 1 mi | 64 |
| 2. Tioga River Wildlife and Conservation Area | — | 208 |
| 3. Andrew Sanborn Farm | — | 172 |
Trails & parks © OpenStreetMap contributors · Conserved land: USGS PAD-US
Against the 10,459 U.S. towns with household incomes like Belmont’s, it is healthier than 69%, so its B− isn’t only a matter of income. Within New Hampshire it is less healthy than 94% of the 126 graded towns: New Hampshire sets a high bar.
Belmont beats the New Hampshire average on 0 of 32 CDC measures and trails it on 17. 16% of adults smoke cigarettes in Belmont. Only 2 of the 126 New Hampshire towns we compare have a higher share of adults who sleep under 7 hours than Belmont.
| Belmont | New Hampshire towns | U.S. towns | |
|---|---|---|---|
| Smoke cigarettes (CDC PLACES) | 16% | 11% | 14% |
| Frequent physical distress (CDC PLACES) | 15% | 12% | 14% |
| Yearly checkup (CDC PLACES) | 76% | 78% | 79% |
| Depression (CDC PLACES) | 25% | 23% | 23% |
| What stands out | Belmont | NH |
|---|---|---|
| More older adults who have lost all their teeth | 17% | 8.9% |
| More smokers | 15.9% | 10.8% |
| More adults with COPD | 9% | 6.2% |
CDC PLACES 2025 · modeled estimates for adults · CMS · HRSA
Museums, parks, gardens and other places to visit around Belmont. Close and well known come first.
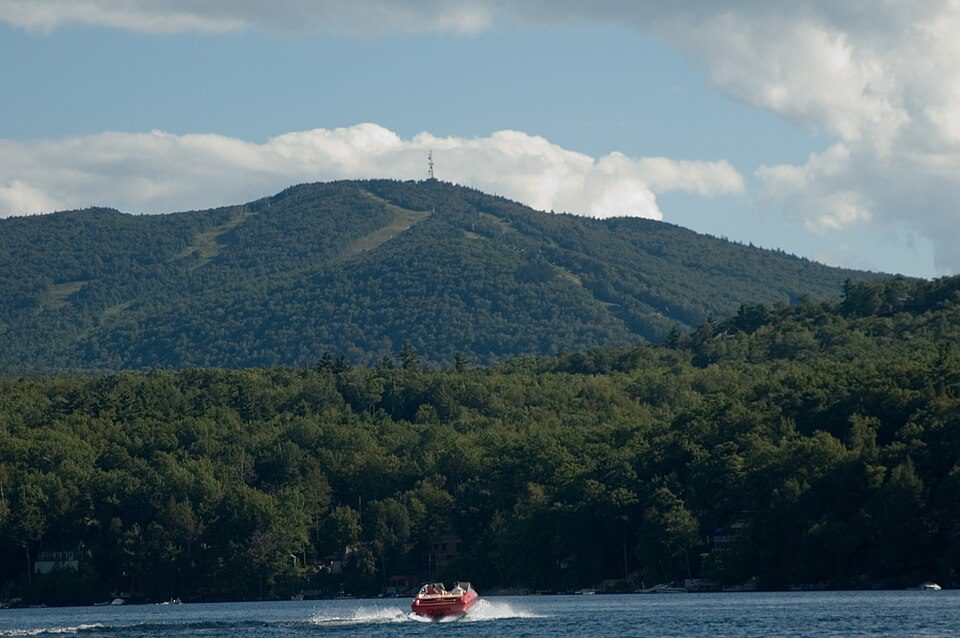
12 mi LakeLake Winnipesaukee
8 mi MuseumCanterbury Shaker Village7 mi Ski areaGunstock Recreation Area73 runs · 1,305 ft vertical
34 mi Ski areaWaterville Valley Resort84 runs · 1,990 ft vertical
34 mi Stadium & arenaSNHU Arena
31 mi Ski areaMount Sunapee77 runs · 1,469 ft verticalLake Winnipesaukee: No machine-readable author provided. JohnJHenderson~commonswiki assumed (based o, Public domain · Canterbury Shaker Village: SayCheeeeeese, Public domain · Waterville Valley Resort: MConradWard, CC BY-SA 4.0 · SNHU Arena: Quintin Soloviev, CC BY 4.0 · Mount Sunapee: User:Josephbrophy, Public domain
1 within 15 miles of the center of Belmont
About 3 of every 100 Belmont residents are enrolled in college, against 6 across New Hampshire.
Town in New Hampshire, United States
Belmont is a town in Belknap County, New Hampshire, United States. The population was 7,314 at the 2020 census, and an estimated 7,408 in 2025, slightly up from the 2020 census. The primary settlement in town, where 1,285 people resided at the 2020 census, is defined by the U.S. Census Bureau as the Belmont census-designated place (CDP) and includes the densely populated portion of the town near the intersection of New Hampshire routes 106 and 140.
From Wikipedia, licensed CC BY-SA 4.0 · facts via Wikidata (CC0)
6 towns share a border with Belmont.
| Town | NH rank | Overall | Cost | Safety | Schools | Health |
|---|---|---|---|---|---|---|
| Belmont | #107 | C | C+ | B | C | B− |
| Tilton | #104 | C | B | D | C | B+ |
| Sanbornton | #73 | B | C | A | C | A |
| Laconia | #121 | D | C | C− | D | B+ |
| Gilford | #41 | A− | C+ | B+ | B+ | A |
| Gilmanton | #22 | A | B− | A | A− | A |
| Northfield | #86 | B− | B | B+ | C | B+ |
Short answers, built from the data on this page.
Belmont grades C overall, better than 31% of U.S. towns and #107 of 125 in New Hampshire. It grades B− for health, B for safety and C for schools. Hazard risk is its weak spot, with a C−.
Yes, by national standards. New Hampshire has less crime than most states, so among its own towns Belmont sits nearer the middle.
Cost of living, which also weighs rents, property taxes and how many households pay 30% or more of their income for housing, grades C+.