Guest, Sign inJoin

Post to New London

We’ll email a one-tap link to publish your post. No password, and nothing is public until you click it.
Already a member? Sign in
New London NH 11-16-25b
New Hampshire›Merrimack County

New LondonNH

A town of 4,411, settled in 1779.

5 bordering townsMap →
Photo: Ascended Dreamer · CC BY-SA 4.0
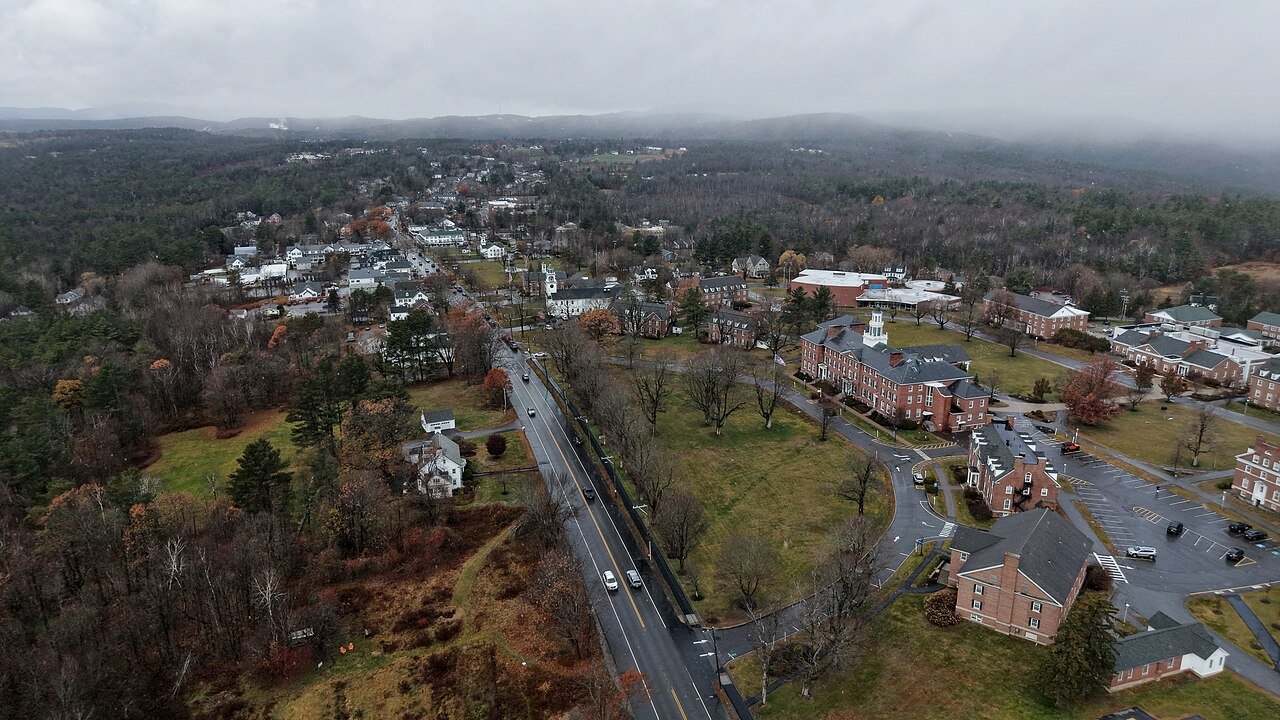
Photo of New London

New London, NH · Photo: Ascended Dreamer · CC BY-SA 4.0 · Source ↗

Is New London a good place to live?

A good place to live, if you can afford it. Health is its strong suit: residents are healthier than 98% of U.S. towns on CDC estimates. New London’s overall grade of A− puts it better than 85% of U.S. towns, 29th of 125 in New Hampshire. Safety is a strength too: it reports less crime per resident than 78% of U.S. towns. What holds it back is cost of living (D): the typical home is worth about $697K, 7.2 years of the Concord area’s $97K median household income. The town is home to Colby-Sawyer College. 38% of residents are 65 or older locally, above both New Hampshire’s towns (20%) and U.S. towns (18%). Only 5 of New Hampshire’s 187 towns score higher on hazard risk.

Figures: health, CDC PLACES · FBI crime data, 2025 · home values, Zillow · incomes, Census ACS, 2020–24 · FEMA National Risk Index.

What makes New London stand out

Where New London beats most towns.

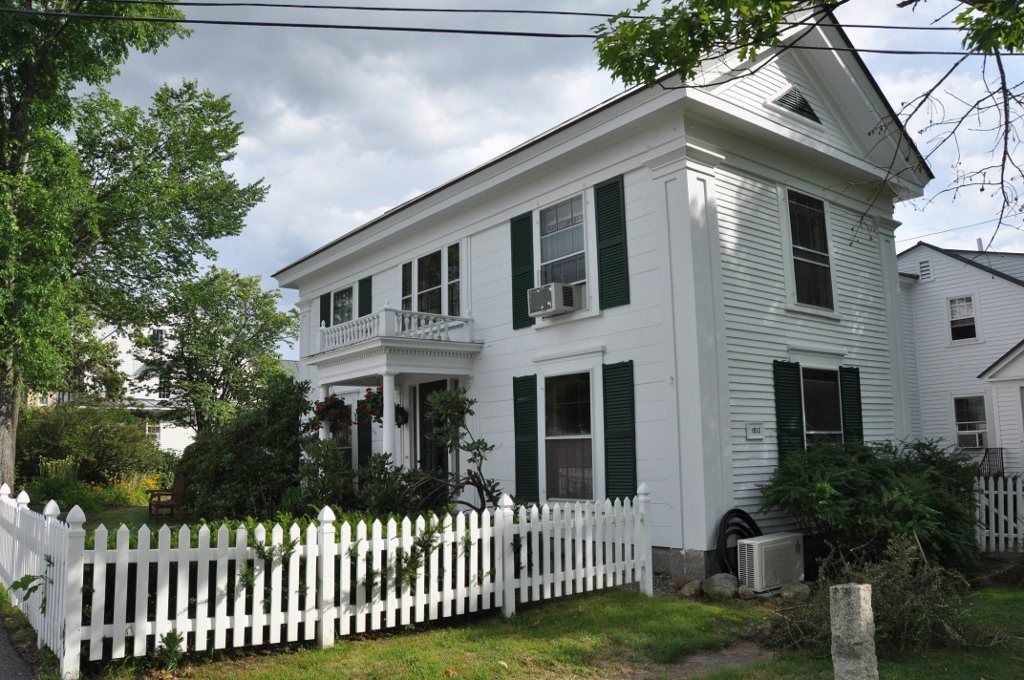
Dr. Solomon M. Whipple House
Dr. Solomon M. Whipple House · National Register of Historic Places
New London’s story

247 years in pictures

Census counts: 311 in 1790, a low of 311 in 1790, 4,400 in 2020. The archive holds 13 old photos and papers going back to 2010 and 5 maps from 1928 on.

2 places on the National Register of Historic Places.

  • 1779New London is settled
Explore the history →

How New London grades

Each subject compared with towns across the country (schools within New Hampshire), ordered by how far New London is from typical.

How grading works

Character Graded, but not part of the overall grade.
Described, not graded Taste, not quality: snow or an older crowd is neither good nor bad.

How TownRatings grades towns →

Getting set up

Moving to New London: who provides what

Who provides power, water and the rest in New London, and how to reach them.

The full setup list →
PowerEversource24.2¢/kWh · EIA 2025HIFLD · EIA
WaterNew London Springfield WaterNo health-based violations in 5 years · EPAEPA
Internet4 providers100% of addresses get 100/20 MbpsFCC
Trash & dumpNot on file yetWe don’t have New London’s trash rules yet
SchoolsKearsarge Region School DistrictWhich school depends on your addressNCES
Register to voteIn personNew Hampshire has no online registration; you can register in person up to and including Election Day or by mail only in special circumstances (received 13 days before).vote.gov
Who runs elections hereTown Clerk of New LondonThe town itself; contacts on the Handbook page.FVAP, Sep 2025
ZIP codes03257, 0323303257 97% · 03233 3%Census 2020

EPA SDWIS (Oct 9, 2026) · HIFLD + EIA-861 2025 · Census 2020 ZCTAs · NCES 2024–25 · registration: vote.gov, updated Nov 19, 2024.

The data

Ordered by what stands out in New London.

New London is among the three healthiest towns in New Hampshire, carries less natural-hazard risk than nearly all of New Hampshire (mostly inland flooding) and is shaped by its college students.

HealthA+

A smaller share of adults smoke cigarettes in New London than in most of New Hampshire or the rest of the country

It ranks #3 of the 126 New Hampshire towns we grade on the CDC estimates behind the Health Grade. Its widest gap with New Hampshire is tooth loss: 4.7% of those 65+ have lost all their teeth, against 8.9% statewide.

The share of adults in New London who had a checkup this year: 83%. Only one of the 126 New Hampshire towns we compare has a lower share of adults who binge drink than New London. Also worth knowing: on the CDC’s 32 measures, New London is ahead of New Hampshire on 18 and behind on 1. Two figures for adults here: 28% sleep under 7 hours, 13% report frequent mental distress.

98%healthier than U.S. townsA+Health Grade
New LondonNew Hampshire townsU.S. towns
Smoke cigarettes (CDC PLACES)5.9%11%14%
Sleep under 7 hours (CDC PLACES)28%33%36%
Frequent mental distress (CDC PLACES)13%16%17%
Frequent physical distress (CDC PLACES)9.9%12%14%
32 measures vs. New Hampshire
18 better13 too close to call1 worse
What stands outNew LondonNH
Fewer older adults who have lost all their teeth4.7%8.9%
Fewer adults facing food insecurity5.1%9.5%
More adults who have had cancer12.7%9.8%
New London Hospital
0.6 mi away · emergency room
None
primary care, dental or mental-health shortage
98th
percentile among NH towns

CDC PLACES 2025 · modeled estimates for adults · CMS · HRSA

SchoolsB

Public schools in New London beat 64% of New Hampshire districts

Its public schools are run by the Kearsarge Regional School District. One of its 2 schools is below, with the reason it’s listed. 2 public schools serve New London, with 352 students in all.

64%of NH districts it outscoresBSchool Grade
SchoolLevelStudentsLetter
Kearsarge Reg. Elem. School at New LondonLargest public elementary schoolGrades K–5Grades K–5330A

NCES · EDFacts · graded within NH on state tests and graduation

Work & commuteJobs & income grade B+

New London stands out in New Hampshire and nationally: a smaller share of its residents live below the poverty line

2,342 jobs are based in New London, 1.8 for every working resident, so most of the people who work here commute in.

22% of working residents work locally in New London. The median commute is under 26 miles. Its typical household income comes in at $108,000. The top destinations are Concord (8%), Nashua (4%) and Manchester (4%).

22%work in town
New LondonNew Hampshire townsU.S. towns
Working residents who work in town22%9.8%8%
Below the poverty line0.9%6.8%9.6%
Median household income$108,000$103,000$80,000
Average trip to work25 minutes28 minutes25 minutes

Where working residents work

In New London22%
Concord8%
Nashua4%
Manchester4%
Lebanon3%
26 mi
median commute distance
2,342
jobs based in New London
A job hub
jobs vs. working residents
A−
Walkability grade: more walkable than 84% of U.S. towns

Census LEHD 2023 · ACS

OutdoorsA

Conservation land takes up 18.7% of New London

The trail density in New London is 1.4 miles per square mile. Trails total 35 miles in 23 parks and preserves. Webb Forest, at 1,023 acres with 7.2 miles of trail, is the biggest park or preserve.

#45for trails in NH
18.7%
conserved · 3,028 of 16,166 acres
35 mi
of trails · 1.4 per sq mi
Biggest places to walkTrailsAcres
1. Webb Forest7.2 mi1,023
2. Messer Farm2.8 mi152
3. Clark Pond Natural Area1.5 mi89

Trails & parks © OpenStreetMap contributors · Conserved land: USGS PAD-US

SafetyA−

New London earns an A− for safety

Reported crimes fell from 67 to 10 over the last three FBI years, a drop beyond ordinary year-to-year swings. Violent crime is rare: 2 reported in 2025, 0.4 per 1,000 residents.

New Hampshire has less reported crime than most states, so among its own towns New London sits closer to the middle. Its level of property crime comes in at 1.8 per 1,000 residents.

78%of U.S. towns report more crimeA−Safety Grade
New LondonNew Hampshire townsU.S. towns
Property crimes per 1,000 (2025)1.8 per 1,000 residents4.59.9
Violent crimes per 1,000 (2025)0.4 per 1,000 residents0.71.6

Violent crime per 1,000 residents

New London0.4
New Hampshire1.2
U.S.3.3

Property crime per 1,000 residents

New London1.8
New Hampshire8.3
U.S.15.5
78th
percentile among U.S. towns we grade
46th
percentile among NH towns
2
violent crimes reported in 2025
8
property crimes reported in 2025

FBI crime data, 2025 · crimes reported to police

Natural hazardsHazard risk grade A−

The biggest natural risk in New London is inland flooding, at a very low overall level

FEMA rates its natural-hazard risk lower than 96% of New Hampshire towns, with expected losses of about $248 per resident a year; that rating is what its A− for hazard risk is built on.

Federal disaster aid has reached households in New London after 8 declared disasters, most recently in 2017. For New London, the risk rating from FEMA is 18 of 100. Of the losses FEMA expects locally, 64% come from inland flooding and 10% from hurricanes. Paid flood insurance claims here since 2007: one.

18risk score of 100
FEMA risk score
18Very low riskLowerHigher
Inland floodingHurricanes
1
paid flood claims since 2007
8
federal disasters paid out here

FEMA disaster declarations and aid · FEMA National Risk Index · OpenFEMA

HousingCost of living grade D

New London earns a D for cost of living

At 7.2 years of the Concord area’s $97K median household income, the typical home (about $697K) costs more against local pay than in 91% of New Hampshire towns; that ratio is one input to that grade.

For New London, the median rent is $1,594 a month. A typical home here is worth about $697,000, up 2.1% in a year, 37% above the New Hampshire typical home. 91% of New London households are owner-occupiers.

$697KZillow home value
New LondonNew Hampshire townsU.S. towns
Households that own their home91%82%73%
Median rent$1,594 a month$1,382 a month$1,185 a month

Typical home value

New London$697K
New Hampshire$511K
+2.1%
value change, 1 year
0
homes sold in September

Census ACS, 2020–24 · Zillow Home Value Index · Redfin Data Center

Climate

New London: snowy winters and pleasant summers

Among 126 New Hampshire towns, just 2 have a lower typical July afternoon high than New London. July afternoons reach 79°, January nights drop to 10° and about 66 inches of snow falls in a winter.

66″snow a winter

Typical low → high °F

Winter13–31°
Spring31–53°
Summer53–77°
Fall36–57°
Oct 1
typical first frost
May 14
typical last frost
+1.7°
vs. the 20th-century average

NOAA U.S. Climate Normals, 1991–2020

Nearby attractions

Lake Winnipesaukee and 28 more within 40 miles

Museums, parks, gardens and other places to visit around New London. Close and well known come first.

All 62 attractions →
Sources: National Park Service · ski areas © OpenSkiMap / OpenStreetMap contributors · Wikidata · Wikipedia readership · photos via Wikimedia Commons
Photo credits

Lake Winnipesaukee: No machine-readable author provided. JohnJHenderson~commonswiki assumed (based o, Public domain · Mount Monadnock: Jonwmcinenrey, CC BY-SA 4.0 · Mount Sunapee: User:Josephbrophy, Public domain · Okemo Mountain: Jrclark (talk), CC BY-SA 3.0 · Saint-Gaudens National Historical Park: Ser Amantio di Nicolao, CC BY-SA 3.0 · Ragged Mountain Resort: Tom Morgan, Public domain

Keep exploring

Everything we know about New London

20pages on New London
After high school

Colleges nearby

1 within 15 miles of the center of New London

College town 21 of every 100 New London residents are enrolled in college, against 6 across New Hampshire.

Prices by family income, graduation and earnings →

A job hub

Every workday, about 2,051 people come to New London for work

Where New London’s working residents go each day. Line width shows the share.

8% → Concord Concord 8% 4% → Nashua Nashua 4% 4% → Manchester Manchester 4% 3% → Lebanon Lebanon 3% 3% → Portsmouth Portsmouth 3% 3% → Newbury Newbury 3% New London · 22% stay
2,342jobs based in New London
22%of working residents work in town
26 mimedian commute distance

Census LEHD 2023

Landmarks

2 places in New London on the National Register of Historic Places.

All landmarks →

Famous people from New London

8 notable people were born in New London.

See all 8 →

About New London

Town in New Hampshire, United States

Official town website ↗

New London is a town in Merrimack County, New Hampshire, United States. The population was 4,400 at the 2020 census. The town is the home of Colby–Sawyer College, site of the Gordon Research Conferences since 1947. The town center, where 1,266 people resided at the 2020 census, is defined as the New London census-designated place (CDP), and is located on a hilltop along New Hampshire Route 114 north of Route 11 and Interstate 89.

From Wikipedia, licensed CC BY-SA 4.0 · facts via Wikidata (CC0)

Established
1779
Area
26 sq mi
Elevation
1,293 ft
ZIP code
03257
Area code
603

New London’s neighbors

5 towns share a border with New London.

Explore the map →
How the neighbors grade
TownNH rankOverallCostSafetySchoolsHealth
New London#29A−DA−BA+
Sunapee#64B+C−A−A−B+
Wilmot——CA+BB+
Sutton——CA+BA
Newbury——CA−BA
Springfield——CABA

Wilmot, Sutton, Newbury and Springfield have fewer than 2,500 residents, so they get subject grades but no overall grade. Compare New London with a neighbor →

Questions about New London

Short answers, built from the data on this page.

Is New London, NH a good place to live?

For most people who can afford it, yes. New London grades A− overall, better than 85% of U.S. towns and #29 of 125 in New Hampshire. It grades A+ for health, A− for safety and B for schools. Cost of living is its weak spot, with a D.

Is New London, NH safe?

Yes, by national standards. New Hampshire has less crime than most states, so among its own towns New London sits nearer the middle.

Is New London, NH expensive?

Yes. Cost of living, which also weighs rents, property taxes and how many households pay 30% or more of their income for housing, grades D.

What is New London, NH known for?

8 notable people were born here, including Nicholas Fairall and Anthony Colby.