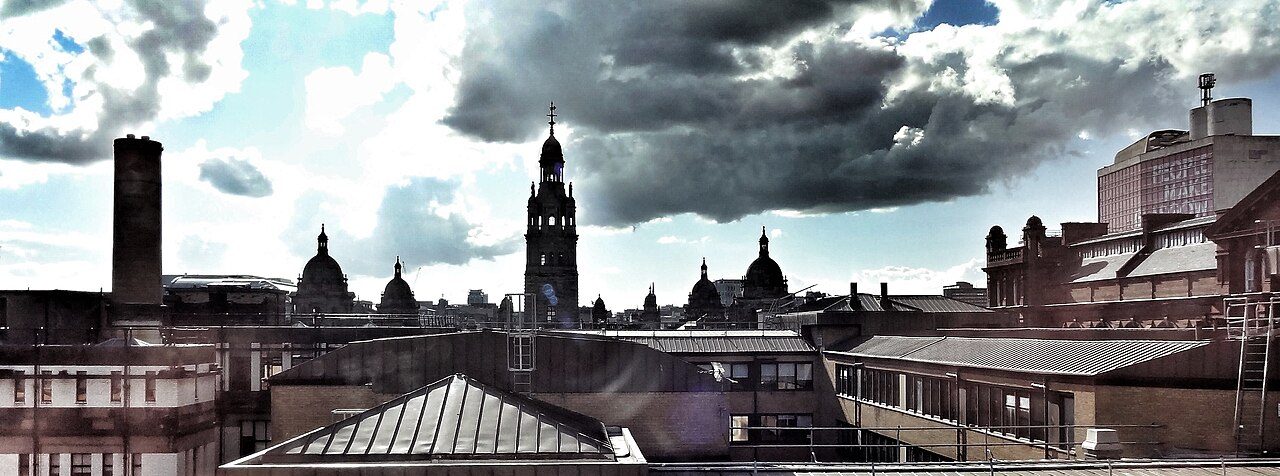
 Photo: Ian Hawfinch · CC BY-SA 2.0
How Glasgow City stacks up
Only two areas have more people walking, cycling or riding to work: in Glasgow City, 40% of commuters walk, cycle or take the bus or train. Alongside little flood risk, it has health that trails most areas. It has no overall grade yet: Police Scotland publishes no street-level crime we can reuse, so there is no Safety grade to weigh.
Each subject puts the official figure for the whole council area beside a measure built from our town grades. How this works
Safety
Not gradedNot graded yet: no street-level crime for Scotland. Police Scotland publishes no street-level crime that we can reuse, so Scottish council areas, like Scottish towns, have no Safety grade yet, and without one no overall grade. The Scottish Index of Multiple Deprivation, due at the end of 2026, should bring newer crime figures by small area; we plan to grade Scottish safety on them.
Schools
73rd of 90C−19/100 Weaker results than most. Among Scotland’s council areas it ranks 8th lowest for school leavers’ results: 63% leave with five or more National 5 awards or better. East Dunbartonshire, North Lanarkshire and South Lanarkshire all do better on schools.
Source: Scottish Government school leaver attainment, 2022/23 to 2024/25: leavers with five or more awards at SCQF level 5 (National 5) or better, every state secondary in the council area. Ranked among Scotland’s council areas.
Glasgow City has one graded town of 2,500 or more with this measure, too few to compare town by town (we need 5); its grade rests on the official figure.
Cost of living
44th of 98B56/100 Somewhat affordable. Homes cost 4.7 times what the average household takes in a year: a typical sale of £191,300 against income of £41,100. Typical prices are up 22% on five years ago.
Typical sale price: £191,300 (11,122 sales, 30th lowest).
Private rent £1,266 a month (17th highest); Band D council tax £1,706 (23rd lowest), before water and sewerage charges. Shown for context.
Source: Registers of Scotland sales September 2025 to August 2026 (median estimated from monthly figures); household income estimated from ONS household income (GDHI) per head and household size; private rents for the wider Scottish broad rental area; council Band D 2026/27.
Glasgow City has one graded town of 2,500 or more with this measure, too few to compare town by town (we need 5); its grade rests on the official figure.
Health
79th of 98C−20/100 Less healthy than most areas. Glasgow City ranks 8th shortest for healthy life expectancy, at 55.9 years.
Life expectancy at birth: 76.5 years, the shortest.
Source: National Records of Scotland healthy life expectancy and life expectancy by council area, 2022 to 2024, men and women averaged. A survey-based figure, so ranked among Scotland’s council areas only.
Glasgow City has one graded town of 2,500 or more with this measure, too few to compare town by town (we need 5); its grade rests on the official figure.
Jobs & income
98th of 98D−0/100 Jobs and pay are the weak spot. East Dunbartonshire, North Lanarkshire and South Lanarkshire all do better on incomes. Glasgow City ranks 4th lowest for household income, at £41,100 a year before tax.
Out-of-work claimants in August 2026: 4.9% of working-age adults (5th highest), weighed with income in the grade.
Source: Household income estimated from ONS household income (GDHI) per head, 2022, and household size (Scotland has no small-area income figures); DWP claimant count (August 2026) by council.
Glasgow City has no graded towns of 2,500 or more with this measure, too few to compare town by town (we need 5); its grade rests on the official figure.
Getting about
3rd of 98A+98/100 Car-optional living. 40% of commuters walk, cycle or take the bus or train to work, against 25% across Scotland (3rd highest of 98 areas). Among its neighbours it does best on walkability, with Renfrewshire second.
Worked mainly from home at the 2022 Census: 33% of workers (context; they are left out of the commuting share).
Source: Scotland’s Census 2022, method of travel to work by council area; people working mainly from home left out.
Glasgow City has one graded town of 2,500 or more with this measure, too few to compare town by town (we need 5); its grade rests on the official figure.
Flood risk
19th of 87A−79/100 Fairly sheltered from flooding. Glasgow City ranks 9th lowest of 32 Scottish council areas for flood risk: 1.4% of town homes are in harm’s way.
Source: SEPA flood maps (rivers and the sea, high and medium likelihood), homes in every town of the council area. SEPA’s bands differ from England’s, so ranked among Scotland’s council areas.
Glasgow City has one graded town of 2,500 or more with this measure, too few to compare town by town (we need 5); its grade rests on the official figure.
Growth
29th of 98B+71/100 Growing faster than most. NRS estimates put 650,320 people here in 2024, +9.7% on 2011 (32nd fastest). Among its neighbours it does best on growth, with East Renfrewshire second.
Since the 2021 Census: +6.5%, the fastest.
Source: National Records of Scotland mid-year population estimates, 2011 and 2024.
Glasgow City has no graded towns of 2,500 or more with this measure, too few to compare town by town (we need 5); its grade rests on the official figure.
How Glasgow City compares to its neighbours
Glasgow City beats every neighbour on getting about and growth; on schools and jobs and income, every neighbour beats it.
| Glasgow City | East Dunbartonshire | North Lanarkshire | South Lanarkshire | East Renfrewshire | |
|---|---|---|---|---|---|
| Overall | No overall grade | No overall grade | No overall grade | No overall grade | No overall grade |
| Safety | Not graded | Not graded | Not graded | Not graded | Not graded |
| Schools | C− 1925th official | A 942nd official · 72% in top towns | B− 4617th official · 5% in top towns | A− 799th official · 30% in top towns | A+ 991st official · 81% in top towns |
| Cost of living | B 5645th official | B− 4958th official · 72% in top towns | A 886th official · 99% in top towns | A− 7926th official · 100% in top towns | B− 4865th official · 82% in top towns |
| Health | C− 2025th official | A 926th official · 71% in top towns | D− 132nd official · 0% in top towns | C 3022nd official · 6% in top towns | A+ 953rd official · 67% in top towns |
| Jobs & income | D− 095th official | A+ 9617th official | C 2877th official | B 5558th official | A+ 9712th official |
| Getting about | A+ 983rd official | C+ 4445th official · 0% in top towns | C 2569th official · 0% in top towns | C 2863rd official · 0% in top towns | C 3458th official · 0% in top towns |
| Flood risk | A− 799th official | B+ 6516th official · 27% in top towns | A+ 973rd official · 81% in top towns | A− 846th official · 51% in top towns | B+ 6711th official · 23% in top towns |
| Growth | B+ 7132nd official | C+ 3863rd official | C− 2082nd official | B− 5255th official | B+ 6835th official |
Each cell: the subject’s grade and score, the county’s rank on the official figure (1st = the better end), and the share of its town residents living in a top-quarter town for the UK. Neighbour names open their report cards.
How this report card works
Two measures, side by side. The left card is an official figure for the whole county, its towns, villages and countryside together, built from the small areas and councils that make it up and ranked against the other counties. The right card is built from our town grades: of everyone living in the county’s graded towns of 2,500 or more, the share whose town is in the top quarter for the UK. Quarters are of people, not towns: the top quarter is the best-placed towns that together hold a quarter of everyone living in graded towns, so a county of big cities is not marked down just for being urban. A county can do well on one measure and not the other; that difference is often the story.
Scores and grades. Each subject’s score (0–100) is the area’s standing in one UK league of 98: the ceremonial counties of England (London counts as one), Wales’s eight preserved counties, and Scotland’s 32 and Northern Ireland’s 11 council areas, each called by its own name. The two measures’ percentiles are averaged, then ranked again, the same method as our town grades. Where a nation publishes its own kind of figure, the official figure is ranked within that nation: school results everywhere, health in Scotland and Northern Ireland, and flood risk in Scotland. Each area’s figures are set beside its own nation’s. 100 is the best county, 0 the last. Letters use the town-grade scale (A+ from 95, A from 85, A− from 75 … D below 15). The overall score weighs safety 18, cost of living 18, schools 16, health 14, jobs & income 12, getting about 8, growth 8, flood risk 6 (out of 100), over the subjects a county has. Counties with fewer than 5 graded towns (Rutland, Bristol) are graded on the official figures alone.
What it is not. A county figure averages everyone, so it cannot show whether a county is evenly good or a mix of very good and struggling places. The town measure shows the mix but leaves out villages and towns under 2,500. Neither says anything about any one street.
Gaps. Wales publishes no school results that compare with England’s, so Welsh counties have no Schools grade. Greater Manchester Police publishes no street-level crime, so Greater Manchester has no Safety grade and, as for its towns, no overall grade. Nor does Police Scotland, so Scotland’s council areas have no Safety grade or overall grade yet. Scotland and Northern Ireland have no small-area income figures, so their household income is estimated from ONS household income per head. Flood risk has no county-wide official figure; it is the share of homes in the county’s towns at high or medium risk. Sources are named under each figure. How grades work
Sources: TownRatings grades: our own summary of the data, ranked against UK towns only. All under the Open Government Licence v3.0.
Contains public sector information licensed under the Open Government Licence v3.0. Contains HM Land Registry data © Crown copyright and database right 2026. Contains OS data © Crown copyright and database right 2026 (ONS boundaries). Northern Ireland: Source: NISRA; contains Land & Property Services data and Ordnance Survey of Northern Ireland information, © Crown copyright, licensed under the Open Government Licence v3.0. Scotland: contains National Records of Scotland data, Registers of Scotland data and SEPA data, © Crown copyright / © SEPA 2025, licensed under the Open Government Licence v3.0.