Guest, Sign inJoin
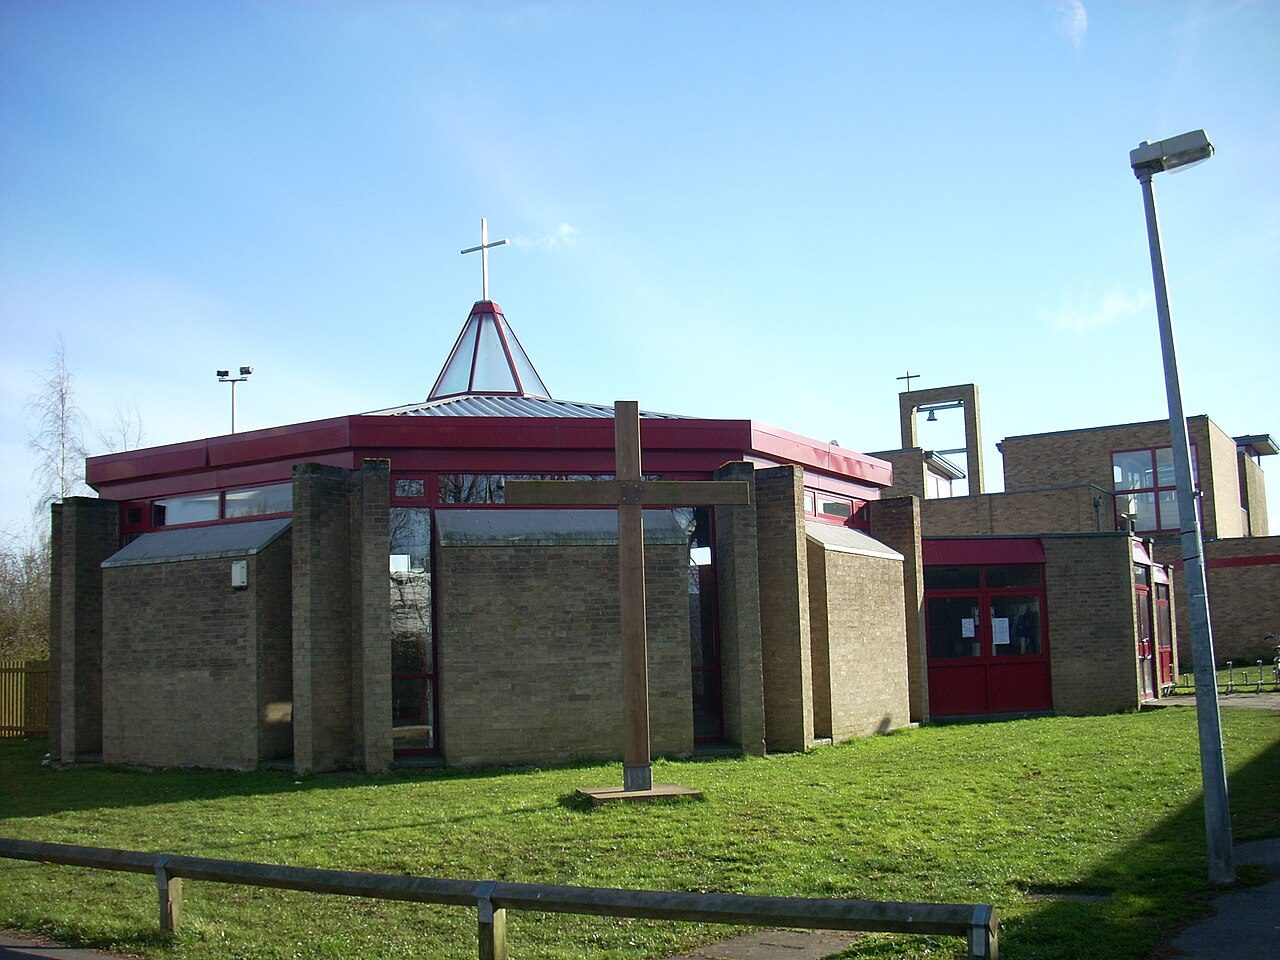
Bar Hill churchBar Hill, #1 on this list · Photo: Cruccone · CC BY 3.0
United Kingdom · 2026

Best places to live in the UK

Bar Hill, Cambridgeshire, ranks first of 2,138 towns and cities of 2,500+ residents in England, Wales and Northern Ireland. All 100 here grade A+, the top 5% of UK towns; their scores run from 87.4 down to 71.2. Hampshire has the most of them (14), and 30 counties and council areas have at least one.

The overall score, sorted high to low; the letter and the area rank sit beside it. How grades work

#1

Bar Hill

Cambridgeshire · 3,899 people
A+

Score 87.4·#1 of 50 in Cambridgeshire

Strongest: health A+, jobs & income A+·lowest: hazard risk B+
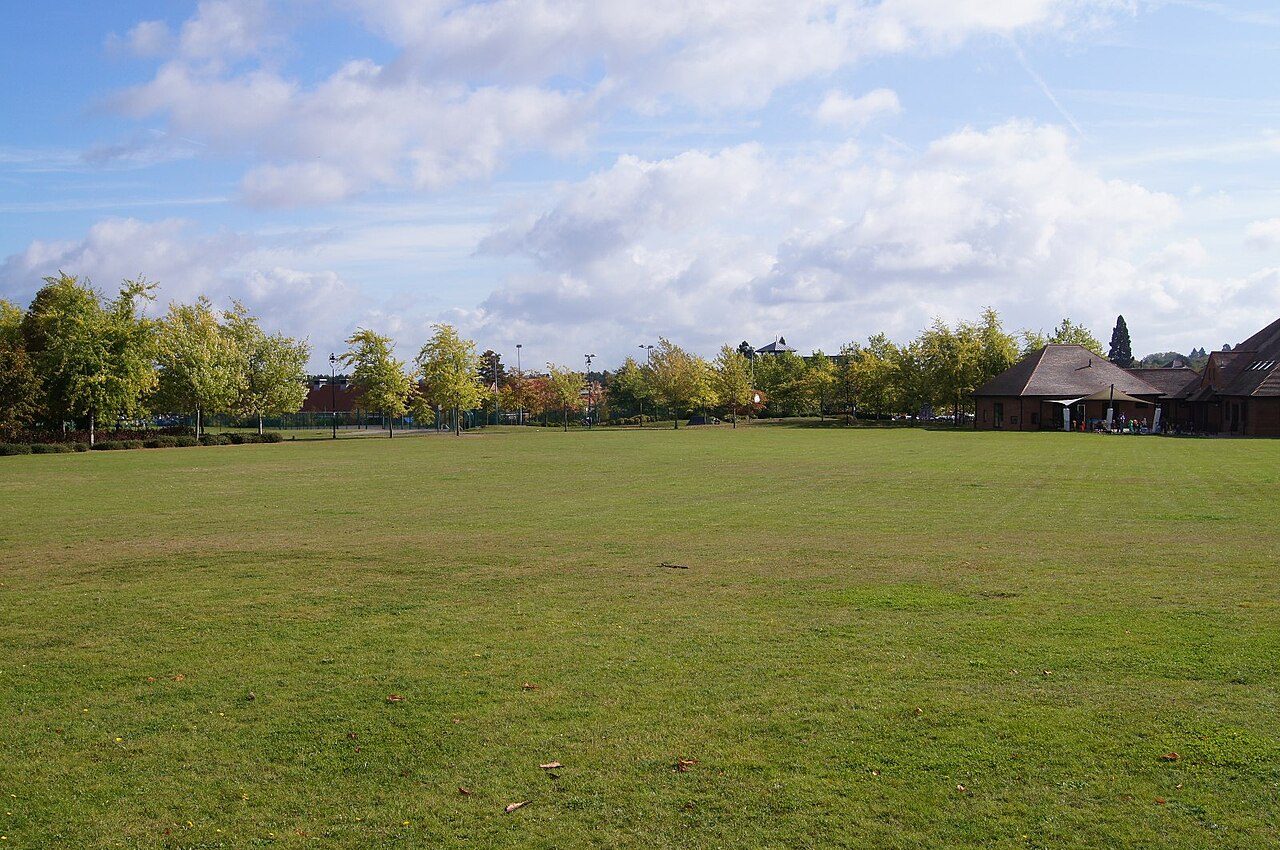
#2

Elvetham Heath

Hampshire · 4,916 people
A+

Score 81.8·#1 of 76 in Hampshire

Strongest: health A+, jobs & income A+·lowest: walkability C+
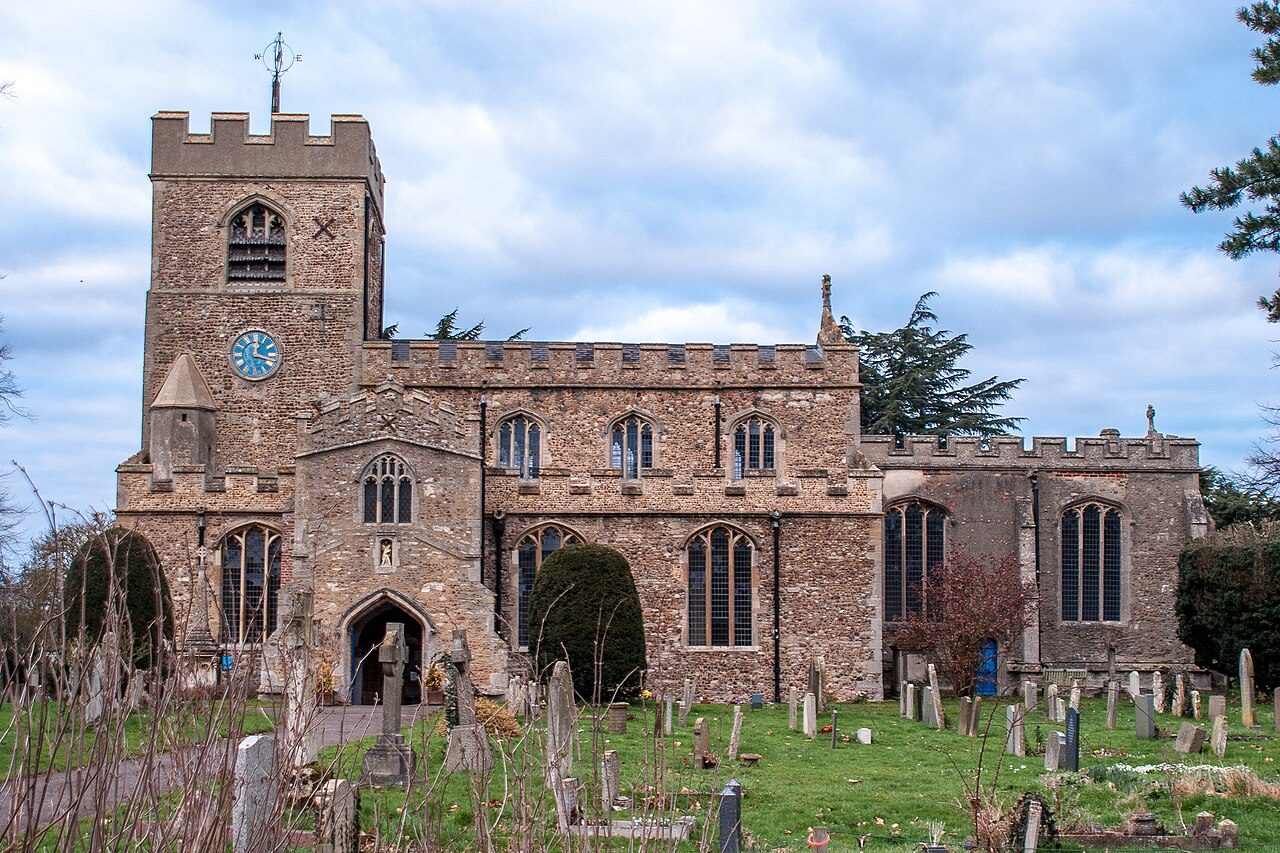
#3

Girton

Cambridgeshire · 4,384 people
A+

Score 81.4·#2 of 50 in Cambridgeshire

Strongest: jobs & income A+, health A+·lowest: hazard risk C−

The top 100

Of 2,138 graded towns and cities of 2,500+ residents. Each area rank links to that area’s full list; military garrison towns and university campuses keep their grades on their own pages but aren’t ranked. The score (0–100) blends the seven livability grades and sets the order; the letter places that score among UK towns of 2,500+, and A+ is the top 5%, so neighbours on the list often share a letter.

Scotland’s 296 towns aren’t on these overall rankings yet. Police Scotland doesn’t publish street-level crime, so Scottish towns have no Safety grade, and without one, no overall grade; each town’s page grades it on cost of living, schools, health, walkability and flood risk. The Scottish Index of Multiple Deprivation, due at the end of 2026, brings the figures for a Safety grade, and Scottish towns join the overall rankings then. Northern Ireland’s 63 towns are ranked on the five grades they have: no small-area income figures or open flood maps are published there, so they have no Jobs or Flood risk grade, and their overall grade blends the other five.

100 towns on this page. Every ranked town is on its area’s list.

#TownScoreGrade · area rankWhat drives it
1Bar HillCambridgeshire · 3,899 people87.4top 0.1%A+#1 of 50 in CambridgeshireStrongest: health A+, jobs & income A+·lowest: hazard risk B+
2Elvetham HeathHampshire · 4,916 people81.8top 0.1%A+#1 of 76 in HampshireStrongest: health A+, jobs & income A+·lowest: walkability C+
3GirtonCambridgeshire · 4,384 people81.4top 0.2%A+#2 of 50 in CambridgeshireStrongest: jobs & income A+, health A+·lowest: hazard risk C−
4West BridgfordNottinghamshire · 36,489 people80.8top 0.2%A+#1 of 49 in NottinghamshireStrongest: schools A+, jobs & income A+·lowest: hazard risk C
5KeyworthNottinghamshire · 6,822 people80.4top 0.3%A+#2 of 49 in NottinghamshireStrongest: cost of living A, health A·lowest: jobs & income B
6FleetHampshire · 37,800 people80.3top 0.3%A+#2 of 76 in HampshireStrongest: health A+, jobs & income A+·lowest: hazard risk C
7ReptonDerbyshire · 2,766 people79.7top 0.4%A+#1 of 59 in DerbyshireStrongest: jobs & income A, health A·lowest: hazard risk C+
8TwyfordBerkshire · 8,072 people79.5top 0.4%A+#1 of 30 in BerkshireStrongest: jobs & income A+, health A+·lowest: hazard risk C+
9CarryduffLisburn and Castlereagh · 7,173 people79.2top 0.5%A+#1 of 5 in Lisburn and CastlereaghStrongest: cost of living A+, safety A·lowest: walkability C
10Ingleby BarwickNorth Yorkshire · 23,380 people78.9top 0.5%A+#1 of 54 in North YorkshireStrongest: jobs & income A+, schools A+·lowest: walkability D−
11Great Shelford and StaplefordCambridgeshire · 6,159 people78.5top 0.6%A+#3 of 50 in CambridgeshireStrongest: jobs & income A+, walkability A+·lowest: cost of living C+
12WokinghamBerkshire · 50,320 people78.4top 0.6%A+#2 of 30 in BerkshireStrongest: jobs & income A+, health A+·lowest: hazard risk C
13MelbourneDerbyshire · 4,860 people78.4top 0.6%A+#2 of 59 in DerbyshireStrongest: cost of living A, jobs & income A−·lowest: walkability B
14WoodleyBerkshire · 28,019 people78.1top 0.7%A+#3 of 30 in BerkshireStrongest: jobs & income A, schools A·lowest: hazard risk B−
15Saffron WaldenEssex · 16,609 people78.1top 0.7%A+#1 of 81 in EssexStrongest: schools A+, health A·lowest: hazard risk C
16HawleyHampshire · 2,581 people77.8top 0.8%A+#3 of 76 in HampshireStrongest: cost of living A, jobs & income A·lowest: walkability B−
17HookHampshire · 9,062 people77.8top 0.9%A+#4 of 76 in HampshireStrongest: jobs & income A+, health A·lowest: hazard risk C−
18WreccleshamSurrey · 7,312 people77.7top 0.9%A+#1 of 65 in SurreyStrongest: schools A+, health A+·lowest: cost of living C
19South WonstonHampshire · 2,686 people77.4top 1.0%A+#5 of 76 in HampshireStrongest: safety A+, health A+·lowest: cost of living C
20GoringOxfordshire · 3,434 people77.4top 1.0%A+#1 of 38 in OxfordshireStrongest: jobs & income A+, health A+·lowest: hazard risk D
21Marlow BottomBuckinghamshire · 3,339 people77.3top 1.1%A+#1 of 39 in BuckinghamshireStrongest: health A+, safety A+·lowest: cost of living C
22KesgraveSuffolk · 14,947 people77.2top 1.2%A+#1 of 34 in SuffolkStrongest: jobs & income A, safety A·lowest: walkability B−
23Moor ParkHertfordshire · 5,850 people77.1top 1.2%A+#1 of 50 in HertfordshireStrongest: jobs & income A+, health A+·lowest: cost of living D
24MiltonCambridgeshire · 4,150 people77.0top 1.3%A+#4 of 50 in CambridgeshireStrongest: health A+, walkability A+·lowest: hazard risk B
25OvertonHampshire · 4,350 people77.0top 1.3%A+#6 of 76 in HampshireStrongest: health A, schools A·lowest: hazard risk C+
26East LeakeNottinghamshire · 8,551 people77.0top 1.3%A+#3 of 49 in NottinghamshireStrongest: cost of living A, health A·lowest: hazard risk B−
27Hartley WintneyHampshire · 3,465 people77.0top 1.4%A+#7 of 76 in HampshireStrongest: health A+, schools A·lowest: safety B−
28Long HanboroughOxfordshire · 3,034 people76.9top 1.4%A+#2 of 38 in OxfordshireStrongest: schools A, health A·lowest: cost of living C+
29HarpendenHertfordshire · 30,964 people76.7top 1.5%A+#2 of 50 in HertfordshireStrongest: jobs & income A+, health A+·lowest: cost of living C−
30Stansted MountfitchetEssex · 8,629 people76.6top 1.5%A+#2 of 81 in EssexStrongest: health A, jobs & income A·lowest: hazard risk C
31Walter's Ash and NaphillBuckinghamshire · 3,893 people76.6top 1.6%A+#2 of 39 in BuckinghamshireStrongest: health A+, jobs & income A+·lowest: cost of living C
32GnosallStaffordshire · 4,039 people76.5top 1.6%A+#1 of 46 in StaffordshireStrongest: schools A+, cost of living A·lowest: walkability C−
33Seer GreenBuckinghamshire · 2,582 people76.5top 1.7%A+#3 of 39 in BuckinghamshireStrongest: health A+, jobs & income A+·lowest: cost of living C−
34BinghamNottinghamshire · 10,109 people76.4top 1.7%A+#4 of 49 in NottinghamshireStrongest: cost of living A, schools A·lowest: safety B−
35Woolton Hill and HighclereHampshire · 2,755 people76.3top 1.8%A+#8 of 76 in HampshireStrongest: health A+, jobs & income A·lowest: cost of living C+
36CharvilBerkshire · 3,158 people76.3top 1.8%A+#4 of 30 in BerkshireStrongest: jobs & income A+, health A+·lowest: hazard risk D
37WargraveBerkshire · 2,896 people76.0top 1.9%A+#5 of 30 in BerkshireStrongest: health A+, jobs & income A+·lowest: hazard risk C−
38AshteadSurrey · 14,830 people75.8top 1.9%A+#2 of 65 in SurreyStrongest: jobs & income A+, schools A+·lowest: cost of living C−
39Histon and ImpingtonCambridgeshire · 7,781 people75.7top 1.9%A+#5 of 50 in CambridgeshireStrongest: schools A+, walkability A+·lowest: safety B
40Chandler's FordHampshire · 31,965 people75.5top 2.0%A+#9 of 76 in HampshireStrongest: jobs & income A+, schools A·lowest: hazard risk C−
41SilsoeBedfordshire · 3,419 people75.1top 2.0%A+#1 of 33 in BedfordshireStrongest: health A, safety A·lowest: walkability C
42Worcester Park and StoneleighSurrey · 15,851 people74.7top 2.1%A+#3 of 65 in SurreyStrongest: jobs & income A+, schools A·lowest: cost of living C−
43NewportEssex · 2,945 people74.6top 2.2%A+#3 of 81 in EssexStrongest: health A+, jobs & income A·lowest: hazard risk C+
44MagheraMid Ulster · 4,235 people74.5top 2.2%A+#1 of 5 in Mid UlsterStrongest: cost of living A+, schools A+·lowest: health C+
45HardwickCambridgeshire · 2,658 people74.5top 2.3%A+#6 of 50 in CambridgeshireStrongest: health A+, jobs & income A·lowest: walkability B−
46WinnershBerkshire · 8,904 people74.3top 2.3%A+#6 of 30 in BerkshireStrongest: jobs & income A+, schools A·lowest: hazard risk C
47HiltonDerbyshire · 8,269 people74.3top 2.4%A+#3 of 59 in DerbyshireStrongest: cost of living A+, jobs & income A+·lowest: walkability D
48WoodstockOxfordshire · 3,522 people74.2top 2.4%A+#3 of 38 in OxfordshireStrongest: jobs & income A+, health A+·lowest: cost of living C
49Watton at StoneHertfordshire · 2,614 people74.1top 2.5%A+#3 of 50 in HertfordshireStrongest: health A+, schools A·lowest: hazard risk C
50OverCambridgeshire · 2,898 people73.9top 2.5%A+#7 of 50 in CambridgeshireStrongest: safety A, jobs & income A·lowest: hazard risk C
51Great GlenLeicestershire · 4,062 people73.9top 2.5%A+#1 of 50 in LeicestershireStrongest: schools A+, cost of living A·lowest: walkability D
52LintonCambridgeshire · 4,452 people73.8top 2.6%A+#8 of 50 in CambridgeshireStrongest: health A, jobs & income A−·lowest: hazard risk C
53West BergholtEssex · 3,175 people73.7top 2.6%A+#4 of 81 in EssexStrongest: health A, jobs & income A·lowest: cost of living B−
54Great TothamEssex · 2,773 people73.6top 2.7%A+#5 of 81 in EssexStrongest: safety A+, health A·lowest: walkability C−
55Bramley and WonershSurrey · 4,193 people73.5top 2.7%A+#4 of 65 in SurreyStrongest: jobs & income A+, health A·lowest: hazard risk C−
56Colden CommonHampshire · 3,827 people73.5top 2.8%A+#10 of 76 in HampshireStrongest: health A+, hazard risk A·lowest: walkability C
57OakleyHampshire · 5,264 people73.4top 2.8%A+#11 of 76 in HampshireStrongest: health A+, jobs & income A·lowest: walkability C
58SouthwaterWest Sussex · 11,204 people73.4top 2.9%A+#1 of 40 in West SussexStrongest: jobs & income A+, schools A·lowest: cost of living C
59ChorleywoodHertfordshire · 12,632 people73.4top 2.9%A+#4 of 50 in HertfordshireStrongest: jobs & income A+, schools A+·lowest: cost of living D
60HagleyWorcestershire · 7,012 people73.4top 3.0%A+#1 of 22 in WorcestershireStrongest: jobs & income A+, health A+·lowest: hazard risk C−
61CuckfieldWest Sussex · 3,767 people73.2top 3.0%A+#2 of 40 in West SussexStrongest: jobs & income A, health A·lowest: cost of living C
62Horton HeathHampshire · 3,047 people73.2top 3.1%A+#12 of 76 in HampshireStrongest: jobs & income A+, health A·lowest: walkability D
63WillingtonDerbyshire · 2,717 people73.2top 3.1%A+#4 of 59 in DerbyshireStrongest: cost of living A, jobs & income A·lowest: hazard risk C−
64BurwellCambridgeshire · 5,912 people73.1top 3.1%A+#9 of 50 in CambridgeshireStrongest: health A, schools A·lowest: walkability C
65North FerribyEast Riding of Yorkshire · 3,964 people73.1top 3.2%A+#1 of 25 in East Riding of YorkshireStrongest: jobs & income A+, health A+·lowest: walkability C−
66UppinghamRutland · 4,272 people72.9top 3.2%A+Strongest: walkability A, health A·lowest: safety C+
67Hemingford GreyCambridgeshire · 3,372 people72.8top 3.3%A+#10 of 50 in CambridgeshireStrongest: health A, safety A·lowest: hazard risk D−
68EgglescliffeCounty Durham · 10,250 people72.7top 3.3%A+#1 of 52 in County DurhamStrongest: schools A, cost of living A−·lowest: walkability C+
69OakhamRutland · 12,159 people72.7top 3.4%A+Strongest: cost of living A, walkability A·lowest: safety B−
70Hillsborough and CulcavyLisburn and Castlereagh · 3,754 people72.7top 3.4%A+#2 of 5 in Lisburn and CastlereaghStrongest: safety A+, cost of living A·lowest: walkability D
71AmershamBuckinghamshire · 17,377 people72.7top 3.5%A+#4 of 39 in BuckinghamshireStrongest: schools A+, health A+·lowest: cost of living C−
72Haywards HeathWest Sussex · 40,186 people72.7top 3.5%A+#3 of 40 in West SussexStrongest: jobs & income A+, walkability A·lowest: hazard risk C+
73RippondenWest Yorkshire · 4,775 people72.7top 3.6%A+#1 of 91 in West YorkshireStrongest: health A, schools A·lowest: walkability C+
74KenilworthWarwickshire · 22,239 people72.6top 3.6%A+#1 of 34 in WarwickshireStrongest: jobs & income A+, schools A·lowest: hazard risk C
75Milford and WitleySurrey · 6,489 people72.6top 3.7%A+#5 of 65 in SurreyStrongest: schools A, hazard risk A·lowest: cost of living C+
76ShalfordSurrey · 2,508 people72.5top 3.7%A+#6 of 65 in SurreyStrongest: jobs & income A+, schools A·lowest: cost of living C−
77Radcliffe on TrentNottinghamshire · 7,205 people72.4top 3.8%A+#5 of 49 in NottinghamshireStrongest: cost of living A, schools A·lowest: hazard risk C−
78East HorsleySurrey · 5,843 people72.3top 3.8%A+#7 of 65 in SurreyStrongest: health A+, schools A+·lowest: hazard risk D
79ThameOxfordshire · 12,952 people72.3top 3.8%A+#4 of 38 in OxfordshireStrongest: jobs & income A+, health A·lowest: cost of living C+
80HildenboroughKent · 4,943 people72.2top 3.9%A+#1 of 87 in KentStrongest: schools A+, jobs & income A+·lowest: hazard risk D−
81Four MarksHampshire · 5,613 people72.1top 3.9%A+#13 of 76 in HampshireStrongest: health A+, jobs & income A·lowest: walkability D
82Hertford HeathHertfordshire · 2,830 people72.1top 4.0%A+#5 of 50 in HertfordshireStrongest: jobs & income A, hazard risk A·lowest: cost of living C+
83Warrenpoint and BurrenNewry, Mourne and Down · 9,091 people72.0top 4.0%A+#1 of 10 in Newry, Mourne and DownStrongest: cost of living A+, schools A·lowest: health C
84RuddingtonNottinghamshire · 7,491 people72.0top 4.1%A+#6 of 49 in NottinghamshireStrongest: schools A, cost of living A·lowest: safety B−
85YateleyHampshire · 14,676 people72.0top 4.1%A+#14 of 76 in HampshireStrongest: health A, jobs & income A·lowest: hazard risk D
86Kingston BagpuizeOxfordshire · 3,905 people71.9top 4.2%A+#5 of 38 in OxfordshireStrongest: health A+, jobs & income A·lowest: walkability C
87RudloeWiltshire · 2,863 people71.8top 4.2%A+#1 of 30 in WiltshireStrongest: hazard risk A, safety A−·lowest: schools C+
88Chalfont St GilesBuckinghamshire · 4,707 people71.7top 4.3%A+#5 of 39 in BuckinghamshireStrongest: health A+, schools A+·lowest: cost of living C−
89BroughEast Riding of Yorkshire · 13,321 people71.7top 4.3%A+#2 of 25 in East Riding of YorkshireStrongest: jobs & income A, health A·lowest: walkability C
90MalmesburyWiltshire · 7,184 people71.6top 4.4%A+#2 of 30 in WiltshireStrongest: walkability A, health A−·lowest: hazard risk C+
91FarnhamSurrey · 20,499 people71.5top 4.4%A+#8 of 65 in SurreyStrongest: schools A+, jobs & income A·lowest: hazard risk C
92EynshamOxfordshire · 5,321 people71.5top 4.4%A+#6 of 38 in OxfordshireStrongest: schools A+, walkability A·lowest: cost of living C+
93Hassocks and HurstpierpointWest Sussex · 14,216 people71.4top 4.5%A+#4 of 40 in West SussexStrongest: health A, jobs & income A·lowest: hazard risk C
94DungivenCauseway Coast and Glens · 3,346 people71.4top 4.5%A+#1 of 7 in Causeway Coast and GlensStrongest: cost of living A+, schools A+·lowest: walkability C−
95KelsallCheshire · 2,997 people71.4top 4.6%A+#1 of 46 in CheshireStrongest: health A+, schools A+·lowest: cost of living D
96DunningtonNorth Yorkshire · 3,256 people71.4top 4.6%A+#2 of 54 in North YorkshireStrongest: safety A+, jobs & income A+·lowest: cost of living D
97CambourneCambridgeshire · 11,071 people71.3top 4.7%A+#11 of 50 in CambridgeshireStrongest: schools A, health A·lowest: safety B−
98LongtonLancashire · 10,912 people71.3top 4.7%A+#1 of 65 in LancashireStrongest: schools A, jobs & income A·lowest: hazard risk C−
99MakeneyDerbyshire · 4,691 people71.3top 4.8%A+#5 of 59 in DerbyshireStrongest: health A+, jobs & income A+·lowest: hazard risk D−
100Burley in WharfedaleWest Yorkshire · 6,806 people71.2top 4.8%A+#2 of 91 in West YorkshireStrongest: schools A+, jobs & income A+·lowest: cost of living C−
Where they are

The top 100 by county

The curve is the same everywhere, so counties with many commuter towns of 2,500+ fill more of the list.

Big towns and cities

Places of 50,000+: the top 10

The same grade, among the 207 ranked towns and cities of 50,000+, so a village of 3,000 isn’t weighed against Manchester.

  1. 1A+Wokingham, Berkshire50,320
  2. 2A+Metropolitan Castlereagh, Lisburn and Castlereagh58,763
  3. 3ARichmond upon Thames, London192,888
  4. 4ASutton, London208,858
  5. 5AKingston upon Thames, London166,333
  6. 6ABromley, London325,469
  7. 7AHorsham, West Sussex50,211
  8. 8ASt Albans, Hertfordshire75,544
  9. 9AHarrogate, North Yorkshire75,522
  10. 10A−Brentwood, Essex55,339
Method

How this list is made

The overall grade blends seven livability grades (cost of living, safety, schools, health, jobs & income, walkability, hazard risk), each comparing a town with every other UK town; places are ranked on that blend, shown as the score (0–100), so the order has no ties. The list covers towns and cities of 2,500+ residents in England, Wales and Northern Ireland; Scottish towns join when they have overall grades (they have no Safety Grade until the Scottish Index of Multiple Deprivation at the end of 2026). Military garrison towns and university campuses, where most residents serve in the forces or are students, keep their grades but aren’t ranked. Wales doesn’t publish school-level results, so Welsh towns are graded on the other six. How grades work

Quick answers

Questions people ask

What is the best place to live in the UK?

Bar Hill, Cambridgeshire ranks first of 2,138 graded towns and cities of 2,500+: health (A+) and jobs & income (A+) are its strongest grades; hazard risk (B+) is its lowest. Elvetham Heath, Hampshire and Girton, Cambridgeshire follow.

What is the best big town or city to live in?

Among the 207 ranked places of 50,000+, Wokingham, Berkshire ranks first (A+), then Metropolitan Castlereagh and Richmond upon Thames.

Which county has the most of the top 100?

Hampshire, with 14; then Cambridgeshire (11), Surrey (8), Berkshire (6).

County by county

Best places to live, county by county

Sources: TownRatings grades: our own summary of the data, ranked against UK towns only. All under the Open Government Licence v3.0.

Contains public sector information licensed under the Open Government Licence v3.0. Contains HM Land Registry data © Crown copyright and database right 2026. Contains OS data © Crown copyright and database right 2026 (ONS boundaries). Northern Ireland: Source: NISRA; contains Land & Property Services data and Ordnance Survey of Northern Ireland information, © Crown copyright, licensed under the Open Government Licence v3.0. Scotland: contains National Records of Scotland data, Registers of Scotland data and SEPA data, © Crown copyright / © SEPA 2025, licensed under the Open Government Licence v3.0.