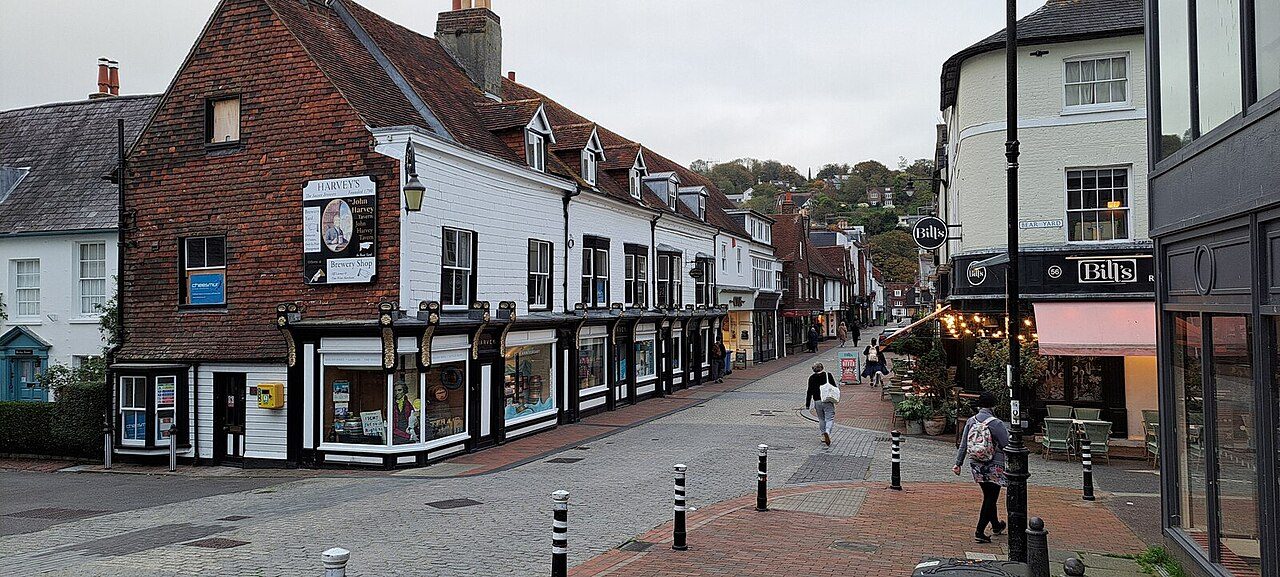
 Photo: Christopher Hilton · CC BY-SA 2.0
How East Sussex stacks up
Only three areas have homes that cost more against local incomes than East Sussex: a typical home costs 6.6 times the average household’s income. It runs from A+ on getting about to D− on cost of living. On balance it grades C, which places it 44th.
Each subject puts the official figure for the whole county beside a measure built from our town grades. How this works
Safety
41st of 65C+38/100 A bit above-average crime. Violent crime runs at 35.2 offences per 1,000 residents a year, the 31st highest rate of 65 areas with police.uk figures. Every neighbour scores higher, West Sussex, Kent and Surrey among them. 23% of town residents live in a top-quarter town, 15% in a bottom-quarter one; Newick ranks highest.
All recorded crime (anti-social behaviour left out): 83 per 1,000 residents a year, 17th highest.
Source: police.uk street-level crime, September 2025 to August 2026 (each crime placed by its LSOA); Census 2021 residents. Greater Manchester Police publishes none.
Measure: recorded crime against residents (violence, burglary, vehicle crime, criminal damage), as in our Safety grades. The top quarter is the best-placed towns holding a quarter of the people in the UK’s 2,138 graded towns. 26 East Sussex towns.
A mixed picture, town by town
East Saltdean leads its towns at #38 of 2,138, with Crumbles and Lower Willingdon close behind. Hastings and Newhaven sit at the high-crime end of the ranking.
| County | Safest quarter | Most-crime quarter | Split |
|---|---|---|---|
| Ards and North Down | 100% | 0% | |
| Armagh City, Banbridge and Craigavon | 100% | 0% | |
| Lisburn and Castlereagh | 100% | 0% | |
| Mid Ulster | 100% | 0% | |
| Antrim and Newtownabbey | 78% | 0% | |
| East Sussex | 23% | 15% |
What the two figures count
Each crime on police.uk is pinned to a nearby street or public place, not an address; both figures count crimes where those points fall. The county-wide rate takes in town centres, stations and shopping streets, where many offences are recorded but few people live. Our town grades leave shop theft and other town-centre crime out and count violence, burglary, vehicle crime and criminal damage, the crimes that reach people at home.
Schools
54th of 90C+40/100 Results slightly under the middle for England. In the tests every English pupil sits at eleven, 62% here reach the expected standard in reading, writing and maths (19th lowest). Every neighbour scores higher, West Sussex, Kent and Surrey among them. Its towns mostly sit mid-table; Bexhill-on-Sea ranks highest, at #373.
GCSE: an average Attainment 8 score of 45.4, 19th lowest. The grade weighs primary and GCSE results equally.
Source: DfE key stage 2 results 2024/25 and key stage 4 (Attainment 8), every state school in the county, pupil-weighted. England only.
Measure: our Schools grade: primary and secondary results of the schools in and around each town. The top quarter is the best-placed towns holding a quarter of the people in the UK’s 2,331 graded towns. 26 East Sussex towns.
Cost of living
96th of 98D−2/100 Among the least affordable areas. None of its towns makes the top quarter; Hailsham comes closest, at #1,851 of 2,515. Homes cost 6.6 times what the average household takes in a year, 27% above the England and Wales figure: a typical sale of £360,000 against income of £54,200.
Typical sale price: £360,000 (9,647 sales, 9th highest).
Private rent £1,404 a month (11th highest); Band D council tax £2,664 (4th highest). Shown for context.
Source: HM Land Registry Price Paid, standard sales September 2025 to August 2026; ONS small-area income estimates (financial year ending 2023); ONS Price Index of Private Rents (August 2026); council Band D 2026/27.
Measure: our Cost of living grade: prices and rents against local income, plus council tax. The top quarter is the best-placed towns holding a quarter of the people in the UK’s 2,515 graded towns. 26 East Sussex towns.
Health
34th of 98B+66/100 A little healthier than average. West Sussex, Kent and Surrey all do better on health. Healthy life expectancy at birth is 66.2 years (men and women averaged), 1.0 years more than the England and Wales figure. 19% of town residents live in a top-quarter town, 13% in a bottom-quarter one; Wadhurst ranks highest.
Total life expectancy is 81.5 years (20th longest).
Source: ONS life expectancy and healthy life expectancy by small area (MSOA), 2019 to 2023, men and women averaged.
Measure: our Health grade: ONS life and healthy life expectancy, Census health, and OHID indicators in England. The top quarter is the best-placed towns holding a quarter of the people in the UK’s 2,515 graded towns. 26 East Sussex towns.
Jobs & income
60th of 98C+39/100 A little less money than most. Incomes and work tell different stories: 22nd highest household income, but the 17th highest share claiming out-of-work benefits (3.9%). Households take in £54,200 a year on average (22nd highest), and 3.9% of working-age adults claim out-of-work benefits. West Sussex, Kent and Surrey all do better on incomes.
Out-of-work claimants in August 2026: 3.9% of working-age adults (17th highest), weighed with income in the grade.
Source: ONS small-area income estimates (financial year ending 2023), household-weighted; DWP claimant count (August 2026) by council.
Measure: our Jobs & income grade: household income. The top quarter is the best-placed towns holding a quarter of the people in the UK’s 2,156 graded towns. 26 East Sussex towns.
Getting about
6th of 98A+95/100 Among the easiest places to get about without a car. About 3 in 10 commuters leave the car at home here (5th highest). Only London and one other area put more town residents in the most walkable quarter of towns. No neighbour beats it on walkability; Surrey comes closest.
Worked mainly from home at the 2021 Census: 35% of workers (context; they are left out of the commuting share).
Source: ONS Census 2021, method of travel to work (TS061) by council; people working mainly from home left out.
Measure: our Walkability grade: how many everyday places are within reach on foot. The top quarter is the best-placed towns holding a quarter of the people in the UK’s 2,515 graded towns. 26 East Sussex towns.
Flood risk
54th of 87C+38/100 Somewhat more flood-prone than average. The Environment Agency and Natural Resources Wales put 3,929 homes in its towns at high or medium flood risk, 1.2% of them. Wadhurst leads its towns at #413 of 2,452; 13% of town residents live in top-quarter towns.
Source: Environment Agency and Natural Resources Wales flood-risk maps (rivers and the sea), homes in every town of the county.
Measure: our Hazard risk grade: the share of homes at high or medium flood risk. The top quarter is the best-placed towns holding a quarter of the people in the UK’s 2,452 graded towns. 26 East Sussex towns.
Growth
57th of 98C+42/100 Growing a little slower than average. ONS estimates put 844,752 people here in 2024, +5.6% on 2011 (43rd slowest). Hellingly is among the ten best towns in the UK for growth (#3). 62% of town residents live in bottom-quarter towns, among them Brighton and Hove and Hastings.
Since the 2021 Census: +2.6%, 49th slowest.
Source: ONS mid-year population estimates, 2011 and 2024.
Measure: population change from 2011 to 2024 (ONS estimates for built-up areas). The top quarter is the best-placed towns holding a quarter of the people in the UK’s 1,579 graded towns. 23 East Sussex towns.
How East Sussex compares to its neighbours
Next to West Sussex, Kent and Surrey, it comes out ahead on getting about and behind on safety, schools and health.
| East Sussex | West Sussex | Kent | Surrey | |
|---|---|---|---|---|
| Overall | C 3344th of 65 | A− 8113th of 65 | B 6126th of 65 | A 898th of 65 |
| Safety | C+ 3835th official · 23% in top towns | A− 7818th official · 51% in top towns | B− 5033rd official · 26% in top towns | A 8812th official · 71% in top towns |
| Schools | C+ 4029th official · 7% in top towns | B+ 6531st official · 22% in top towns | A− 7815th official · 22% in top towns | A+ 972nd official · 72% in top towns |
| Cost of living | D− 295th official · 0% in top towns | D− 394th official · 0% in top towns | D 985th official · 0% in top towns | D− 097th official · 0% in top towns |
| Health | B+ 6623rd official · 19% in top towns | A 887th official · 49% in top towns | B+ 6725th official · 23% in top towns | A+ 982nd official · 98% in top towns |
| Jobs & income | C+ 3922nd official · 7% in top towns | A− 7813th official · 33% in top towns | B+ 6515th official · 21% in top towns | A+ 992nd official · 99% in top towns |
| Getting about | A+ 955th official · 41% in top towns | B+ 7427th official · 4% in top towns | A− 7632nd official · 8% in top towns | A− 8123rd official · 14% in top towns |
| Flood risk | C+ 3823rd official · 13% in top towns | B− 5035th official · 26% in top towns | B 5536th official · 30% in top towns | C− 1751st official · 18% in top towns |
| Growth | C+ 4256th official · 7% in top towns | A 8613th official · 38% in top towns | A− 8117th official · 29% in top towns | B+ 6730th official · 22% in top towns |
Each cell: the subject’s grade and score, the county’s rank on the official figure (1st = the better end), and the share of its town residents living in a top-quarter town for the UK. Neighbour names open their report cards.
How this report card works
Two measures, side by side. The left card is an official figure for the whole county, its towns, villages and countryside together, built from the small areas and councils that make it up and ranked against the other counties. The right card is built from our town grades: of everyone living in the county’s graded towns of 2,500 or more, the share whose town is in the top quarter for the UK. Quarters are of people, not towns: the top quarter is the best-placed towns that together hold a quarter of everyone living in graded towns, so a county of big cities is not marked down just for being urban. A county can do well on one measure and not the other; that difference is often the story.
Scores and grades. Each subject’s score (0–100) is the area’s standing in one UK league of 98: the ceremonial counties of England (London counts as one), Wales’s eight preserved counties, and Scotland’s 32 and Northern Ireland’s 11 council areas, each called by its own name. The two measures’ percentiles are averaged, then ranked again, the same method as our town grades. Where a nation publishes its own kind of figure, the official figure is ranked within that nation: school results everywhere, health in Scotland and Northern Ireland, and flood risk in Scotland. Each area’s figures are set beside its own nation’s. 100 is the best county, 0 the last. Letters use the town-grade scale (A+ from 95, A from 85, A− from 75 … D below 15). The overall score weighs safety 18, cost of living 18, schools 16, health 14, jobs & income 12, getting about 8, growth 8, flood risk 6 (out of 100), over the subjects a county has. Counties with fewer than 5 graded towns (Rutland, Bristol) are graded on the official figures alone.
What it is not. A county figure averages everyone, so it cannot show whether a county is evenly good or a mix of very good and struggling places. The town measure shows the mix but leaves out villages and towns under 2,500. Neither says anything about any one street.
Gaps. Wales publishes no school results that compare with England’s, so Welsh counties have no Schools grade. Greater Manchester Police publishes no street-level crime, so Greater Manchester has no Safety grade and, as for its towns, no overall grade. Nor does Police Scotland, so Scotland’s council areas have no Safety grade or overall grade yet. Scotland and Northern Ireland have no small-area income figures, so their household income is estimated from ONS household income per head. Flood risk has no county-wide official figure; it is the share of homes in the county’s towns at high or medium risk. Sources are named under each figure. How grades work
Sources: TownRatings grades: our own summary of the data, ranked against UK towns only. All under the Open Government Licence v3.0.
Contains public sector information licensed under the Open Government Licence v3.0. Contains HM Land Registry data © Crown copyright and database right 2026. Contains OS data © Crown copyright and database right 2026 (ONS boundaries). Northern Ireland: Source: NISRA; contains Land & Property Services data and Ordnance Survey of Northern Ireland information, © Crown copyright, licensed under the Open Government Licence v3.0. Scotland: contains National Records of Scotland data, Registers of Scotland data and SEPA data, © Crown copyright / © SEPA 2025, licensed under the Open Government Licence v3.0.