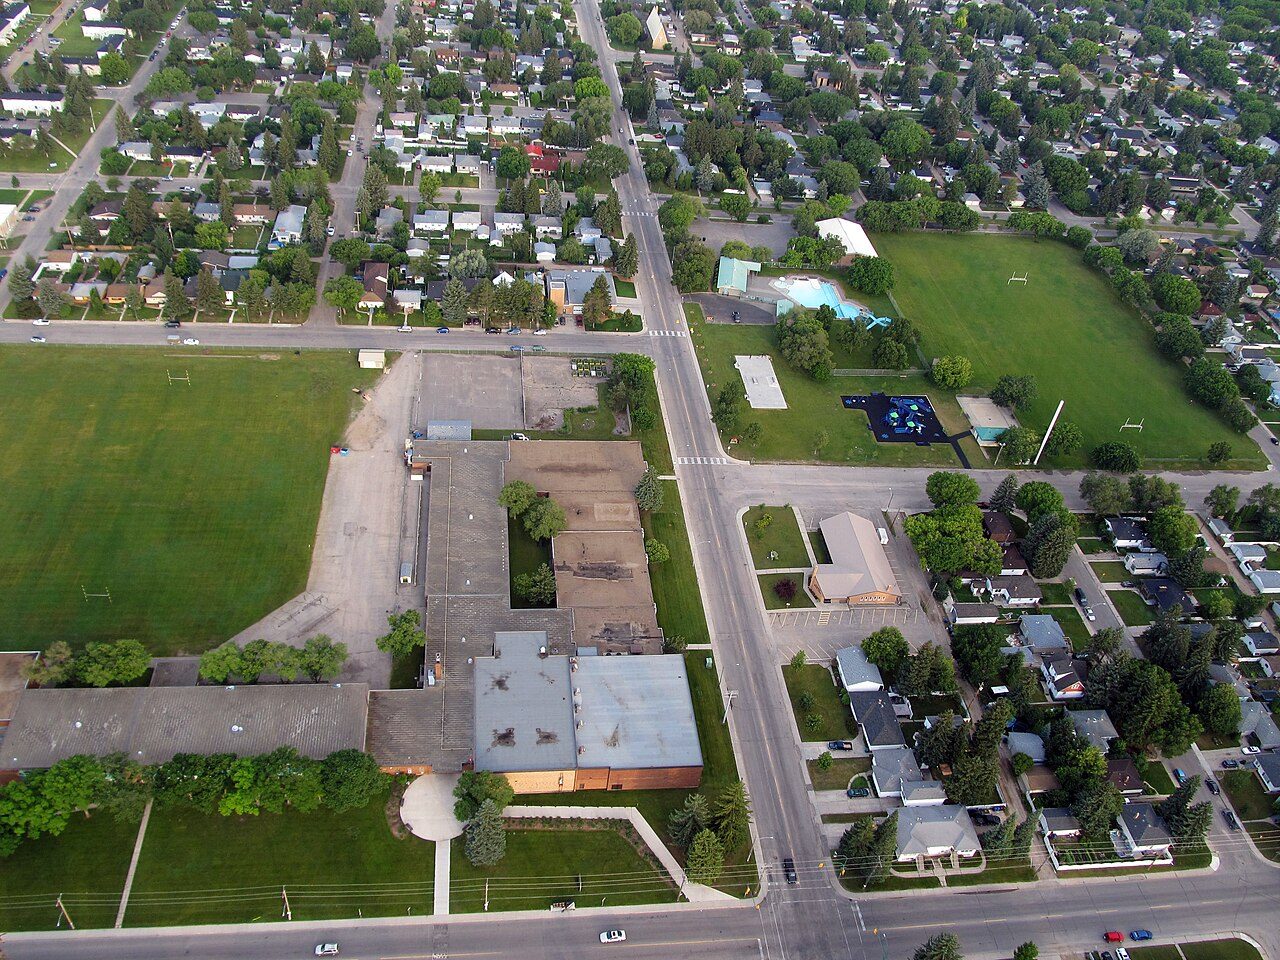
Home › Canada › Saskatchewan › Rankings › Most bilingual Cathedral Village, #1 on this list · Photo: Daniel Paquet from Regina, Canada (CC BY-SA 2.0) Saskatchewan · 2026 Most bilingual towns in Saskatchewan Last comes La Loche, at 0.8%. Nationally, Cathedral Village ranks #924 of 2,589. Not one of Saskatchewan’s places reaches the top 100 for all of Canada. Nowhere in Saskatchewan does better on this list than Cathedral Village, at 11.4%. Haultain is second (11.2%) and Lakeview third (11.0%). The middle of the list is Edenwold No. 158, with 5.4%.
Share of residents who can hold a conversation in both English and French, 2021 census How grades work
#1 Saskatchewan · 7,311 people 11.4% English and French Overall C+ · #1,731 of 2,556
Strongest: walkability A+ , health B+ · lowest: cost of living C−
#2 Saskatchewan · 6,126 people 11.2% English and French Overall B− · #1,395 of 2,556
Strongest: walkability A+ , hazard risk A · lowest: cost of living D
#3 Saskatchewan · 7,770 people 11.0% English and French Overall B+ · #631 of 2,556
Strongest: jobs & income A+ , walkability A · lowest: safety C−
All 104, ranked in Saskatchewan Best first in Saskatchewan; beside each place, its rank on the same list for all of Canada.
Every Saskatchewan list # Town English and French Canada rank What drives it
1 Cathedral Village 7,311 people 11.4% #924 of 2,589 Strongest: walkability A+ , health B+ · lowest: cost of living C− 2 Haultain 6,126 people 11.2% #932 of 2,589 Strongest: walkability A+ , hazard risk A · lowest: cost of living D 3 Lakeview 7,770 people 11.0% #939 of 2,589 Strongest: jobs & income A+ , walkability A · lowest: safety C− 4 Buena Vista 5,777 people 11.0% #941 of 2,589 Strongest: walkability A+ , jobs & income A+ · lowest: cost of living D 5 Prince Albert No. 461 3,589 people 10.3% #987 of 2,589 Strongest: hazard risk A , cost of living B+ · lowest: safety D− 6 City Park 3,827 people 9.9% #1,018 of 2,589 Strongest: walkability A+ , hazard risk A · lowest: cost of living D− 8 Buckland No. 491 3,550 people 9.1% #1,081 of 2,589 Strongest: jobs & income A , cost of living B+ · lowest: safety D− 9 Whitmore Park 6,603 people 8.9% #1,098 of 2,589 Strongest: jobs & income A+ , health B+ · lowest: safety C− 10 Brevoort Park 3,485 people 8.5% #1,153 of 2,589 Strongest: walkability A+ , hazard risk A · lowest: cost of living D 11 Grosvenor Park 6,240 people 8.5% #1,157 of 2,589 Strongest: walkability A+ , hazard risk A · lowest: cost of living D− 12 Eastview 7,536 people 8.2% #1,191 of 2,589 Strongest: hazard risk A , jobs & income B+ · lowest: cost of living D 13 Silverwood Heights 8,153 people 8.0% #1,211 of 2,589 Strongest: jobs & income A+ , hazard risk A · lowest: safety C− 14 Boothill 2,613 people 7.9% #1,222 of 2,589 Strongest: jobs & income A+ , health B+ · lowest: safety C− 15 North Park 5,000 people 7.9% #1,226 of 2,589 Strongest: hazard risk A , walkability A− · lowest: cost of living D 16 Lawson Heights 8,158 people 7.8% #1,240 of 2,589 Strongest: jobs & income A+ , hazard risk A · lowest: safety C− 18 McNab 2,510 people 7.7% #1,259 of 2,589 Strongest: health B+ , walkability B · lowest: cost of living D 19 Caswell Hill 2,573 people 7.5% #1,294 of 2,589 Strongest: hazard risk A , walkability A · lowest: safety C− 20 Hillsdale 6,792 people 7.5% #1,297 of 2,589 Strongest: walkability A , health B+ · lowest: cost of living D 21 Arcola East 33,823 people 7.4% #1,308 of 2,589 Strongest: jobs & income A+ , cost of living B+ · lowest: safety C− 22 Adelaide/Churchill 2,652 people 7.3% #1,326 of 2,589 Strongest: jobs & income A+ , hazard risk A · lowest: safety C− 23 Downtown 4,282 people 7.3% #1,340 of 2,589 Strongest: walkability A+ , health B+ · lowest: cost of living D 24 Brighton 7,238 people 7.2% #1,351 of 2,589 Strongest: jobs & income A+ , hazard risk A · lowest: safety C− 25 Prince Albert 40,728 people 7.2% #1,361 of 2,589 Strongest: hazard risk A+ , walkability B · lowest: safety D− 26 La Ronge 2,668 people 7.2% #1,363 of 2,589 Strongest: walkability A− , jobs & income A− · lowest: hazard risk D− 27 Greystone Heights 6,402 people 7.1% #1,371 of 2,589 Strongest: walkability A+ , jobs & income A · lowest: safety C− 28 Willowgrove 9,787 people 6.9% #1,409 of 2,589 Strongest: jobs & income A , hazard risk A · lowest: safety C− 29 Stonebridge 15,230 people 6.9% #1,415 of 2,589 Strongest: jobs & income A+ , hazard risk A · lowest: safety C− 30 Twin Lakes 7,286 people 6.8% #1,423 of 2,589 Strongest: jobs & income A+ , cost of living B+ · lowest: safety C− 31 Evergreen 16,088 people 6.6% #1,474 of 2,589 Strongest: jobs & income A+ , hazard risk A · lowest: safety C− 32 Mayfair 2,927 people 6.6% #1,481 of 2,589 Strongest: walkability A , hazard risk A · lowest: safety C− 33 Harbour Landing 14,402 people 6.4% #1,520 of 2,589 Strongest: jobs & income A+ , health B · lowest: safety C− 34 Avalon 9,488 people 6.3% #1,547 of 2,589 Strongest: jobs & income A , hazard risk A · lowest: safety C− 35 University 5,888 people 6.3% #1,555 of 2,589 Strongest: hazard risk A , walkability A− · lowest: cost of living D 36 Dewdney Place 3,021 people 6.3% #1,563 of 2,589 Strongest: walkability A+ , health B+ · lowest: cost of living D 37 Holliston 2,963 people 6.2% #1,574 of 2,589 Strongest: walkability A , jobs & income A · lowest: safety C− 38 White City 4,379 people 6.1% #1,595 of 2,589 Strongest: jobs & income A+ , cost of living A− · lowest: walkability C 39 Lakewood Urban Centre 4,923 people 6.1% #1,601 of 2,589 Strongest: hazard risk A , jobs & income A · lowest: safety C− 40 Prairie View 8,517 people 6.1% #1,607 of 2,589 Strongest: jobs & income A+ , cost of living A− · lowest: safety C− 41 Nutana Park 3,045 people 6.1% #1,610 of 2,589 Strongest: hazard risk A , jobs & income A · lowest: safety C− 42 Al Ritchie 8,087 people 6.1% #1,614 of 2,589 Strongest: walkability A , health B+ · lowest: safety C− 43 Albert Park 12,967 people 6.0% #1,631 of 2,589 Strongest: walkability A+ , jobs & income A− · lowest: cost of living C− 44 South West Industrial 5,297 people 6.0% #1,634 of 2,589 Strongest: hazard risk A , health B+ · lowest: safety C− 45 North Battleford 14,882 people 6.0% #1,641 of 2,589 Strongest: hazard risk A− , walkability A− · lowest: safety D− 46 Rosewood 8,427 people 5.9% #1,667 of 2,589 Strongest: jobs & income A , hazard risk A · lowest: safety C− 47 Hampton Village 9,119 people 5.8% #1,684 of 2,589 Strongest: jobs & income A+ , hazard risk A · lowest: safety C− 48 Battleford 4,657 people 5.8% #1,696 of 2,589 Strongest: jobs & income A+ , hazard risk A− · lowest: safety D− 49 Westmount 2,872 people 5.8% #1,701 of 2,589 Strongest: walkability A , hazard risk A · lowest: cost of living D 50 Regent Park 2,876 people 5.6% #1,748 of 2,589 Strongest: jobs & income A , health B+ · lowest: safety C− 51 Nutana Urban Centre 5,926 people 5.6% #1,756 of 2,589 Strongest: walkability A , hazard risk A · lowest: cost of living D 53 Edenwold No. 158 4,932 people 5.4% #1,791 of 2,589 Strongest: jobs & income A+ , safety B+ · lowest: walkability C 54 Moose Jaw 36,337 people 5.4% #1,803 of 2,589 Strongest: walkability B+ , hazard risk B · lowest: safety C− 55 Lakewood 14,880 people 5.4% #1,807 of 2,589 Strongest: hazard risk A , walkability A− · lowest: cost of living D 56 Normanview West 2,866 people 5.3% #1,832 of 2,589 Strongest: jobs & income A , walkability B+ · lowest: safety C− 58 Corman Park No. 344 10,463 people 5.0% #1,912 of 2,589 Strongest: jobs & income A , hazard risk A · lowest: walkability C− 59 Argyle North 9,971 people 5.0% #1,919 of 2,589 Strongest: jobs & income A , health B+ · lowest: safety C− 60 Heritage 5,172 people 5.0% #1,932 of 2,589 Strongest: walkability A+ , health B+ · lowest: cost of living D 62 Meadowgreen 3,782 people 4.9% #1,970 of 2,589 Strongest: hazard risk A , walkability A · lowest: cost of living D 65 Pleasant Hill 6,088 people 4.7% #2,033 of 2,589 Strongest: walkability A+ , hazard risk A · lowest: cost of living D 66 Dundonald 2,855 people 4.6% #2,037 of 2,589 Strongest: jobs & income A+ , hazard risk A · lowest: safety C− 67 Pacific Heights 3,770 people 4.6% #2,051 of 2,589 Strongest: hazard risk A , health B+ · lowest: safety C− 68 Swift Current 18,154 people 4.5% #2,076 of 2,589 Strongest: jobs & income A , health B · lowest: safety C− 69 Confederation Park 5,771 people 4.5% #2,077 of 2,589 Strongest: jobs & income A , hazard risk A · lowest: safety C− 70 Mount Royal 5,292 people 4.4% #2,128 of 2,589 Strongest: hazard risk A , walkability A · lowest: cost of living D 71 Rosemont/Mount Royal 10,497 people 4.3% #2,157 of 2,589 Strongest: jobs & income B+ , health B+ · lowest: safety C− 72 Sherwood/McCarthy 5,753 people 4.2% #2,178 of 2,589 Strongest: jobs & income A , health B · lowest: safety C− 73 Fairhaven 6,536 people 4.1% #2,205 of 2,589 Strongest: hazard risk A , walkability A− · lowest: cost of living D 74 North Central 9,124 people 4.0% #2,240 of 2,589 Strongest: walkability A , health B+ · lowest: jobs & income D 75 Dewdney East 18,670 people 3.9% #2,258 of 2,589 Strongest: jobs & income A , walkability B+ · lowest: safety C− 76 Parkridge 4,518 people 3.8% #2,288 of 2,589 Strongest: hazard risk A , health B+ · lowest: safety C− 77 Uplands 5,273 people 3.7% #2,311 of 2,589 Strongest: jobs & income A+ , health B+ · lowest: safety C− 78 Coronation Park 7,307 people 3.7% #2,320 of 2,589 Strongest: walkability A , health B+ · lowest: cost of living C− 79 Massey Place 6,561 people 3.7% #2,321 of 2,589 Strongest: hazard risk A , walkability A · lowest: cost of living D 80 Westview 2,670 people 3.6% #2,330 of 2,589 Strongest: hazard risk A , jobs & income A− · lowest: safety C− 81 Martensville 11,808 people 3.4% #2,355 of 2,589 Strongest: jobs & income A+ , hazard risk A · lowest: walkability C+ 82 Estevan 11,391 people 3.4% #2,356 of 2,589 Strongest: jobs & income A+ , cost of living A · lowest: health C− 83 Vanscoy No. 345 3,029 people 3.4% #2,358 of 2,589 Strongest: hazard risk A+ , jobs & income A− · lowest: walkability C 84 Warman 14,245 people 3.3% #2,373 of 2,589 Strongest: jobs & income A+ , safety A · lowest: walkability B− 85 Melville 4,547 people 3.0% #2,427 of 2,589 Strongest: walkability A , cost of living B+ · lowest: safety C− 86 Northeast 9,670 people 3.0% #2,432 of 2,589 Strongest: walkability A− , health B+ · lowest: cost of living D 87 Lloydminster (Part) 13,137 people 2.9% #2,449 of 2,589 Strongest: hazard risk A− , jobs & income A− · lowest: safety D 88 Yorkton 17,543 people 2.9% #2,450 of 2,589 Strongest: jobs & income A− , walkability B+ · lowest: safety D 89 Esterhazy 2,513 people 2.8% #2,453 of 2,589 Strongest: jobs & income A+ , cost of living A · lowest: health C− 90 Meadow Lake 5,667 people 2.6% #2,475 of 2,589 Strongest: walkability A , hazard risk A− · lowest: safety D− 91 Meadow Lake No. 588 2,712 people 2.5% #2,492 of 2,589 Strongest: jobs & income A+ , hazard risk A− · lowest: walkability D 92 Moosomin 2,906 people 2.3% #2,504 of 2,589 Strongest: jobs & income A+ , cost of living A− · lowest: health C− 93 Humboldt 6,551 people 2.2% #2,510 of 2,589 Strongest: jobs & income A , hazard risk A · lowest: health C− 94 Pilot Butte 3,255 people 2.1% #2,517 of 2,589 Strongest: jobs & income A , cost of living A− · lowest: walkability C 95 Tisdale 3,052 people 2.1% #2,522 of 2,589 Strongest: jobs & income A , hazard risk B+ · lowest: safety D 96 Weyburn 11,871 people 1.7% #2,550 of 2,589 Strongest: jobs & income A , walkability B · lowest: health C− 97 Nipawin 5,033 people 1.7% #2,552 of 2,589 Strongest: walkability A− , hazard risk B+ · lowest: safety D 98 Rosetown 2,600 people 1.6% #2,553 of 2,589 Strongest: jobs & income A+ , cost of living A · lowest: hazard risk B 99 Kindersley 4,740 people 1.6% #2,555 of 2,589 Strongest: jobs & income A+ , walkability A− · lowest: safety C− 100 Unity 2,543 people 1.6% #2,556 of 2,589 Strongest: jobs & income A , walkability A · lowest: safety C− 101 Melfort 6,028 people 1.6% #2,558 of 2,589 Strongest: jobs & income A , walkability A− · lowest: safety D 102 Rosthern No. 403 2,791 people 1.5% #2,561 of 2,589 Strongest: hazard risk A+ , jobs & income A · lowest: health D− 103 Outlook 2,629 people 0.9% #2,581 of 2,589 Strongest: walkability A , safety A− · lowest: hazard risk B 104 La Loche 3,124 people 0.8% #2,584 of 2,589 Strongest: walkability A , cost of living A− · lowest: hazard risk D− Rankings
More lists for Saskatchewan Province by province
Most bilingual elsewhere Photos: Cathedral Village, Daniel Paquet from Regina, Canada (CC BY-SA 2.0 ) · Haultain, daryl_mitchell from Saskatoon, Saskatchewan, Canada (CC BY-SA 2.0 ) · Lakeview, Masalai (Public domain ), via Wikimedia Commons.
Sources: TownRatings grades: our own summary of the data, ranking Canadian towns against each other only, run #73 of 10 November 2026. Under the Statistics Canada Open Licence.
Adapted from Statistics Canada (Census of Population 2021, population estimates 2025, 2021 census boundaries) under the Statistics Canada Open Licence; this does not constitute an endorsement by Statistics Canada. Neighbourhood names in some cities © OpenStreetMap contributors (ODbL).
 #1
 #2
 #3