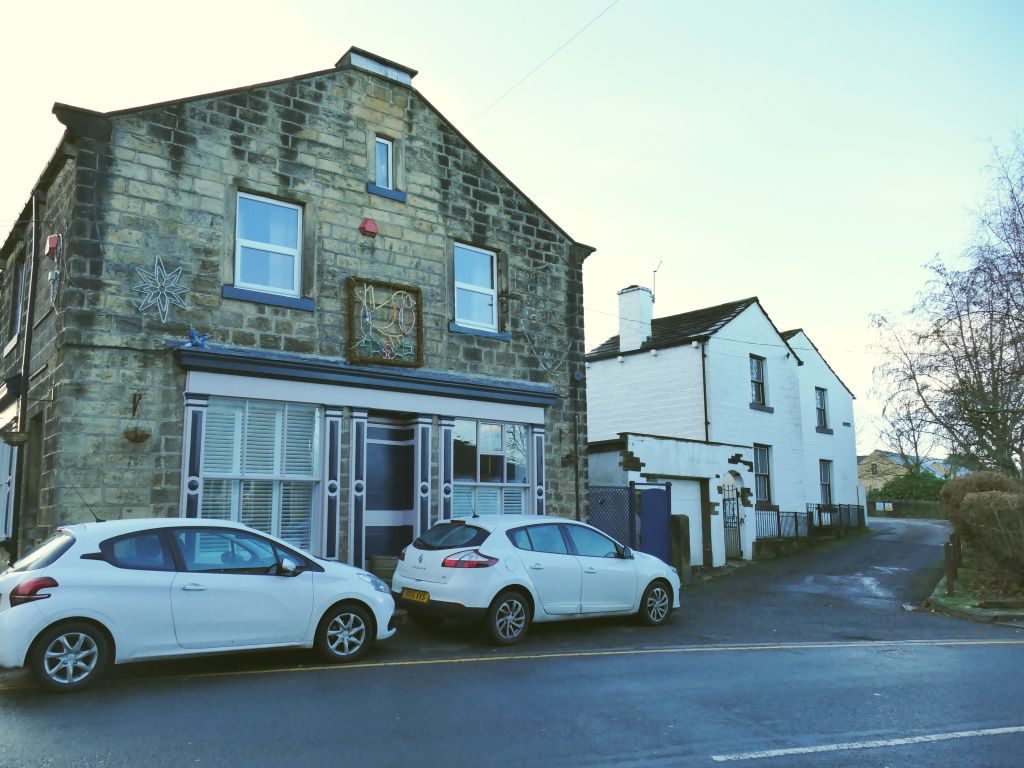
Much to like here, and you pay for it. Its best grade is for schools: primary results beat 98% of towns in England; secondary results beat 92% of towns in England. Overall, Burley in Wharfedale earns an A+, better than 95% of UK towns. In the ranking it comes #2 of 91 in West Yorkshire. Households here earn well: households earn a mean £64,293 a year, and 1.5% of 16 to 64s claim unemployment benefits. Housing is expensive: homes sell for a median £415,000, about 9.1 times local household income.
Figures: income, ONS · claimants, DWP · prices, HM Land Registry, the last three years.
Each subject compared with the 2,160 UK towns with an overall grade (schools within England), ordered by how far Burley in Wharfedale is from typical. American towns are graded separately.
Data highlights are ordered by what stands out in Burley in Wharfedale.
SchoolsA+
Results at Burley in Wharfedale’s schools beat 97% of towns in England
78% of pupils at the town’s 2 primary schools met the expected standard in reading, writing and maths (three-year average). Its two schools are listed below. Burley in Wharfedale’s two primaries have 599 pupils between them.
Department for Education · GIAS, Key Stage 2 and GCSE resultsSee all 2 schools →
Health
Bad health is less common in Burley in Wharfedale than in West Yorkshire’s towns or across England’s towns: 3.3% of residents
14% of residents have a disability, below West Yorkshire’s towns (18%) and England’s towns (17%) alike. Self-reported good health: 86% of Burley in Wharfedale’s residents. Women here live to 85.9 on average and men to 82 (2019–23). The nearest A&E to Burley in Wharfedale is Bradford Royal Infirmary, 7.4 miles away.
ONS Census 2021, general health and disability · OHID Fingertips, life expectancy 2019–23 · OGL · Young towns look healthier on these answers, which aren’t adjusted for age; the Health Grade uses measures that are, such as life expectancy and early deaths.
HousingCost of living grade C−
Burley in Wharfedale is a town of owners: 81% of households own their home, above West Yorkshire’s towns and England’s towns
8% of households rent from a council or housing body. Private renters make up just over one in ten households, below both West Yorkshire’s towns (21%) and England’s towns (21%). Burley in Wharfedale is the second most expensive of the 91 towns in West Yorkshire, at £415,000.
£415Kmedian sale
Median sale price · Sep 2023 to Aug 2026
Burley in Wharfedale£415K
Typical UK town£277K
By type
Median
Sales
Detached
£538,500
136
Semi-detached
£426,498
86
Terraced
£310,000
99
Flat or maisonette
£258,000
41
81%
of households own their home · England 61%
11%
rent privately · England 21%
£745
average private rent a month, Bradford council area
HM Land Registry Price Paid · ONS private rents · MHCLG / Welsh Government council tax · ONS Census 2021 tenure · OGL
History
1 Grade I buildings among Burley in Wharfedale’s 41 listed
The heritage lists give each building’s grade but not its age, so we don’t say which is oldest.
Homes from before 1919 make up 24% of the total. Burley in Wharfedale’s listed buildings include Burley House, Grade I. Conservation areas cover 15% of the town’s land, lower than West Yorkshire’s towns (96%) yet higher than England’s towns (7%).
Historic England list, October 2026 · Valuation Office Agency, homes by build period · OGL
Safety
Burley in Wharfedale records less violent crime per resident than West Yorkshire’s towns or England’s towns, at 15.1 per 1,000 a year
The 12 months to August 2026 brought 190 recorded crimes inside Burley in Wharfedale’s built-up area, and 32 reports of anti-social behaviour. Homes saw 8.6 burglaries and acts of damage per 1,000 residents a year, below West Yorkshire’s towns (12.7) and England’s towns (9.4) alike. Among the 1,308 UK towns of 2,500 to 10,000 people, Burley in Wharfedale has less crime per resident than four fifths of them. Violence and sexual offences made up half of the total.
15.1violent and sexual offences per 1,000 a yearB+Safety Grade
Compared with UK towns its sizeLess crime per resident than 80% of the 1,308 UK towns of 2,500 to 10,000 people: less crime than most for its size. Context only, not part of the grade.
More crimeLess crime
Reports by type · Sep 2025 to Aug 2026
Violence & sexual95
Vehicle crime17
Burglary16
Damage & arson15
Public order14
Other theft14
Other crime10
Drugs3
Anti-social32
Not gradedAnti-social behaviour, shoplifting and other theft are shown but left out of the Safety Grade, which counts violence and crimes against homes and vehicles per resident.
15.1
violent and sexual offences per 1,000 residents a year, averaged Sep 2023 to Aug 2026
8.6
burglary, vehicle crime and damage per 1,000 a year, averaged Sep 2023 to Aug 2026
3.8
anti-social behaviour reports per 1,000 (not graded)
data.police.uk street-level crime · points inside the ONS built-up-area boundary · OGL · The police category of violence and sexual offences includes harassment and stalking.
Work & commuteJobs & income grade A+
Under 5 km to work: 25% in Burley in Wharfedale, fewer than in West Yorkshire’s towns or England’s towns
The Census was taken on 21 March 2021, in lockdown, so 45% of workers were mainly at home; shares here are of those who travelled.
Four in five commuters drove, above both West Yorkshire’s towns (74%) and England’s towns (70%). Working from home was the norm for 45% of workers at the census. Also worth knowing: the 2026 claimant rate among 16 to 64s was 1.5%.
ONS Census 2021, method of travel and distance to work · ONS small-area income · DWP claimant count · OGL
Who lives here
Degrees are more common in Burley in Wharfedale than in West Yorkshire’s towns or across England’s towns: 49% of adults
People aged 15 to 24 make up 8.8% of the town. 23% of residents are 65 or over, above West Yorkshire’s towns (17%) and England’s towns (18%) alike. The middle age in Burley in Wharfedale is 46.2.
46.2median age
Burley in WharfedaleWest YorkshireEngland
Ages · share of residents
23%
Under 1515–2425–4445–6465+
Qualifications · residents 16 and older
No qualifications11%
Apprenticeship5%
A levels or similar15%
Degree level49%
Women and men · all residents
51% women, 49% men
WomenEnglandMen
About an even split. Across England, 51% of residents are women.
East Morton has fewer than 2,500 residents, so it gets subject grades but no overall grade. People: Census 2021. Miles: centre to centre.
Questions about Burley in Wharfedale
Are schools in Burley in Wharfedale good?
Among the strongest in England: GCSE results beat 92% of towns in England, and primary results beat 98% (Department for Education, Attainment 8 and Key Stage 2). Burley in Wharfedale has 2 state schools; places are handled by Bradford council.
How many listed buildings are there in Burley in Wharfedale?
That is 2.5 times the typical UK town for its size. Its Grade I building is Burley House.
Is Burley in Wharfedale expensive to live in?
Homes cost more than in most UK towns: the median sale over three years was £415,000, against £277,000 in the typical UK town. By type: flats £258,000, terraced houses £310,000, semi-detached houses £426,498 and detached houses £538,500.
About Burley in Wharfedale
Town in West Yorkshire, England
Burley in Wharfedale is a built-up area of 6,806 people, in the Bradford council area. TownRatings uses ONS’s 2022 built-up areas as towns: the physical town, as people mean the word, rather than a council district, so its figures cover the town itself.
Built from ONS geography and Census 2021
Population
6,806 (Census 2021)
Council
Bradford
County
West Yorkshire
Region
Yorkshire and The Humber
Area
0.7 sq mi (1.8 km²)
ONS code
E63000657
Sources: ONS Census 2021, output areas summed to the ONS 2022 built-up area · HM Land Registry Price Paid (standard sales, September 2023 to August 2026) · ONS Price Index of Private Rents (August 2026, by council) · MHCLG and Welsh Government council tax, Band D 2026–27 (with parish precepts in England) · data.police.uk street-level crime, 36 months to August 2026, points inside the built-up-area boundary · ONS small-area life expectancy and healthy life expectancy, 2019 to 2023 (England and Wales), OHID Fingertips small-area indicators (England) and Census 2021 health, adjusted for age · ONS small-area income estimates (financial year ending 2023) · DWP claimant count via Nomis (January to August 2026) · Historic England, National Heritage List for England (listed buildings, scheduled monuments, registered parks and gardens, battlefields, World Heritage Sites), October 2026, inside the ONS 2022 built-up-area boundary · Valuation Office Agency, Council Tax: stock of properties by build period (31 March 2025) · TownRatings grades: our own summary of the data, ranked against UK towns only. All under the Open Government Licence v3.0.