Guest, Sign inJoin
Loomis Historic DistrictMerriam, #1 on this list · Loomis Historic District · Photo: Dlong417 · CC BY-SA 3.0
Kansas rankings · Hazard risk

Towns with the lowest natural-hazard risk in Kansas

Merriam ranks first on hazard risk among Kansas’ 151 towns of 2,500+; 12 of the 151 grade A− or better on hazard risk nationally.

The Hazard risk grade: FEMA’s expected yearly loss to buildings from natural hazards, where residents live (National Risk Index). How grades work

#1

Merriam

Johnson County · 11,509 people
A

Hazard risk grade, better than 85% of U.S. towns·Overall B+ · #56 of 150 in KS

#3

Hugoton

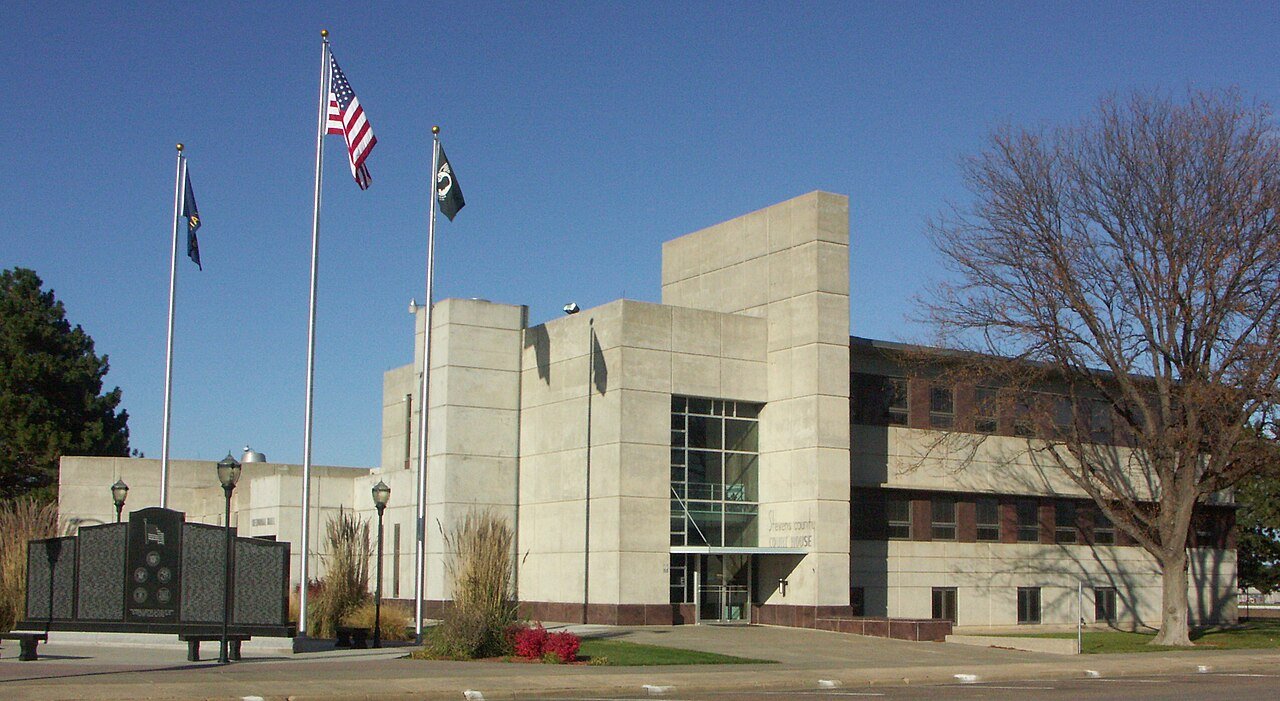
Stevens County · 3,545 people
A−

Hazard risk grade, better than 84% of U.S. towns·Overall C · #106 of 150 in KS

All 151 towns

Hazard risk grade, best first (the letter is national). Towns with the same score share a rank (T = tied; 4 towns here); the overall grade and state rank are beside each.

151 towns ranked. Not here? See why a town may be missing.

#TownGradeOverall
1MerriamJohnson County · 11,509 peopleAbetter than 85% of U.S. towns·Overall B+ · #56 of 150
2MissionJohnson County · 10,125 peopleA−better than 84% of U.S. towns·Overall B · #66 of 150
3HugotonStevens County · 3,545 peopleA−better than 84% of U.S. towns·Overall C · #106 of 150
4Fort Rileyunincorporated, Geary County · 8,606 peopleA−better than 83% of U.S. towns·Overall C · #115 of 150
5ColbyThomas County · 5,489 peopleA−better than 82% of U.S. towns·Overall B+ · #42 of 150
6Madison TownshipRiley County · 9,403 peopleA−better than 82% of U.S. towns·No overall grade
7Roeland ParkJohnson County · 6,683 peopleA−better than 80% of U.S. towns·Overall B+ · #46 of 150
8LeavenworthLeavenworth County · 37,012 peopleA−better than 80% of U.S. towns·Overall B− · #84 of 150
9Williamsport TownshipShawnee County · 4,334 peopleA−better than 79% of U.S. towns·Overall B− · #81 of 150
10UlyssesGrant County · 5,524 peopleA−better than 79% of U.S. towns·Overall A− · #38 of 150
11HiawathaBrown County · 3,124 peopleA−better than 79% of U.S. towns·Overall C+ · #93 of 150
12LiberalSeward County · 19,010 peopleA−better than 78% of U.S. towns·Overall C− · #135 of 150
13LenexaJohnson County · 60,506 peopleB+better than 74% of U.S. towns·Overall A− · #23 of 150
14Kansas CityWyandotte County · 157,805 peopleB+better than 74% of U.S. towns·Overall D · #146 of 150
15ShawneeJohnson County · 69,848 peopleB+better than 73% of U.S. towns·Overall A− · #26 of 150
16LeawoodJohnson County · 34,093 peopleB+better than 72% of U.S. towns·Overall A− · #20 of 150
17Gardner TownshipJohnson County · 2,550 peopleB+better than 71% of U.S. towns·Overall B+ · #44 of 150
18Prairie VillageJohnson County · 23,008 peopleB+better than 71% of U.S. towns·Overall A · #13 of 150
19Baldwin CityDouglas County · 4,946 peopleB+better than 70% of U.S. towns·Overall A− · #19 of 150
20Overland ParkJohnson County · 203,677 peopleB+better than 69% of U.S. towns·Overall A− · #34 of 150
21Palmyra TownshipDouglas County · 7,847 peopleB+better than 68% of U.S. towns·Overall A− · #30 of 150
22GardnerJohnson County · 26,154 peopleB+better than 68% of U.S. towns·Overall B+ · #51 of 150
23Tecumseh TownshipShawnee County · 7,829 peopleB+better than 67% of U.S. towns·Overall B+ · #43 of 150
24Mission HillsJohnson County · 3,522 peopleB+better than 66% of U.S. towns·Overall A− · #17 of 150
25ClearwaterSedgwick County · 2,792 peopleB+better than 66% of U.S. towns·Overall A · #7 of 150
26OlatheJohnson County · 150,025 peopleB+better than 65% of U.S. towns·Overall A− · #18 of 150
27GoddardSedgwick County · 6,638 peopleB+better than 65% of U.S. towns·Overall A− · #36 of 150
28Spring HillJohnson County · 10,777 peopleB+better than 65% of U.S. towns·Overall A− · #29 of 150
29Ninnescah TownshipSedgwick County · 3,563 peopleBbetter than 65% of U.S. towns·Overall A− · #28 of 150
30Great BendBarton County · 14,266 peopleBbetter than 64% of U.S. towns·Overall C− · #120 of 150
31Scott CityScott County · 3,855 peopleBbetter than 64% of U.S. towns·Overall B+ · #50 of 150
32LawrenceDouglas County · 96,367 peopleBbetter than 64% of U.S. towns·Overall B− · #77 of 150
33Morton TownshipSedgwick County · 2,819 peopleBbetter than 64% of U.S. towns·Overall A+ · #1 of 150
34Aubry TownshipJohnson County · 4,719 peopleBbetter than 63% of U.S. towns·Overall A+ · #2 of 150
35South HutchinsonReno County · 2,516 peopleBbetter than 61% of U.S. towns·Overall C · #102 of 150
T36St. MarysPottawatomie County · 2,790 peopleBbetter than 61% of U.S. towns·Overall B+ · #54 of 150
T36St. Marys TownshipPottawatomie County · 4,018 peopleBbetter than 61% of U.S. towns·Overall B · #60 of 150
38HaysEllis County · 21,258 peopleBbetter than 61% of U.S. towns·Overall B+ · #57 of 150
39Dodge CityFord County · 27,653 peopleBbetter than 60% of U.S. towns·Overall C− · #124 of 150
40LouisburgMiami County · 5,299 peopleBbetter than 60% of U.S. towns·Overall A− · #33 of 150
41Bel AireSedgwick County · 10,287 peopleBbetter than 60% of U.S. towns·Overall C+ · #97 of 150
42LansingLeavenworth County · 11,331 peopleBbetter than 59% of U.S. towns·Overall A− · #31 of 150
43BasehorLeavenworth County · 8,249 peopleBbetter than 59% of U.S. towns·Overall B+ · #45 of 150
44McPhersonMcPherson County · 13,918 peopleBbetter than 59% of U.S. towns·Overall B · #71 of 150
45Union TownshipSedgwick County · 2,704 peopleBbetter than 58% of U.S. towns·Overall A · #12 of 150
46MaizeSedgwick County · 7,853 peopleBbetter than 58% of U.S. towns·Overall B · #65 of 150
47Park TownshipSedgwick County · 8,984 peopleBbetter than 58% of U.S. towns·Overall B+ · #48 of 150
48EmporiaLyon County · 24,137 peopleBbetter than 58% of U.S. towns·Overall C− · #131 of 150
49MulvaneSedgwick County · 7,030 peopleBbetter than 57% of U.S. towns·Overall B+ · #49 of 150
50MarysvilleMarshall County · 3,385 peopleBbetter than 57% of U.S. towns·Overall B− · #80 of 150
51Fairmount TownshipLeavenworth County · 12,817 peopleBbetter than 56% of U.S. towns·Overall B+ · #47 of 150
52WamegoPottawatomie County · 4,912 peopleB−better than 55% of U.S. towns·Overall A · #6 of 150
53HoisingtonBarton County · 2,598 peopleB−better than 55% of U.S. towns·Overall B− · #79 of 150
54RussellRussell County · 4,286 peopleB−better than 55% of U.S. towns·Overall C− · #137 of 150
55Wamego TownshipPottawatomie County · 5,838 peopleB−better than 55% of U.S. towns·Overall A+ · #3 of 150
56AbileneDickinson County · 6,552 peopleB−better than 54% of U.S. towns·Overall B · #61 of 150
57GoodlandSherman County · 4,366 peopleB−better than 54% of U.S. towns·Overall C− · #123 of 150
58FairwayJohnson County · 4,181 peopleB−better than 53% of U.S. towns·Overall A · #11 of 150
59Sherlock TownshipFinney County · 2,907 peopleB−better than 52% of U.S. towns·Overall C− · #130 of 150
60GalenaCherokee County · 2,788 peopleB−better than 52% of U.S. towns·Overall C · #114 of 150
61Sherman TownshipLeavenworth County · 2,920 peopleB−better than 52% of U.S. towns·Overall A · #10 of 150
62Washington TownshipDoniphan County · 2,966 peopleB−better than 52% of U.S. towns·Overall A− · #27 of 150
63Osage CityOsage County · 2,784 peopleB−better than 52% of U.S. towns·Overall C+ · #91 of 150
64AtchisonAtchison County · 10,789 peopleB−better than 51% of U.S. towns·Overall C+ · #100 of 150
65Attica TownshipSedgwick County · 9,068 peopleB−better than 50% of U.S. towns·Overall A− · #39 of 150
66ColumbusCherokee County · 2,866 peopleB−better than 50% of U.S. towns·Overall C− · #119 of 150
67Soldier TownshipShawnee County · 15,282 peopleB−better than 50% of U.S. towns·Overall B+ · #52 of 150
68NewtonHarvey County · 18,353 peopleB−better than 50% of U.S. towns·Overall C− · #133 of 150
69Junction CityGeary County · 22,583 peopleB−better than 50% of U.S. towns·Overall D · #142 of 150
70Lincoln TownshipLinn County · 2,730 peopleB−better than 48% of U.S. towns·Overall B− · #78 of 150
71Monmouth TownshipShawnee County · 3,224 peopleB−better than 48% of U.S. towns·Overall B+ · #55 of 150
72PaolaMiami County · 5,880 peopleB−better than 48% of U.S. towns·Overall B · #74 of 150
73Garden CityFinney County · 27,402 peopleB−better than 47% of U.S. towns·Overall D · #140 of 150
74SalinaSaline County · 46,094 peopleB−better than 46% of U.S. towns·Overall C− · #134 of 150
75Grant TownshipSedgwick County · 5,743 peopleB−better than 46% of U.S. towns·Overall A · #8 of 150
76Valley Center TownshipSedgwick County · 5,036 peopleB−better than 46% of U.S. towns·Overall A− · #35 of 150
77ConcordiaCloud County · 4,991 peopleB−better than 46% of U.S. towns·Overall C+ · #96 of 150
78Eudora TownshipDouglas County · 7,870 peopleB−better than 46% of U.S. towns·Overall B · #59 of 150
79EudoraDouglas County · 6,506 peopleB−better than 46% of U.S. towns·Overall A− · #32 of 150
80Garden City TownshipFinney County · 5,667 peopleB−better than 45% of U.S. towns·Overall D · #148 of 150
81ManhattanRiley County · 54,673 peopleC+better than 45% of U.S. towns·Overall B · #73 of 150
82Big Creek TownshipEllis County · 2,622 peopleC+better than 44% of U.S. towns·Overall A− · #21 of 150
83GarnettAnderson County · 3,242 peopleC+better than 44% of U.S. towns·Overall C+ · #90 of 150
84St. George TownshipPottawatomie County · 5,056 peopleC+better than 43% of U.S. towns·Overall C− · #128 of 150
85Valley CenterSedgwick County · 7,685 peopleC+better than 43% of U.S. towns·Overall A · #14 of 150
86Stranger TownshipLeavenworth County · 5,467 peopleC+better than 42% of U.S. towns·Overall C+ · #89 of 150
87Blue TownshipPottawatomie County · 5,449 peopleC+better than 42% of U.S. towns·Overall C+ · #94 of 150
88Mission TownshipShawnee County · 10,195 peopleC+better than 41% of U.S. towns·Overall B+ · #53 of 150
89HoltonJackson County · 3,396 peopleC+better than 41% of U.S. towns·Overall B · #69 of 150
T90Emma TownshipHarvey County · 4,017 peopleC+better than 41% of U.S. towns·Overall A · #9 of 150
T90HesstonHarvey County · 3,458 peopleC+better than 41% of U.S. towns·Overall A · #4 of 150
92Gypsum TownshipSedgwick County · 10,370 peopleC+better than 41% of U.S. towns·Overall C+ · #92 of 150
93De SotoJohnson County · 7,083 peopleC+better than 41% of U.S. towns·Overall A− · #22 of 150
94WichitaSedgwick County · 400,987 peopleC+better than 40% of U.S. towns·Overall D · #149 of 150
95HillsboroMarion County · 2,646 peopleC+better than 40% of U.S. towns·Overall A · #15 of 150
96OsawatomieMiami County · 4,215 peopleC+better than 40% of U.S. towns·Overall C · #111 of 150
97Kechi TownshipSedgwick County · 10,931 peopleC+better than 40% of U.S. towns·Overall C+ · #98 of 150
98Clay CenterClay County · 4,061 peopleC+better than 40% of U.S. towns·Overall C+ · #99 of 150
99EllsworthEllsworth County · 3,092 peopleC+better than 40% of U.S. towns·Overall A · #16 of 150
100TonganoxieLeavenworth County · 6,208 peopleC+better than 39% of U.S. towns·Overall B · #64 of 150
101Bonner SpringsWyandotte County · 7,962 peopleC+better than 39% of U.S. towns·Overall C · #116 of 150
102AugustaButler County · 9,073 peopleC+better than 38% of U.S. towns·Overall C− · #125 of 150
103Washington TownshipCrawford County · 3,543 peopleC+better than 38% of U.S. towns·Overall C · #112 of 150
104WinfieldCowley County · 11,745 peopleC+better than 38% of U.S. towns·Overall D · #147 of 150
105EdwardsvilleWyandotte County · 4,748 peopleC+better than 37% of U.S. towns·Overall D · #139 of 150
106Arkansas CityCowley County · 11,800 peopleC+better than 37% of U.S. towns·Overall D− · #150 of 150
107Rose HillButler County · 4,320 peopleC+better than 37% of U.S. towns·Overall A− · #24 of 150
108PrattPratt County · 6,574 peopleC+better than 37% of U.S. towns·Overall B · #62 of 150
109Park CitySedgwick County · 9,458 peopleC+better than 37% of U.S. towns·Overall C− · #121 of 150
110TopekaShawnee County · 125,795 peopleC+better than 37% of U.S. towns·Overall C− · #136 of 150
111Franklin TownshipFranklin County · 3,179 peopleC+better than 37% of U.S. towns·Overall B · #68 of 150
112LyonsRice County · 3,488 peopleCbetter than 34% of U.S. towns·Overall C+ · #101 of 150
113Reno TownshipReno County · 4,360 peopleCbetter than 34% of U.S. towns·Overall C · #104 of 150
114Rock Creek TownshipJefferson County · 2,773 peopleCbetter than 33% of U.S. towns·Overall B+ · #40 of 150
115Richland TownshipButler County · 2,620 peopleCbetter than 32% of U.S. towns·Overall B · #58 of 150
116FrontenacCrawford County · 3,443 peopleCbetter than 32% of U.S. towns·Overall B · #63 of 150
117BeloitMitchell County · 3,288 peopleCbetter than 32% of U.S. towns·Overall B · #75 of 150
118LindsborgMcPherson County · 3,824 peopleCbetter than 32% of U.S. towns·Overall A · #5 of 150
119ParsonsLabette County · 9,315 peopleCbetter than 31% of U.S. towns·Overall C · #108 of 150
120Rockford TownshipSedgwick County · 24,796 peopleCbetter than 31% of U.S. towns·Overall B · #72 of 150
121WellingtonSumner County · 7,541 peopleCbetter than 31% of U.S. towns·Overall D · #138 of 150
122Belle Plaine TownshipSumner County · 3,025 peopleCbetter than 30% of U.S. towns·Overall B · #70 of 150
123Auburn TownshipShawnee County · 3,319 peopleCbetter than 30% of U.S. towns·Overall A− · #37 of 150
124ChanuteNeosho County · 8,584 peopleCbetter than 29% of U.S. towns·Overall C− · #129 of 150
125AndoverButler County · 17,370 peopleCbetter than 29% of U.S. towns·Overall A− · #25 of 150
126LarnedPawnee County · 3,596 peopleCbetter than 29% of U.S. towns·Overall C− · #118 of 150
127CoffeyvilleMontgomery County · 8,460 peopleCbetter than 28% of U.S. towns·Overall D · #144 of 150
128Smoky Hill TownshipGeary County · 9,191 peopleCbetter than 28% of U.S. towns·Overall D · #141 of 150
129El DoradoButler County · 12,696 peopleCbetter than 27% of U.S. towns·Overall B− · #87 of 150
130IolaAllen County · 5,240 peopleCbetter than 27% of U.S. towns·Overall C · #113 of 150
131NortonNorton County · 2,651 peopleCbetter than 27% of U.S. towns·Overall B− · #76 of 150
132DerbySedgwick County · 26,606 peopleCbetter than 26% of U.S. towns·Overall B− · #85 of 150
133PittsburgCrawford County · 20,569 peopleC−better than 25% of U.S. towns·Overall D · #143 of 150
134Bruno TownshipButler County · 19,221 peopleC−better than 24% of U.S. towns·Overall B+ · #41 of 150
135Garden TownshipCherokee County · 2,713 peopleC−better than 24% of U.S. towns·Overall C− · #127 of 150
136Minneha TownshipSedgwick County · 3,472 peopleC−better than 23% of U.S. towns·Overall C+ · #95 of 150
137OttawaFranklin County · 12,716 peopleC−better than 23% of U.S. towns·Overall C+ · #88 of 150
138Towanda TownshipButler County · 2,574 peopleC−better than 22% of U.S. towns·Overall B− · #82 of 150
139KingmanKingman County · 2,884 peopleC−better than 22% of U.S. towns·Overall C · #105 of 150
140IndependenceMontgomery County · 8,193 peopleC−better than 21% of U.S. towns·Overall C · #107 of 150
141Fort ScottBourbon County · 7,500 peopleC−better than 19% of U.S. towns·Overall C− · #122 of 150
142HutchinsonReno County · 39,595 peopleC−better than 19% of U.S. towns·Overall D · #145 of 150
143Prospect TownshipButler County · 2,548 peopleC−better than 19% of U.S. towns·Overall C− · #132 of 150
144Baxter SpringsCherokee County · 3,823 peopleC−better than 18% of U.S. towns·Overall C− · #117 of 150
145Pleasant TownshipButler County · 5,459 peopleC−better than 16% of U.S. towns·Overall B · #67 of 150
146Baker TownshipCrawford County · 3,483 peopleDbetter than 14% of U.S. towns·Overall C− · #126 of 150
147Riverside TownshipSedgwick County · 13,603 peopleDbetter than 14% of U.S. towns·Overall C · #109 of 150
148Salem TownshipSedgwick County · 9,673 peopleDbetter than 13% of U.S. towns·Overall B− · #83 of 150
149Oaklawn-Sunviewunincorporated, Sedgwick County · 2,789 peopleDbetter than 12% of U.S. towns·Overall B− · #86 of 150
150HaysvilleSedgwick County · 11,353 peopleDbetter than 12% of U.S. towns·Overall C · #110 of 150
151BurlingtonCoffey County · 2,640 peopleDbetter than 11% of U.S. towns·Overall C · #103 of 150
Quick answers

Questions people ask

Which Kansas town has the lowest natural-hazard risk?

Merriam (Johnson County) ranks first on hazard risk among 151 towns, with an A; Mission and Hugoton follow.

How are these towns ranked?

The Hazard risk grade: FEMA’s expected yearly loss to buildings from natural hazards, where residents live (National Risk Index). Towns are sorted on the grade’s score; the letter and rank are the same as on each town’s page. How grades work.

Why isn’t my town on this list?

The list covers towns of 2,500+ residents with a hazard risk grade (151 in Kansas). Smaller towns have the grade on their page but no rank. Every town is on the Kansas page.

Go deeper

More Kansas lists

Every list ranks the same 2,500+ towns, so a town’s rank means the same thing on each.

All Kansas rankings →
Other states

Towns with the lowest natural-hazard risk in other states