Sherman TownshipKS
Public schools that outperform most of Kansas. 2,920 people call this town in Kansas home.
What should you know before moving to Sherman Township?
Where it does best is incomes: the median household earns $127K. What holds it back is walkability. Most errands need a car: it is less walkable than 97% of U.S. towns. Homes run about $410K for a typical one, 4.9 times the Kansas City metro’s $83K median household income. The overall grade comes out at A, better than 88% of U.S. towns. It ranks 10th of 150 in Kansas. On the outdoors, just 31 of Kansas’ 373 towns do worse. Senator William A. Harris House is on the National Register of Historic Places.
Figures: incomes, Census ACS, 2020–24 · home values, Zillow · USGS PAD-US · National Register of Historic Places.
What makes Sherman Township stand out
Where Sherman Township beats most towns.
97% of working residents leave Sherman Township for work
Where Sherman Township’s working residents go each day. Line width shows the share.
Census LEHD 2023
How Sherman Township grades
Each subject compared with towns across the country (schools within Kansas), ordered by how far Sherman Township is from typical.
How TownRatings grades towns →
Moving to Sherman Township: who provides what
Who provides power, water and the rest in Sherman Township, and how to reach them.
EPA SDWIS (Oct 9, 2026) · HIFLD + EIA-861 2025 · Census 2020 ZCTAs · NCES 2024–25 · registration: vote.gov, updated Nov 18, 2024.
The data
Ordered by what stands out in Sherman Township.
Sherman Township has schools in the top 5% of Kansas and has hotter summers than most of the country, though not than most of Kansas; it also has little public open land.
On state tests, Sherman Township’s schools beat 91% of Kansas districts
Its A ranks #8 of the 151 Kansas towns we grade for schools.
The Basehor-Linwood school district runs its public schools. Its one school is below. 248 students attend Sherman Township’s public school.
| School | Level | Students | Letter |
|---|---|---|---|
| Linwood Elementary SchoolLargest public elementary schoolGrades PK–5 | Grades PK–5 | 248 | A |
NCES · EDFacts · graded within KS on state tests and graduation
Most working residents commute out of Sherman Township
Sherman Township has 345 jobs for its 1,421 working residents: even if every job went to a resident, most would still commute out.
Since 2013, Sherman Township has added 178 jobs, to 345 in 2023. Commuting out is the norm here: 3% of working residents work locally. The share of residents in Sherman Township who live below the poverty line: 3.1%. Its average commute is 27 minutes, where Kansas’ towns sit at 20 minutes and U.S. towns at 25 minutes.
| Sherman Township | Kansas towns | U.S. towns | |
|---|---|---|---|
| Median household income | $127,000 | $73,000 | $80,000 |
| Below the poverty line | 3.1% | 9.2% | 9.6% |
| Average trip to work | 27 minutes | 20 minutes | 25 minutes |
| Working residents who work in town | 3.3% | 15% | 8% |
Where working residents work
Census LEHD 2023 · ACS
Residents of Sherman Township are healthier than two in three U.S. towns
Against the 4,844 U.S. towns with household incomes like Sherman Township’s, it is less healthy than 74%: its national edge comes with its incomes.
Just over a tenth of Sherman Township adults report frequent physical distress. Of 32 CDC measures, Sherman Township beats the Kansas average on 8 and trails it on 1. Among adults here, 29% feel lonely, against 31% in Kansas’ towns and 33% across U.S. towns. In Sherman Township, 16% of adults report frequent mental distress, and 9.7% worry about having enough food.
| Sherman Township | Kansas towns | U.S. towns | |
|---|---|---|---|
| Feel lonely (CDC PLACES) | 29% | 31% | 33% |
| Frequent mental distress (CDC PLACES) | 16% | 17% | 17% |
| Food insecurity (CDC PLACES) | 9.7% | 13% | 14% |
| Frequent physical distress (CDC PLACES) | 12% | 13% | 14% |
| What stands out | Sherman Township | KS |
|---|---|---|
| Fewer adults facing food insecurity | 9.7% | 13% |
| Fewer uninsured adults | 7.7% | 9.9% |
| More adults who have had cancer | 9.1% | 8.1% |
CDC PLACES 2025 · modeled estimates for adults · CMS · HRSA
Sherman Township: four seasons and hot summers
July afternoons average 89.1°: hotter than most of the country, but cooler than 87% of Kansas places with climate records; January nights average 20.1°.
About 12 inches of snow falls in a winter. The town’s July high stands at 89°F.
| Sherman Township | Kansas towns | U.S. towns | |
|---|---|---|---|
| July high | 89°F | 91°F | 85°F |
| January low | 20°F | 21°F | 22°F |
Typical low → high °F
NOAA U.S. Climate Normals, 1991–2020
Sherman Township skews older than Kansas
The median household earns $127,159, against $74,275 across Kansas, one input to its A+ for jobs and income.
Sherman Township has grown 4.6% since 2020, to 2,920 residents in the Census Bureau’s 2025 estimate. People 65 and older are 22% of residents (17% statewide). Two in five adults 25 and older hold a bachelor’s degree or more here.
| Sherman Township | Kansas towns | U.S. towns | |
|---|---|---|---|
| Bachelor’s degree or more, 25+ | 40% | 29% | 29% |
| Under 18 | 20% | 24% | 22% |
| Median age | 42.1 years | 38.1 years | 40.5 years |
Ages · share of residents
Education · adults 25 and older
Women and men · all residents
47% women, 53% men
That’s an even split within the survey’s margin of ±4 points. Across Kansas, 49.8% of residents are women. Among residents 65 to 74, 71% are men (KS 48%).
| Sherman Township | KS | U.S. | |
|---|---|---|---|
| Under 10 | 10.5% | 12.5% | 11.6% |
| 10 to 17 | 9.6% | 11.3% | 10.3% |
| 18 to 24 | 13.5% | 10.2% | 9.1% |
| 25 to 34 | 8.9% | 12.9% | 13.7% |
| 35 to 44 | 11.9% | 12.9% | 13.2% |
| 45 to 54 | 11% | 11.2% | 12.2% |
| 55 to 64 | 12.7% | 12.2% | 12.7% |
| 65 to 74 | 15.7% | 10.1% | 10.2% |
| 75 and older | 6.1% | 6.9% | 7% |
| No diploma | 4.4% | 8% | 10.4% |
| High school | 24.9% | 25.4% | 26% |
| Some college | 21% | 21.8% | 19.1% |
| Associate’s | 9.7% | 9.1% | 8.8% |
| Bachelor’s | 20.1% | 22.2% | 21.6% |
| Graduate | 20% | 13.4% | 14.1% |
Census population estimates, 2025 · U.S. Census Bureau · ACS 2020-2024 5-year estimates · in a town of 2,900, single groups can be off by several points
The biggest natural risk in Sherman Township is inland flooding, at a moderate overall level
Expected losses in Sherman Township break down as 44% from inland flooding and 20% from tornadoes. The natural-hazard score from FEMA for Sherman Township comes to 45 of 100.
FEMA National Risk Index · OpenFEMA
0% of Sherman Township is conserved land
Just 0 of its 27,111 acres are conserved, so there is little public open land in Sherman Township itself; its outdoors grade is D−.
1.2 miles of trail.
Trails & parks © OpenStreetMap contributors · Conserved land: USGS PAD-US
Arrowhead Stadium and 42 more within 40 miles
Museums, parks, gardens and other places to visit around Sherman Township. Close and well known come first.
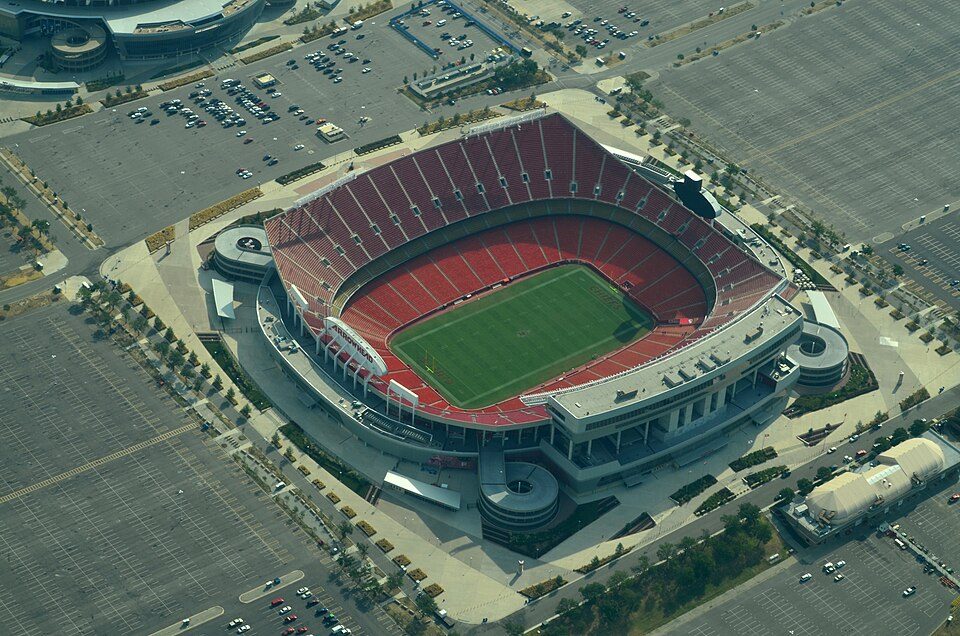 Big draw27 mi Stadium & arenaArrowhead Stadium
 27 mi Stadium & arenaKauffman Stadium
 29 mi Park & preserveSubTropolis
 12 mi Stadium & arenaSporting Park
 24 mi Stadium & arenaCPKC Stadium
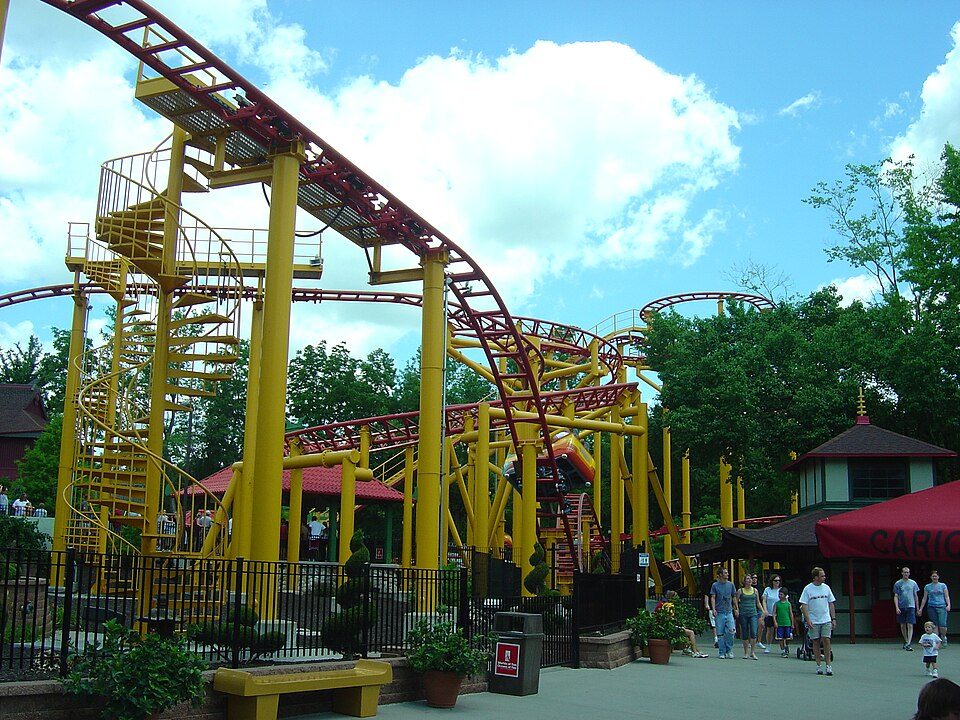 29 mi Theme parkWorlds of Fun
Photo credits
Arrowhead Stadium: Ichabod, CC BY-SA 3.0 · Kauffman Stadium: Mysteryman28, Public domain · SubTropolis: ErgoSum88, Public domain · Sporting Park: Lectrician2, CC BY-SA 4.0 · CPKC Stadium: elisfkc2, CC BY-SA 2.0 · Worlds of Fun: Tkexb173 at en.wikipedia, CC BY-SA 3.0


Everything we know about Sherman Township
Colleges nearby
4 within 15 miles of the center of Sherman Township
About 7 of every 100 Sherman Township residents are enrolled in college, about the same as Kansas.
About Sherman Township
Township in Kansas, United States
Sherman Township is one of ten townships in Leavenworth County, Kansas, United States. As of the 2020 census, its population was 2,792. Sherman contains two cities, Linwood and De Soto.
From Wikipedia, licensed CC BY-SA 4.0 · facts via Wikidata (CC0)
- Area
- 41 sq mi
- Elevation
- 951 ft
Sherman Township’s neighbors
6 towns share a border with Sherman Township.
At #10 in KS, it grades higher overall than all 4 graded towns on its borders; De Soto (A−) comes closest.
| Town | KS rank | Overall | Cost | Safety | Schools | Health |
|---|---|---|---|---|---|---|
| Sherman Township | #10 | A | B | — | A | B+ |
| Lexington Township | — | — | C | — | A | A− |
| Stranger Township | #89 | C+ | D | — | A | B+ |
| Reno Township | — | — | D− | — | B | B+ |
| Fairmount Township | #47 | B+ | C | — | A | B+ |
| Eudora Township | #59 | B | C− | — | B+ | B+ |
| De Soto | #22 | A− | C | — | A | A− |
Lexington Township and Reno Township have fewer than 2,500 residents, so they get subject grades but no overall grade. Sherman Township, Lexington Township, Stranger Township, Reno Township, Fairmount Township, Eudora Township and De Soto report no FBI crime data of their own. Compare Sherman Township with a neighbor →
Questions about Sherman Township
Short answers, built from the data on this page.
Is Sherman Township, KS a good place to live?
By most measures, yes. Sherman Township grades A overall, better than 88% of U.S. towns and #10 of 150 in Kansas. It grades B+ for health and A for schools. Walkability is its weak spot, with a D−.
Is Sherman Township, KS expensive?
Cost of living, which also weighs rents, property taxes and how many households pay 30% or more of their income for housing, grades B.