Guest, Sign inJoin
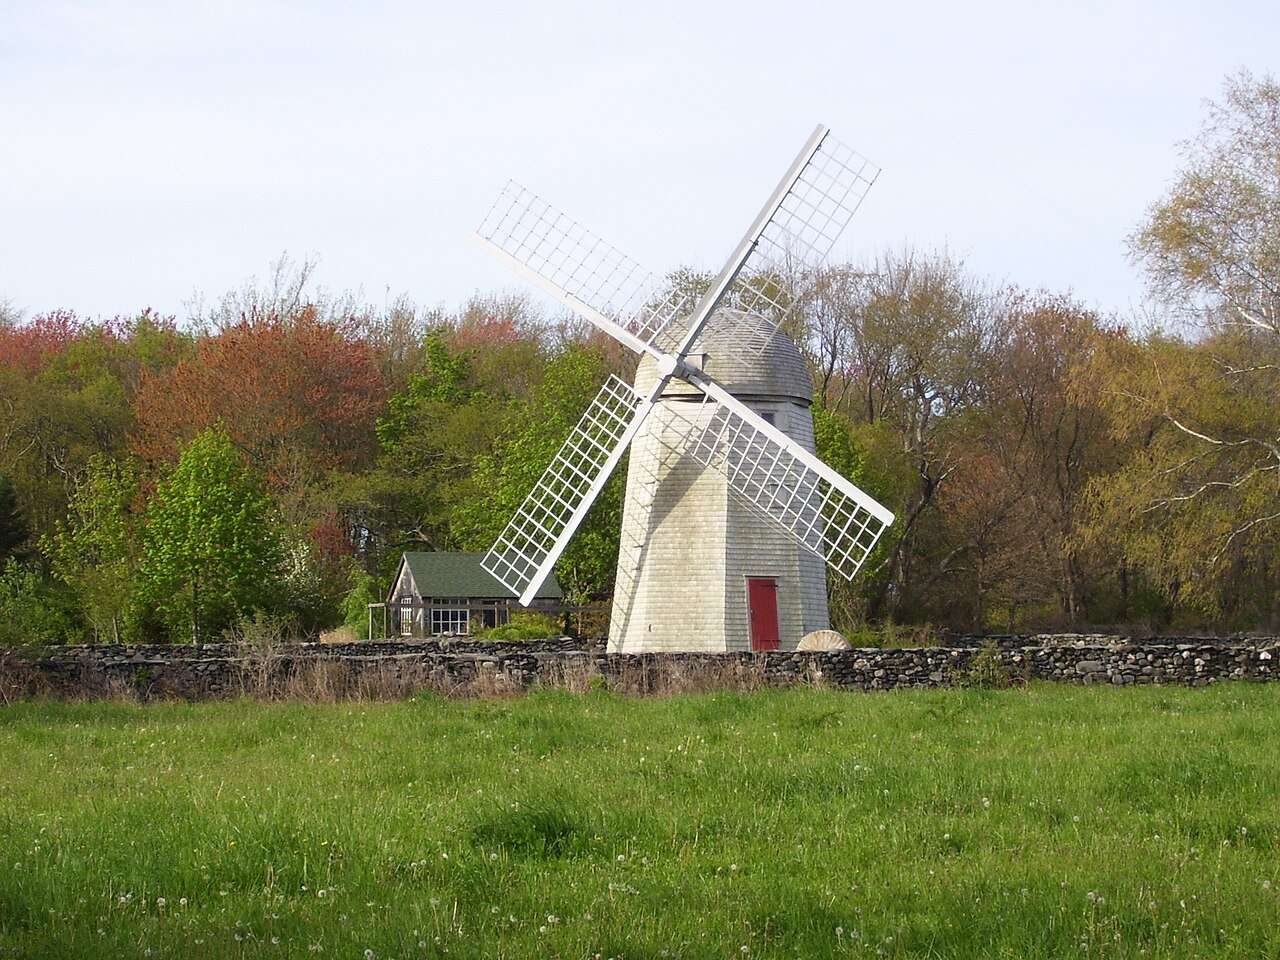
Jamestown WindmillJamestown, #1 on this list · Photo: Swampyank at English Wikipedia · CC BY 3.0
Rhode Island rankings · Hazard risk

Towns with the lowest natural-hazard risk in Rhode Island

Jamestown ranks first on hazard risk among Rhode Island’s 38 towns of 2,500+; 20 of the 38 grade A− or better on hazard risk nationally.

The Hazard risk grade: FEMA’s expected yearly loss to buildings from natural hazards, where residents live (National Risk Index). How grades work

#1

Jamestown

Newport County · 5,480 people
A+

Hazard risk grade, among the top in the U.S.·Overall A+ · #2 of 38 in RI
#2

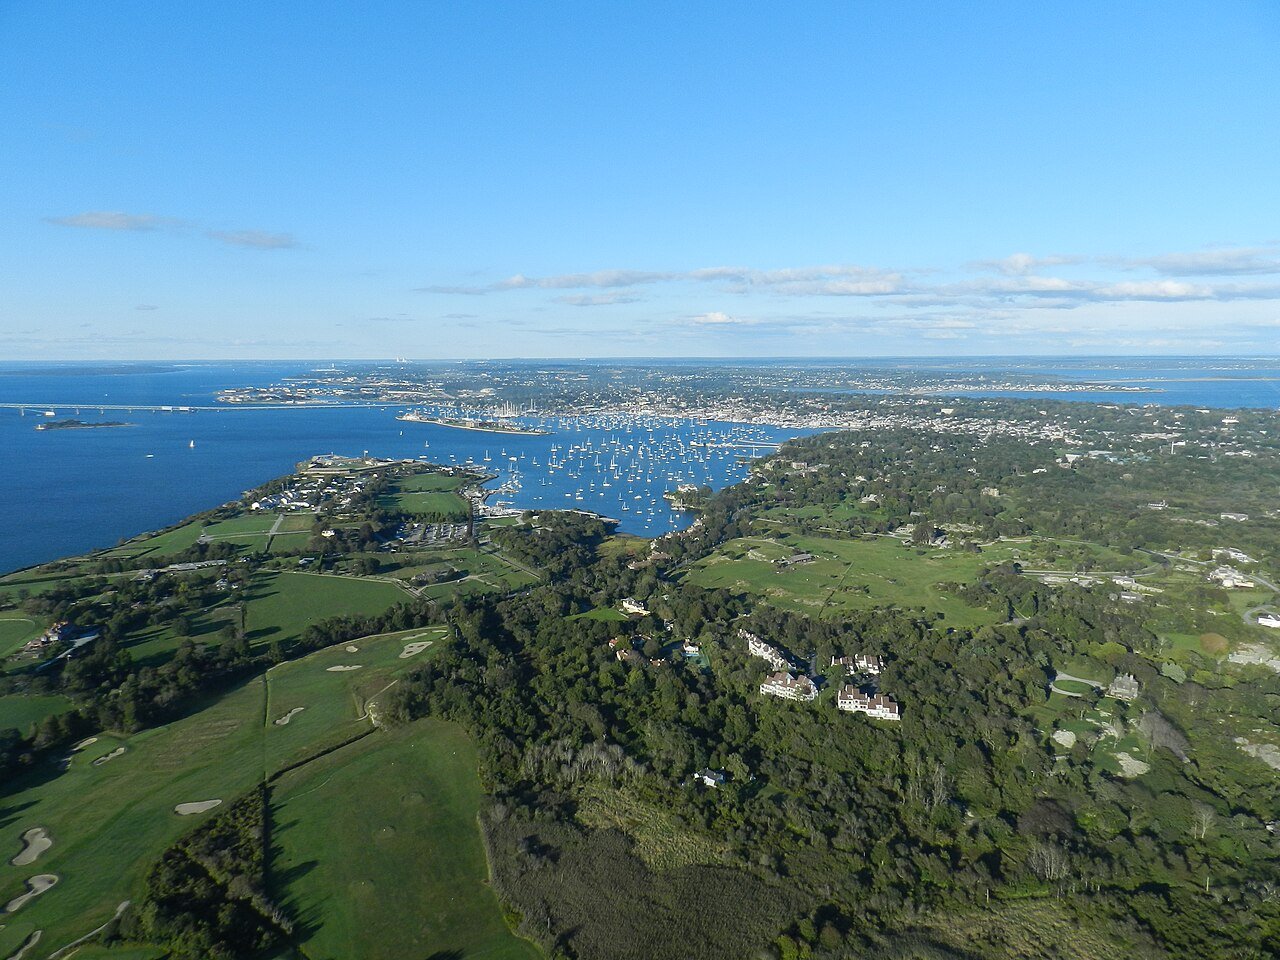
Newport

Newport County · 24,251 people
A+

Hazard risk grade, among the top in the U.S.·Overall C · #34 of 38 in RI

#3

Bristol

Bristol County · 21,970 people
A+

Hazard risk grade, among the top in the U.S.·Overall A · #6 of 38 in RI

All 38 towns

Hazard risk grade, best first (the letter is national). Towns with the same score share a rank; the overall grade and state rank are beside each.

38 towns ranked. Not here? See why a town may be missing.

#TownGradeOverall
1JamestownNewport County · 5,480 peopleA+among the top in the U.S.·Overall A+ · #2 of 38
2NewportNewport County · 24,251 peopleA+among the top in the U.S.·Overall C · #34 of 38
3BristolBristol County · 21,970 peopleA+among the top in the U.S.·Overall A · #6 of 38
4MiddletownNewport County · 16,502 peopleA+better than 98% of U.S. towns·Overall B+ · #24 of 38
5PortsmouthNewport County · 17,474 peopleA+better than 97% of U.S. towns·Overall A+ · #5 of 38
6Little ComptonNewport County · 3,535 peopleAbetter than 93% of U.S. towns·Overall A+ · #4 of 38
7West GreenwichKent County · 6,750 peopleAbetter than 92% of U.S. towns·Overall A− · #21 of 38
8East ProvidenceProvidence County · 48,249 peopleAbetter than 90% of U.S. towns·Overall C+ · #32 of 38
9WarrenBristol County · 11,070 peopleAbetter than 88% of U.S. towns·Overall B+ · #23 of 38
10ExeterWashington County · 6,540 peopleAbetter than 86% of U.S. towns·Overall A− · #18 of 38
11TivertonNewport County · 15,809 peopleAbetter than 86% of U.S. towns·Overall A · #11 of 38
12GlocesterProvidence County · 10,612 peopleAbetter than 85% of U.S. towns·Overall A · #14 of 38
13North KingstownWashington County · 27,885 peopleA−better than 83% of U.S. towns·Overall A · #7 of 38
14FosterProvidence County · 4,628 peopleA−better than 82% of U.S. towns·Overall B+ · #22 of 38
15WarwickKent County · 84,187 peopleA−better than 82% of U.S. towns·Overall B− · #29 of 38
16South KingstownWashington County · 32,009 peopleA−better than 82% of U.S. towns·Overall A · #13 of 38
17NarragansettWashington County · 14,291 peopleA−better than 82% of U.S. towns·Overall A · #8 of 38
18ScituateProvidence County · 10,767 peopleA−better than 82% of U.S. towns·Overall A · #15 of 38
19CoventryKent County · 36,281 peopleA−better than 76% of U.S. towns·Overall B · #27 of 38
20East GreenwichKent County · 14,790 peopleA−better than 75% of U.S. towns·Overall A+ · #1 of 38
21SmithfieldProvidence County · 22,625 peopleB+better than 73% of U.S. towns·Overall A · #10 of 38
22LincolnProvidence County · 23,713 peopleB+better than 71% of U.S. towns·Overall B+ · #25 of 38
23PawtucketProvidence County · 77,065 peopleB+better than 71% of U.S. towns·Overall D · #35 of 38
24CumberlandProvidence County · 37,615 peopleB+better than 70% of U.S. towns·Overall A · #9 of 38
25WesterlyWashington County · 23,139 peopleB+better than 68% of U.S. towns·Overall A− · #20 of 38
26BarringtonBristol County · 16,961 peopleB+better than 68% of U.S. towns·Overall A+ · #3 of 38
27RichmondWashington County · 8,128 peopleBbetter than 64% of U.S. towns·Overall A · #12 of 38
28JohnstonProvidence County · 30,494 peopleBbetter than 64% of U.S. towns·Overall B− · #30 of 38
29North SmithfieldProvidence County · 12,990 peopleBbetter than 64% of U.S. towns·Overall A− · #19 of 38
30CharlestownWashington County · 8,002 peopleBbetter than 63% of U.S. towns·Overall A · #16 of 38
31ProvidenceProvidence County · 195,310 peopleBbetter than 62% of U.S. towns·Overall D · #36 of 38
32West WarwickKent County · 31,487 peopleBbetter than 58% of U.S. towns·Overall C+ · #33 of 38
33Central FallsProvidence County · 23,124 peopleBbetter than 58% of U.S. towns·Overall D− · #38 of 38
34HopkintonWashington County · 8,393 peopleB−better than 53% of U.S. towns·Overall A− · #17 of 38
35CranstonProvidence County · 84,647 peopleB−better than 51% of U.S. towns·Overall B− · #31 of 38
36WoonsocketProvidence County · 44,580 peopleB−better than 50% of U.S. towns·Overall D− · #37 of 38
37North ProvidenceProvidence County · 34,833 peopleC+better than 44% of U.S. towns·Overall B · #28 of 38
38BurrillvilleProvidence County · 16,927 peopleC+better than 42% of U.S. towns·Overall B · #26 of 38
Quick answers

Questions people ask

Which Rhode Island town has the lowest natural-hazard risk?

Jamestown (Newport County) ranks first on hazard risk among 38 towns, with an A+; Newport and Bristol follow.

How are these towns ranked?

The Hazard risk grade: FEMA’s expected yearly loss to buildings from natural hazards, where residents live (National Risk Index). Towns are sorted on the grade’s score; the letter and rank are the same as on each town’s page. How grades work.

Why isn’t my town on this list?

The list covers towns of 2,500+ residents with a hazard risk grade (38 in Rhode Island). Smaller towns have the grade on their page but no rank. Every town is on the Rhode Island page.

Go deeper

More Rhode Island lists

Every list ranks the same 2,500+ towns, so a town’s rank means the same thing on each.

All Rhode Island rankings →
Other states

Towns with the lowest natural-hazard risk in other states