Home › Rankings › Find your place United States · 12,940 graded towns · 40+ public data setsFind your place. Tell us where and what matters. We’ll weigh every graded town on it, show you the ones that fit with their grades, and tell you honestly what you’d give up.
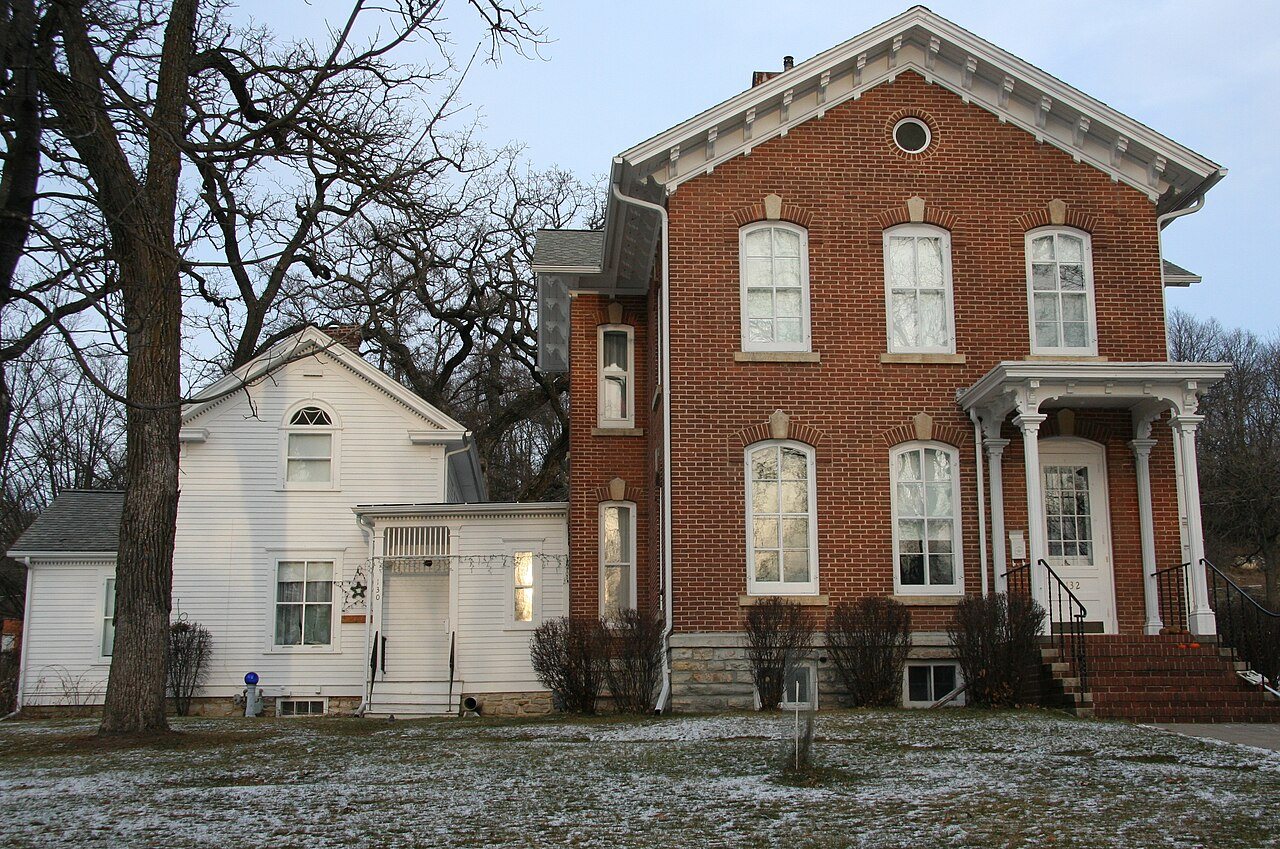
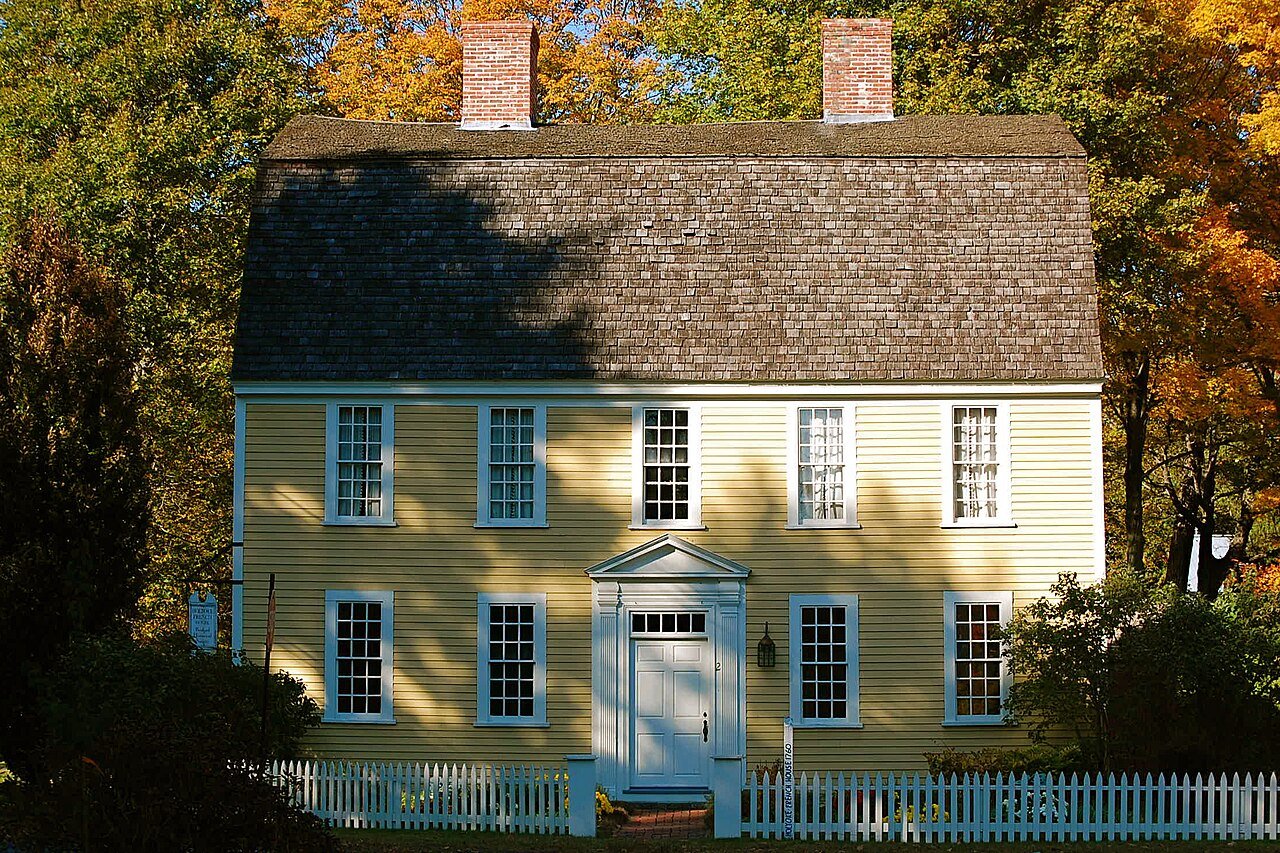
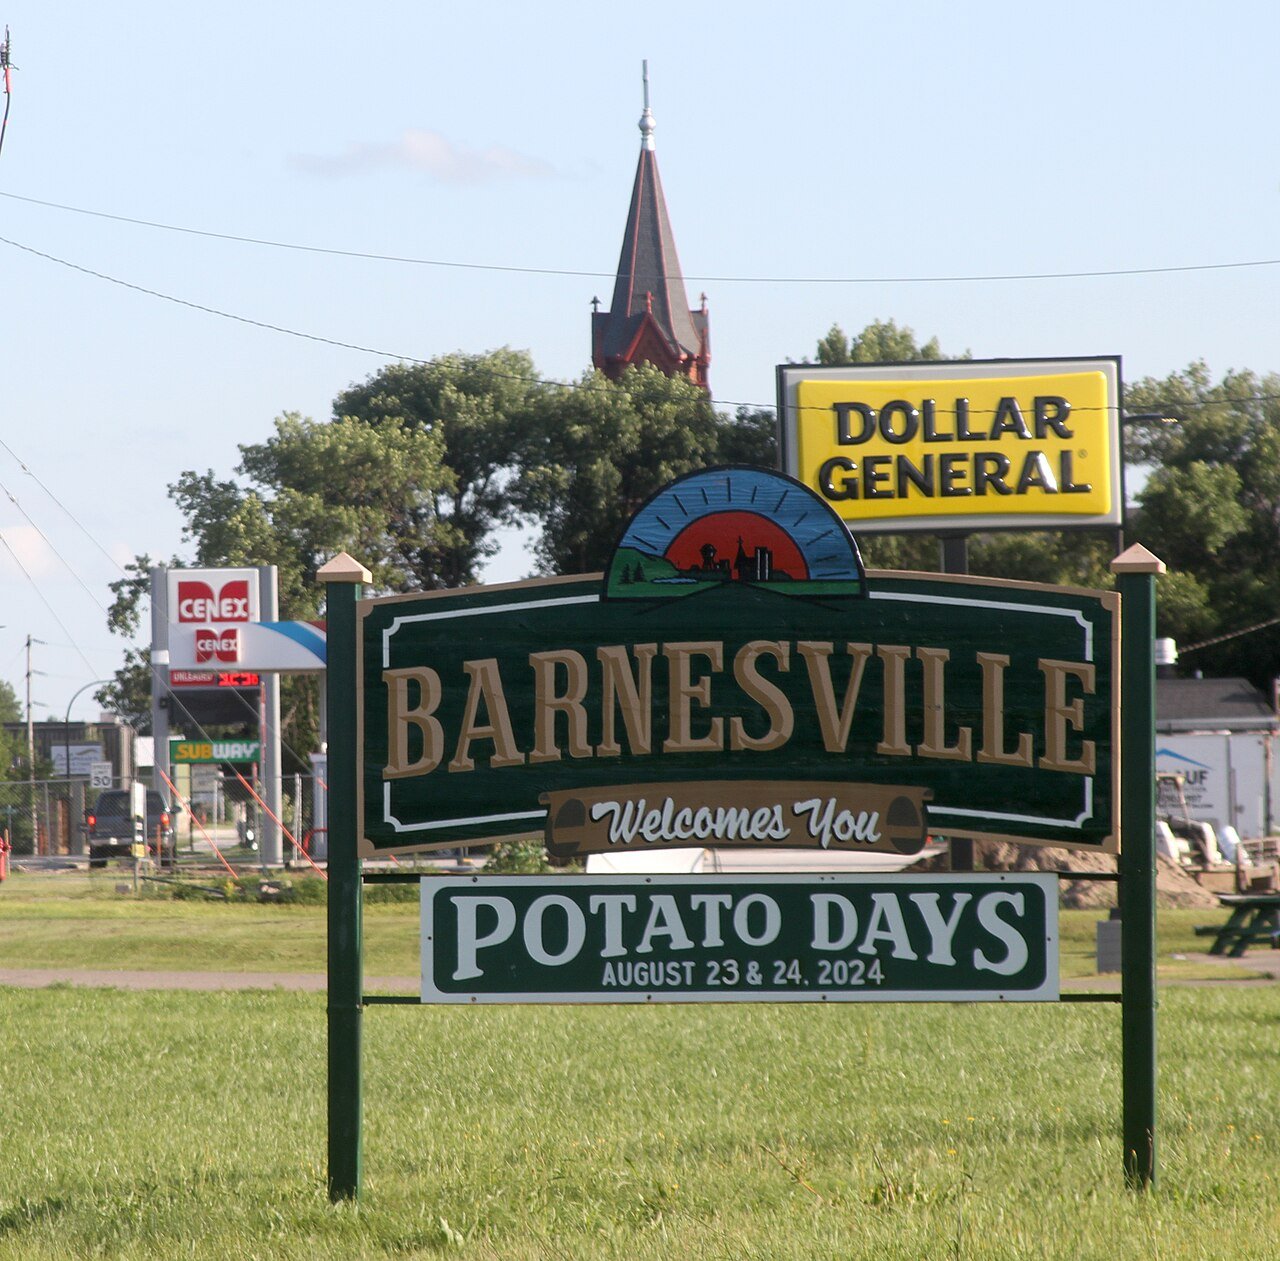
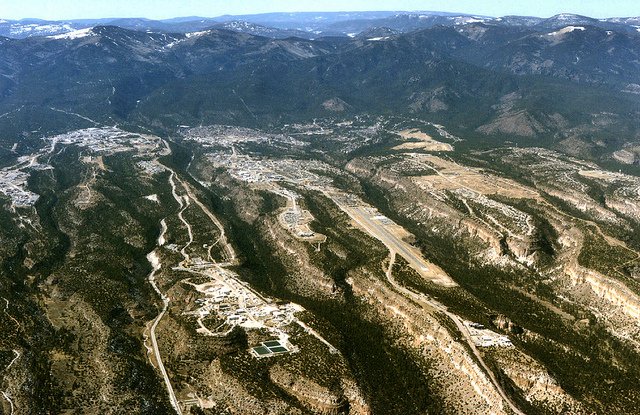
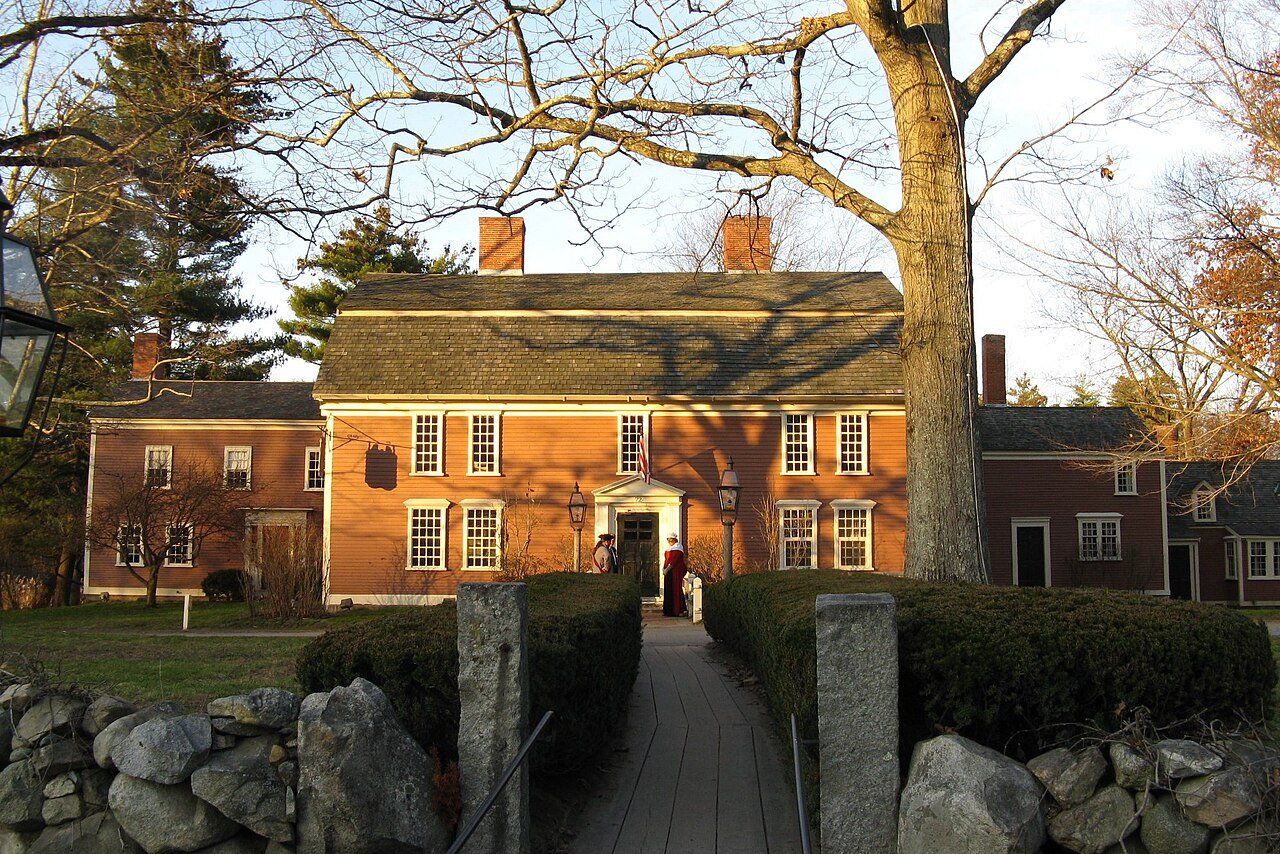
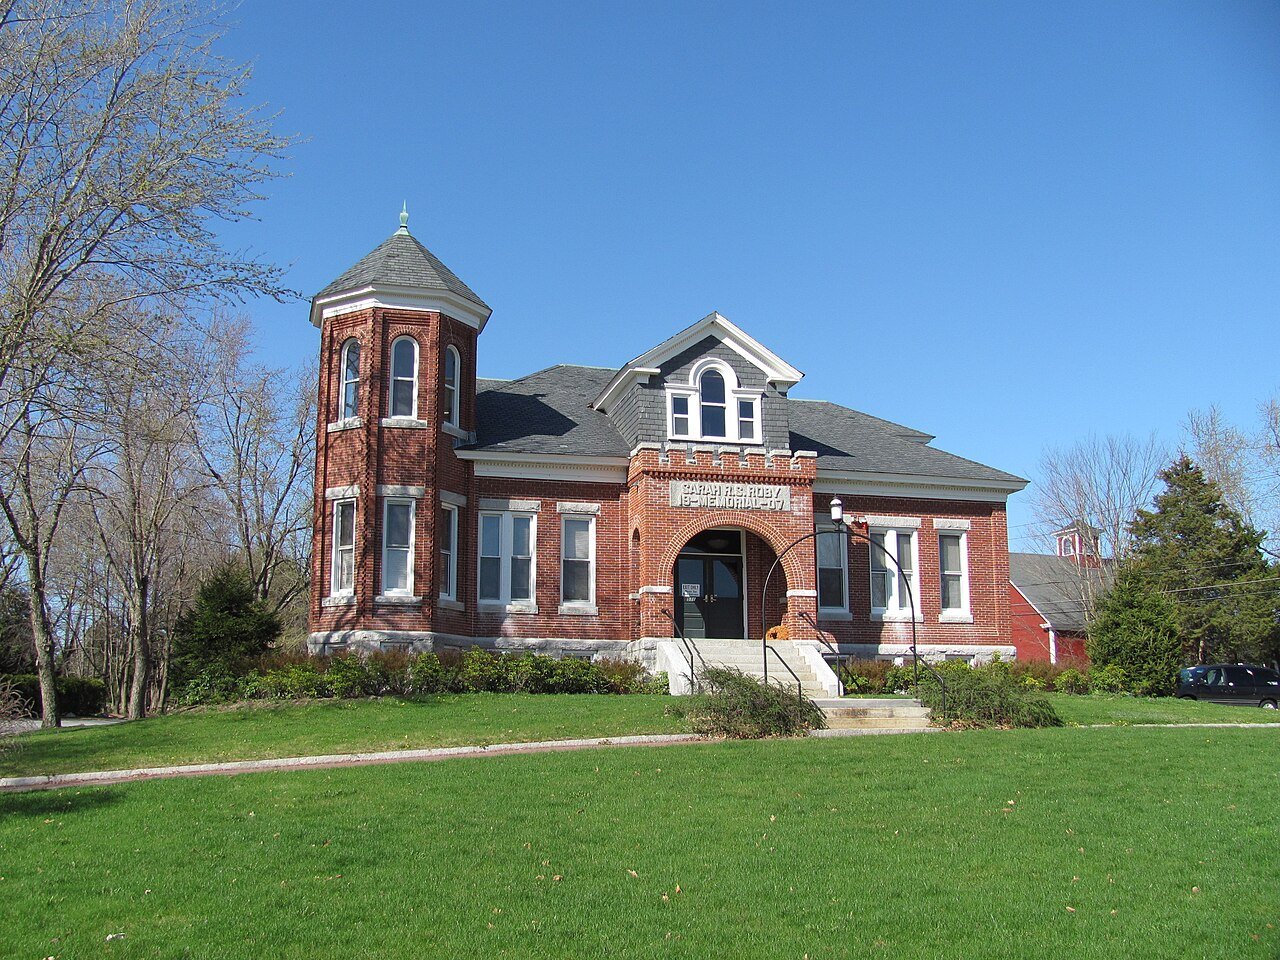
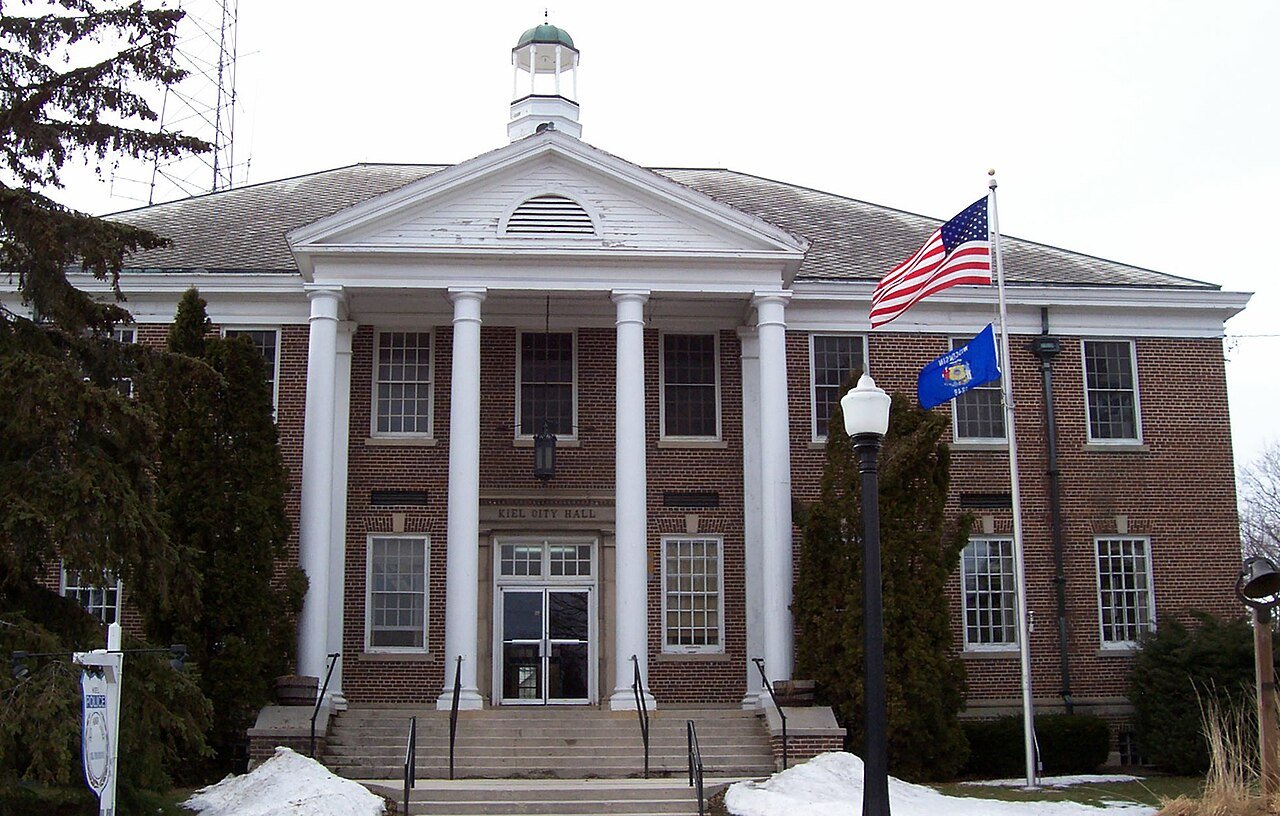
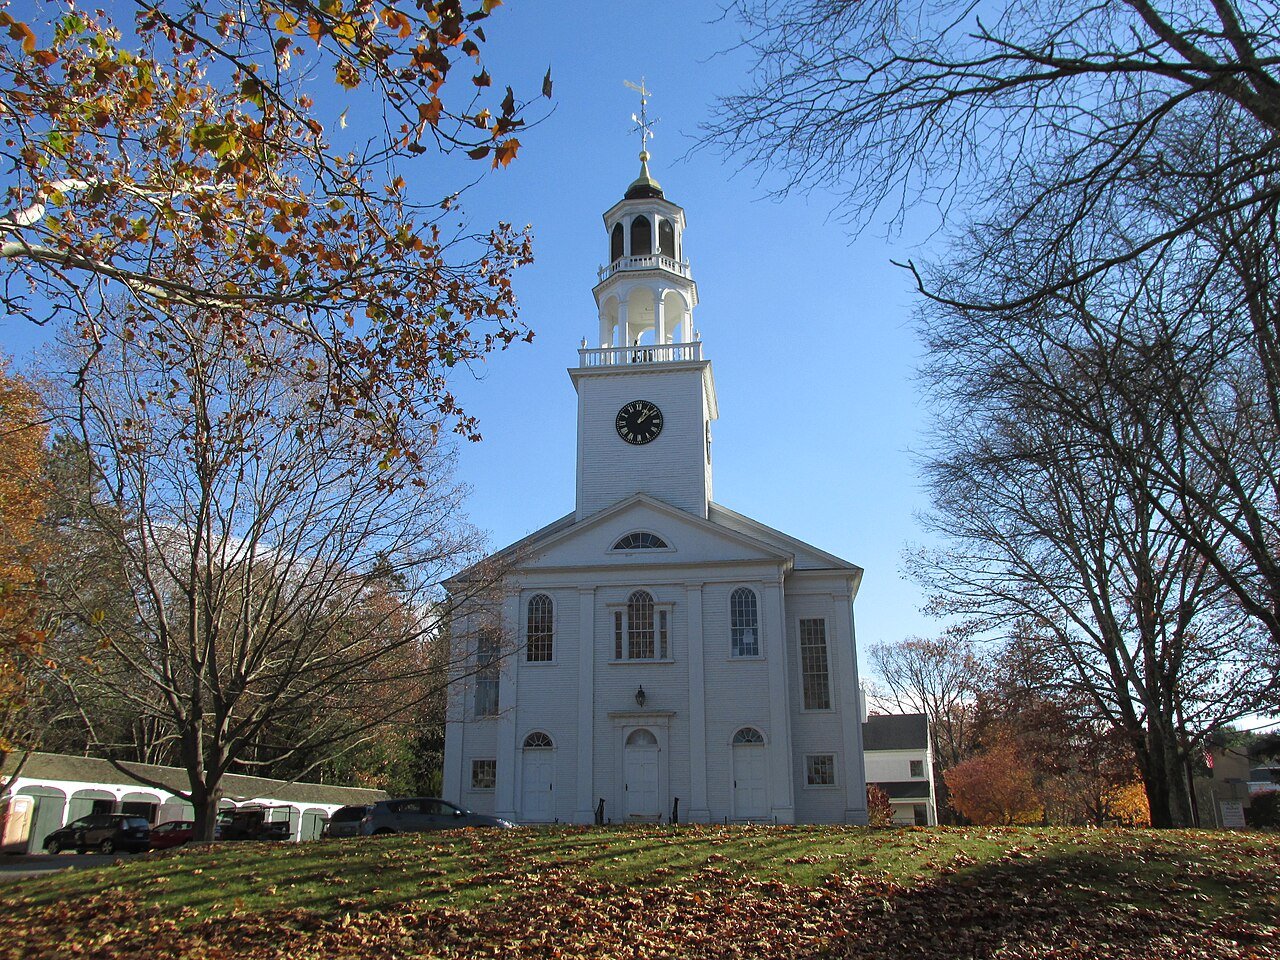
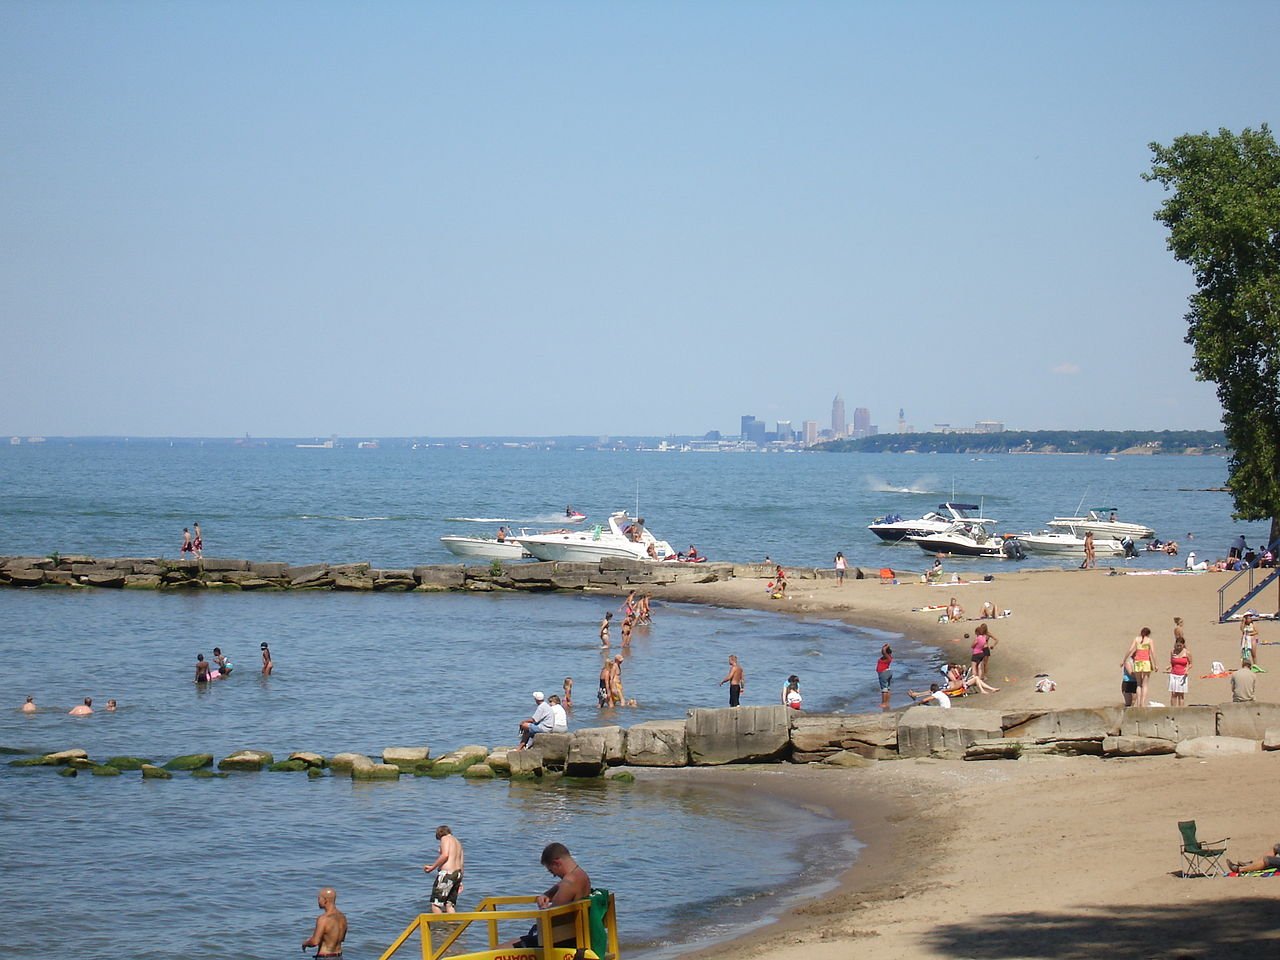
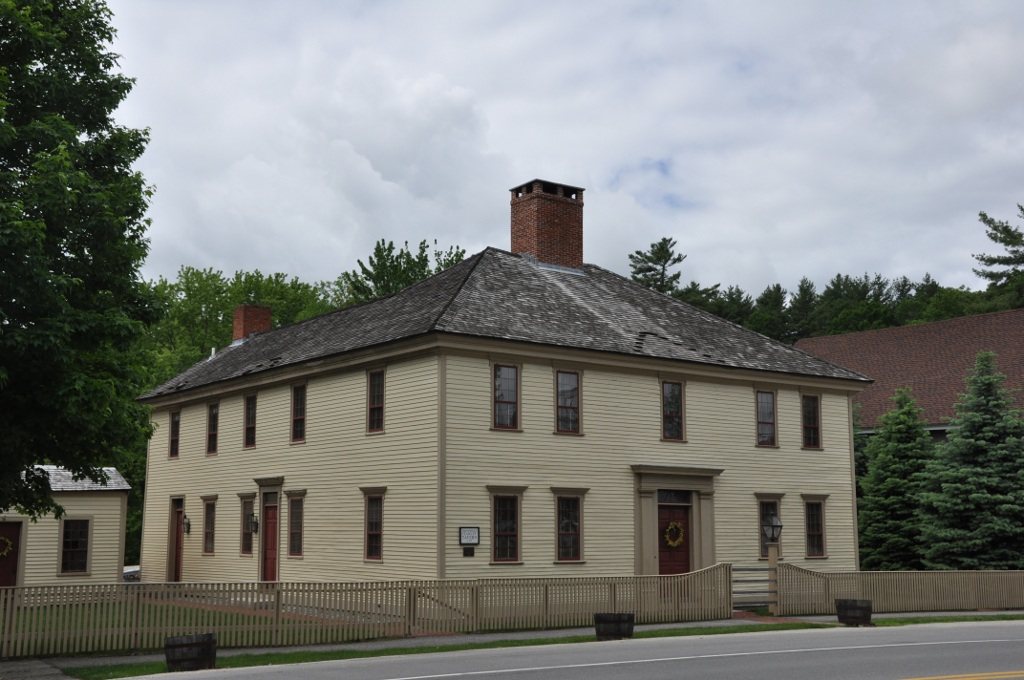
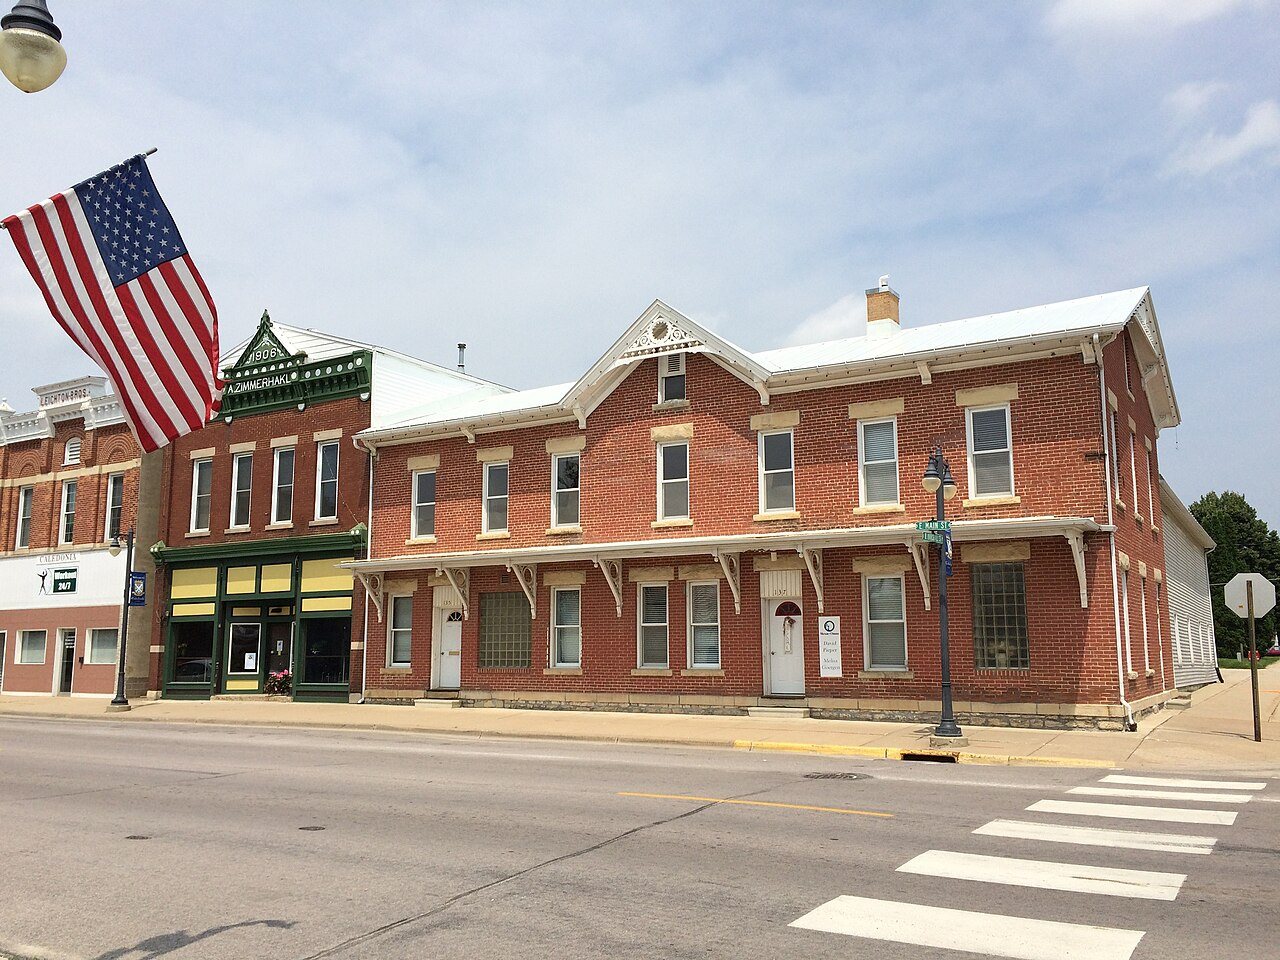
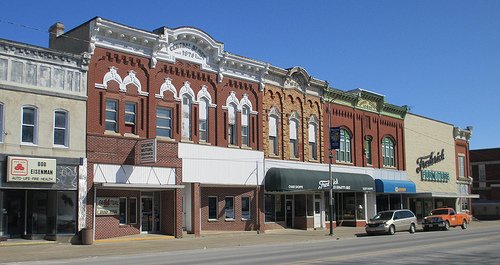
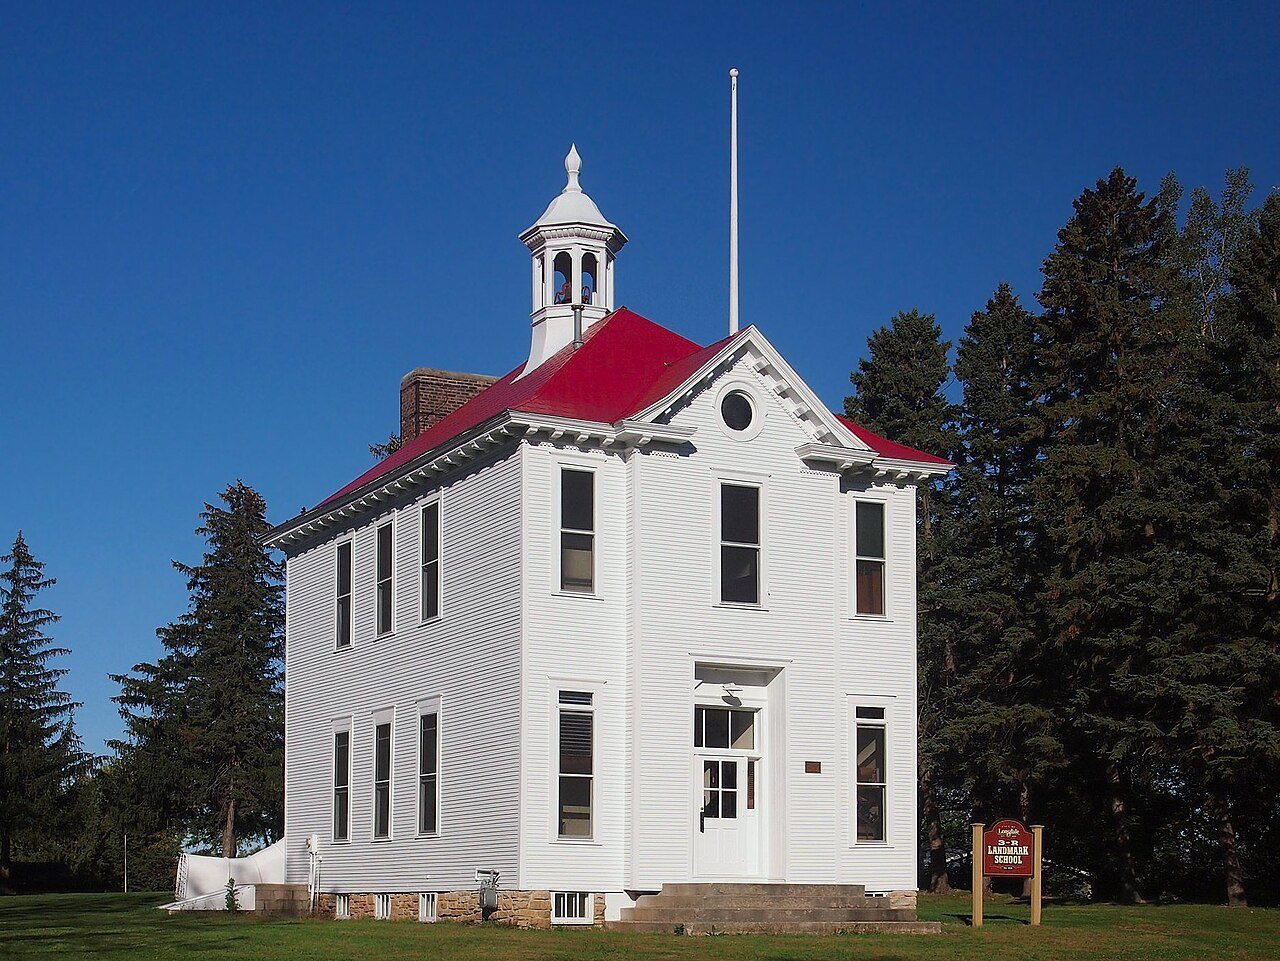
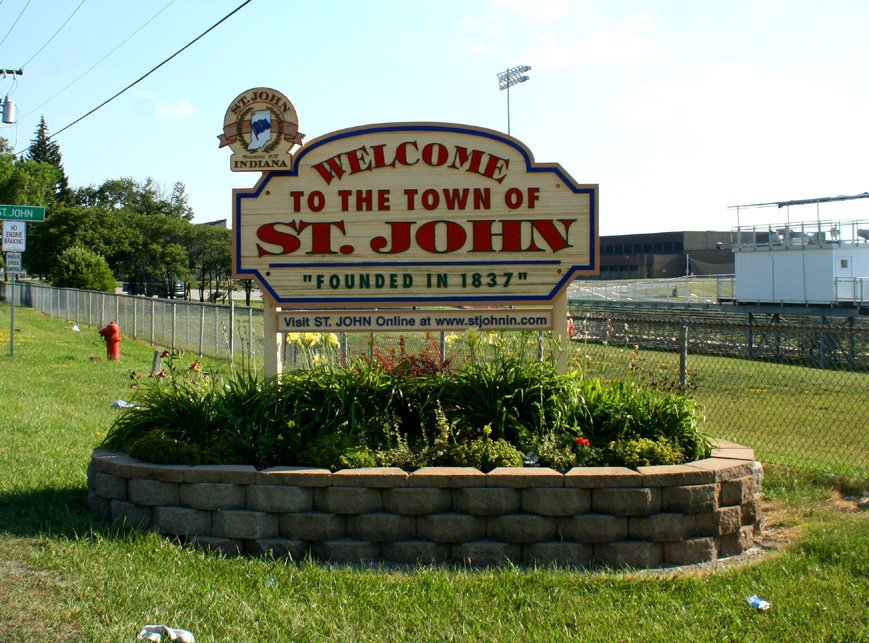
Your top 5, with their overall grades 1 Carlisle, MA A+ 2 Chatfield, MN A+ 3 Boxford, MA A+ 4 Barnesville, MN A+ 5 Los Alamos, NM A+ 3 Boxford, MA 2 Chatfield, MN 1 Carlisle, MA
Anywhere in the US AnywhereAll 50 states NortheastNew England, NY, NJ, PA Mid-AtlanticMD, DE, DC, VA, WV SoutheastCarolinas, Georgia, Florida SouthTN, KY, AL, MS, AR, LA MidwestGreat Lakes to Missouri PlainsDakotas to Oklahoma Texas Mountain WestCO, UT, ID, MT, WY SouthwestArizona, New Mexico, Nevada West CoastCalifornia, Oregon, Washington Alaska & Hawaii
Or pick states AK AL AR AZ CA CO CT DC DE FL GA HI IA ID IL IN KS KY LA MA MD ME MI MN MO MS MT NC ND NE NH NJ NM NV NY OH OK OR PA RI SC SD TN TX UT VA VT WA WI WV WY
Start from Young family Schools, safety, cost Retire somewhere warm Mild Januarys, 20%+ are 65+ Outdoorsy Outdoors grade first Close to a big city Within 30 mi of a 175k+ city Ski towns A 20+ run ski area ≤15 mi On the coast Half live ≤5 mi of open ocean On the Great Lakes Half live ≤5 mi of a Great Lake Beaches nearby 3+ beaches mapped in town Walk everywhere Walkability grade first Safe and affordable Safety and cost Low disaster risk Hazard risk grade first Steeped in history History and civic life
Your own mix: Nice counts once, Important twice, Must three times (a Must also rules out the bottom 40% on it).
What matters to you Reset Skip Nice Important Must
Affordablegraded Cost of living grade: home prices and rent vs area income
Safegraded Safety grade: crime reported to the FBI
Great schoolsgraded Schools grade: state tests (within the state)
Healthy towngraded Health grade: CDC estimates
Good jobs & incomegraded Jobs & income grade: income, work, job access
Walkablegraded Walkability grade: EPA index, walking and transit
Low disaster riskgraded Hazard risk grade: FEMA expected losses
Trails & open landgraded Outdoors grade: trails, conserved land, parks
+ 10 more things to weigh history, civic life, a strong overall grade…
The basics Town size Small town 2,500–10k Small city 10k–50k City 50k+
Near a big city a city of 175k+ Doesn’t matter Within 30 mi Within 60 mi Within 2 hrs
Looking in
the US , you care most about
affordability and
safety and would like
great schools ,
health ,
jobs and income and
the outdoors .
12,938 of 12,940 graded towns fit, and your best match is
Carlisle, Massachusetts .
Ruled out: 2 by missing grades. Copy a link to these results
More good fits Bars show each town’s grade on what you picked, in your order. Orange = bottom 40%. Striped = not graded.
4 Clay County, Minnesota · 2,767 people · $306k typical home · 191 mi to Minneapolis
Strong on safety and affordability
A+ #2 of 271 in MN
5 Los Alamos County, New Mexico · 13,317 people · $579k typical home · 58 mi to Albuquerque
Strong on affordability and health
A+ #1 of 72 in NM
6 Los Alamos County, New Mexico · 5,716 people · $501k typical home · 54 mi to Albuquerque
Strong on affordability and the outdoors
A+ #2 of 72 in NM
7 Essex County, Massachusetts · 4,952 people · $1.07M typical home · 20 mi to Boston
Strong on safety and the outdoors
A+ #1 of 282 in MA
8 Chester County, Pennsylvania · 7,924 people · $611k typical home · 32 mi to Philadelphia
Strong on safety and great schools · weaker on affordability
A+ #2 of 1032 in PA
9 Chester County, Pennsylvania · 4,118 people · $758k typical home · 26 mi to Philadelphia
Strong on safety and great schools · weaker on affordability
A+ #4 of 1032 in PA
10 Connecticut · 19,341 people · $636k typical home · 43 mi to Yonkers
Strong on safety and affordability
A+ #1 of 151 in CT
11 Middlesex County, Massachusetts · 11,541 people · $777k typical home · 27 mi to Worcester
Strong on safety and the outdoors · weaker on affordability
A+ #7 of 282 in MA
12 Middlesex County, Massachusetts · 19,643 people · $1.13M typical home · 21 mi to Boston
Strong on safety and health · weaker on affordability
A+ #4 of 282 in MA
13 Middlesex County, Massachusetts · 3,486 people · $797k typical home · 32 mi to Worcester
Strong on safety and the outdoors · weaker on affordability
A+ #27 of 282 in MA
14 Manitowoc County, Wisconsin · 3,973 people · $278k typical home · 59 mi to Milwaukee
Strong on safety and affordability
A+ #2 of 357 in WI
15 Hillsborough County, New Hampshire · 8,819 people · $792k typical home · 35 mi to Worcester
Strong on safety and jobs and income · weaker on affordability
A+ #1 of 125 in NH
16 Middlesex County, Massachusetts · 13,913 people · $1.13M typical home · 18 mi to Boston
Strong on safety and health · weaker on affordability
A+ #6 of 282 in MA
17 Essex County, Massachusetts · 6,626 people · $969k typical home · 22 mi to Boston
Strong on safety and the outdoors · weaker on affordability
A+ #5 of 282 in MA
18 Polk County, Iowa · 6,630 people · $430k typical home · 16 mi to Des Moines
Strong on safety and the outdoors · weaker on affordability
A+ #8 of 140 in IA
19 Allegheny County, Pennsylvania · 7,541 people · $258k typical home · 16 mi to Pittsburgh
Strong on safety and great schools
A+ #3 of 1032 in PA
20 Saratoga County, New York · 8,032 people · $270k typical home · 103 mi to Worcester
Strong on safety and the outdoors
A+ #19 of 745 in NY
21 Worcester County, Massachusetts · 3,618 people · $628k typical home · 13 mi to Worcester
Strong on safety and the outdoors
A+ #18 of 282 in MA
22 Cuyahoga County, Ohio · 15,792 people · $422k typical home · 13 mi to Cleveland
Strong on safety and health · weaker on affordability
A+ #2 of 987 in OH
23 Rockingham County, New Hampshire · 7,397 people · $650k typical home · 36 mi to Boston
Strong on safety and the outdoors
A+ #7 of 125 in NH
24 Merrimack County, New Hampshire · 6,120 people · $573k typical home · 65 mi to Worcester
Strong on safety and health · weaker on affordability
A+ #6 of 125 in NH
25 Lake County, Indiana · 16,273 people · $360k typical home · 25 mi to Chicago
Strong on safety and the outdoors
A+ #10 of 585 in IN
26 Madison County, Ohio · 4,322 people · $540k typical home · 17 mi to Columbus
Strong on safety and jobs and income
A+ #11 of 987 in OH
27 Worcester County, Massachusetts · 7,014 people · $922k typical home · 20 mi to Worcester
Strong on safety and the outdoors · weaker on affordability
A+ #11 of 282 in MA
28 Hunterdon County, New Jersey · 4,597 people · $638k typical home · 31 mi to Philadelphia
Strong on safety and jobs and income · weaker on affordability
A+ #13 of 466 in NJ
29 Lawrence County, Pennsylvania · 2,649 people · $134k typical home · 49 mi to Pittsburgh
Strong on safety and affordability · weaker on health
A+ #106 of 1032 in PA
30 Sherburne County, Minnesota · 5,425 people · $381k typical home · 42 mi to Minneapolis
Strong on safety and affordability
A #39 of 271 in MN
31 Chester County, Pennsylvania · 4,045 people · $653k typical home · 26 mi to Philadelphia
Strong on safety and health · weaker on affordability
A+ #33 of 1032 in PA
32 Schuylkill County, Pennsylvania · 3,368 people · $236k typical home · 85 mi to Philadelphia
Strong on safety and affordability
A+ #40 of 1032 in PA
33 Calumet County, Wisconsin · 3,040 people · $179k typical home · 62 mi to Milwaukee
Strong on affordability and safety
A+ #3 of 357 in WI
34 Hillsborough County, New Hampshire · 5,858 people · $669k typical home · 34 mi to Worcester
Strong on safety and jobs and income · weaker on affordability
A+ #4 of 125 in NH
35 Beaver County, Pennsylvania · 4,342 people · $280k typical home · 25 mi to Pittsburgh
Strong on safety and great schools
A+ #5 of 1032 in PA
36 Kane County, Illinois · 10,894 people · $691k typical home · 14 mi to Aurora
Strong on safety and health · weaker on affordability
A+ #6 of 767 in IL
37 D Hennepin County, Minnesota · 3,794 people · $1.09M typical home · 13 mi to Minneapolis
Strong on safety and health · weaker on affordability
A+ #3 of 271 in MN
38 Lake County, Indiana · 11,853 people · $333k typical home · 40 mi to Chicago
Strong on safety and affordability · weaker on the outdoors
A+ #2 of 585 in IN
39 Rockingham County, New Hampshire · 4,248 people · $606k typical home · 53 mi to Boston
Strong on safety and health
A+ #3 of 125 in NH
40 Chester County, Pennsylvania · 6,885 people · $704k typical home · 28 mi to Philadelphia
Strong on safety and jobs and income · weaker on affordability
A+ #10 of 1032 in PA
41 Cambria County, Pennsylvania · 4,076 people · $161k typical home · 58 mi to Pittsburgh
Strong on safety and affordability · weaker on health
A+ #74 of 1032 in PA
42 Beaver County, Pennsylvania · 8,791 people · $280k typical home · 28 mi to Pittsburgh
Strong on safety and great schools · weaker on affordability
A+ #49 of 1032 in PA
43 Dane County, Wisconsin · 7,725 people · $389k typical home · 16 mi to Madison
Strong on safety and the outdoors · weaker on affordability
A+ #1 of 357 in WI
44 Houston County, Minnesota · 2,768 people · $290k typical home · 111 mi to Madison
Strong on safety and affordability · weaker on the outdoors
A+ #4 of 271 in MN
45 Allegheny County, Pennsylvania · 12,301 people · $244k typical home · 15 mi to Pittsburgh
Strong on safety and great schools
A+ #16 of 1032 in PA
46 Perry County, Pennsylvania · 2,717 people · $293k typical home · 74 mi to Baltimore
Strong on safety and affordability
A #224 of 1032 in PA
47 Luzerne County, Pennsylvania · 4,742 people · $293k typical home · 88 mi to Philadelphia
Strong on safety and the outdoors · weaker on affordability
A+ #95 of 1032 in PA
48 T Wayne County, Michigan · 17,849 people · $243k typical home · 17 mi to Detroit
Strong on safety and affordability
A+ #11 of 697 in MI
49 Lexington city, Virginia · 7,769 people · $365k typical home · 109 mi to Richmond
Strong on safety and affordability
A+ #1 of 249 in VA
50 Clinton County, Illinois · 4,602 people · $263k typical home · 39 mi to St. Louis
Strong on safety and affordability
A+ #37 of 767 in IL
51 Stearns County, Minnesota · 2,591 people · $222k typical home · 76 mi to Minneapolis
Strong on affordability and safety · weaker on great schools
A+ #27 of 271 in MN
52 Scott County, Minnesota · 8,238 people · $353k typical home · 33 mi to Minneapolis
Strong on safety and great schools
A+ #7 of 271 in MN
53 Lafayette County, Missouri · 5,721 people · $262k typical home · 32 mi to Kansas City
Strong on safety and affordability · weaker on the outdoors
A+ #3 of 247 in MO
54 Washington County, Minnesota · 3,721 people · $438k typical home · 16 mi to St. Paul
Strong on safety and jobs and income · weaker on affordability
A+ #25 of 271 in MN
55 Hillsborough County, New Hampshire · 6,276 people · $625k typical home · 50 mi to Worcester
Strong on safety and great schools · weaker on affordability
A #12 of 125 in NH
56 Kewaunee County, Wisconsin · 2,793 people · $293k typical home · 99 mi to Milwaukee
Strong on affordability and safety · weaker on great schools
A+ #24 of 357 in WI
57 Grundy County, Iowa · 2,814 people · $197k typical home · 70 mi to Des Moines
Strong on safety and affordability
A+ #4 of 140 in IA
58 Westmoreland County, Pennsylvania · 31,697 people · $232k typical home · 15 mi to Pittsburgh
Strong on safety and affordability
A+ #13 of 1032 in PA
59 M Hennepin County, Minnesota · 7,460 people · $840k typical home · 15 mi to Minneapolis
Strong on safety and health · weaker on affordability
A+ #11 of 271 in MN
60 New Castle County, Delaware · 2,985 people · $498k typical home · 49 mi to Baltimore
Strong on safety and jobs and income
A+ #1 of 37 in DE
61 Allegheny County, Pennsylvania · 13,613 people · $248k typical home · 10 mi to Pittsburgh
Strong on safety and the outdoors · weaker on affordability
A+ #21 of 1032 in PA
62 Norfolk County, Massachusetts · 18,798 people · $873k typical home · 18 mi to Boston
Strong on safety and the outdoors · weaker on affordability
A+ #8 of 282 in MA
63 H Madison County, Illinois · 10,042 people · $275k typical home · 32 mi to St. Louis
Strong on safety and affordability
A+ #56 of 767 in IL
64 Carroll County, Maryland · 5,426 people · $455k typical home · 28 mi to Baltimore
Strong on safety and jobs and income · weaker on affordability
A+ #14 of 259 in MD
65 Rice County, Minnesota · 5,117 people · $372k typical home · 34 mi to Minneapolis
Strong on safety and jobs and income · weaker on affordability
A+ #19 of 271 in MN
66 Ogle County, Illinois · 3,777 people · $286k typical home · 56 mi to Aurora
Strong on safety and the outdoors
A+ #39 of 767 in IL
67 Westmoreland County, Pennsylvania · 20,636 people · $362k typical home · 17 mi to Pittsburgh
Strong on safety and great schools · weaker on affordability
A+ #41 of 1032 in PA
68 Dakota County, Minnesota · 25,425 people · $399k typical home · 20 mi to St. Paul
Strong on safety and jobs and income
A+ #37 of 271 in MN
69 G Jackson County, Missouri · 6,315 people · $358k typical home · 20 mi to Overland Park
Strong on safety and jobs and income · weaker on affordability
A #6 of 247 in MO
70 Wright County, Minnesota · 3,801 people · $412k typical home · 46 mi to Minneapolis
Strong on affordability and safety · weaker on jobs and income
A+ #17 of 271 in MN
71 Allegheny County, Pennsylvania · 5,139 people · $901k typical home · 8 mi to Pittsburgh
Strong on safety and great schools · weaker on affordability
A+ #7 of 1032 in PA
72 T York County, South Carolina · 14,457 people · $594k typical home · 16 mi to Charlotte
Strong on safety and great schools · weaker on affordability
A+ #1 of 167 in SC
73 P Hendricks County, Indiana · 4,443 people · $371k typical home · 18 mi to Indianapolis
Strong on safety and affordability · weaker on the outdoors
A+ #4 of 585 in IN
74 Lake County, Indiana · 24,841 people · $406k typical home · 30 mi to Chicago
Strong on safety and affordability · weaker on the outdoors
A+ #1 of 585 in IN
75 Lake County, Ohio · 6,925 people · $422k typical home · 19 mi to Cleveland
Strong on safety and great schools · weaker on affordability
A+ #56 of 987 in OH
Show 12 more Type any town and we’ll show where it lands for you, its grades, and what’s holding it back. Towns of 2,500+ with an overall grade are matched; smaller places and college campuses aren’t.
How matching works How does the match work? Each thing you pick reads the town’s grade on it: its standing among every U.S. town of 2,500+ people, the same figure behind its letter. Your match is the weighted average: Nice counts once, Important twice, Must three times. A Must also rules out towns in the bottom 40% on it. Lifestyle presets (warm winters, a ski area, the coast) are rules first: a town has to meet the rule printed under the chips, then it’s ranked.
Why do results show a letter instead of a match score? The order is your match; the letter is the town’s overall grade, the same one on its town page, with its rank in its state. A town can fit you best and still grade lower overall, when it’s strong on what you picked.
Why are schools compared within a state? Each state writes its own tests, so a score in one state can’t be compared with another. A town’s Schools grade ranks it against the rest of its own state.
What if a town is missing a grade? Many towns don’t report crime to the FBI, and small districts have no test results. A missing grade counts as average and the card says so; a town missing more than a third of what you picked is left out. Presets need the grades they rank on.
Does anyone pay to be listed? No. Every grade comes from public data: the Census, the FBI, state education departments, the CDC, FEMA, the EPA, NOAA, Zillow and OpenStreetMap.
How grades work →
Sources: TownRatings grades (from the Census ACS, FBI crime data, state education departments via EDFacts, CDC PLACES, FEMA National Risk Index, the EPA Smart Location Database, OpenStreetMap, PAD-US and the National Register of Historic Places); NOAA climate normals; Zillow; data/coast (NOAA shoreline); for trips, Census LEHD visitor jobs and OpenSkiMap. Grades updated November 5, 2026.
12,938 matches ↓ 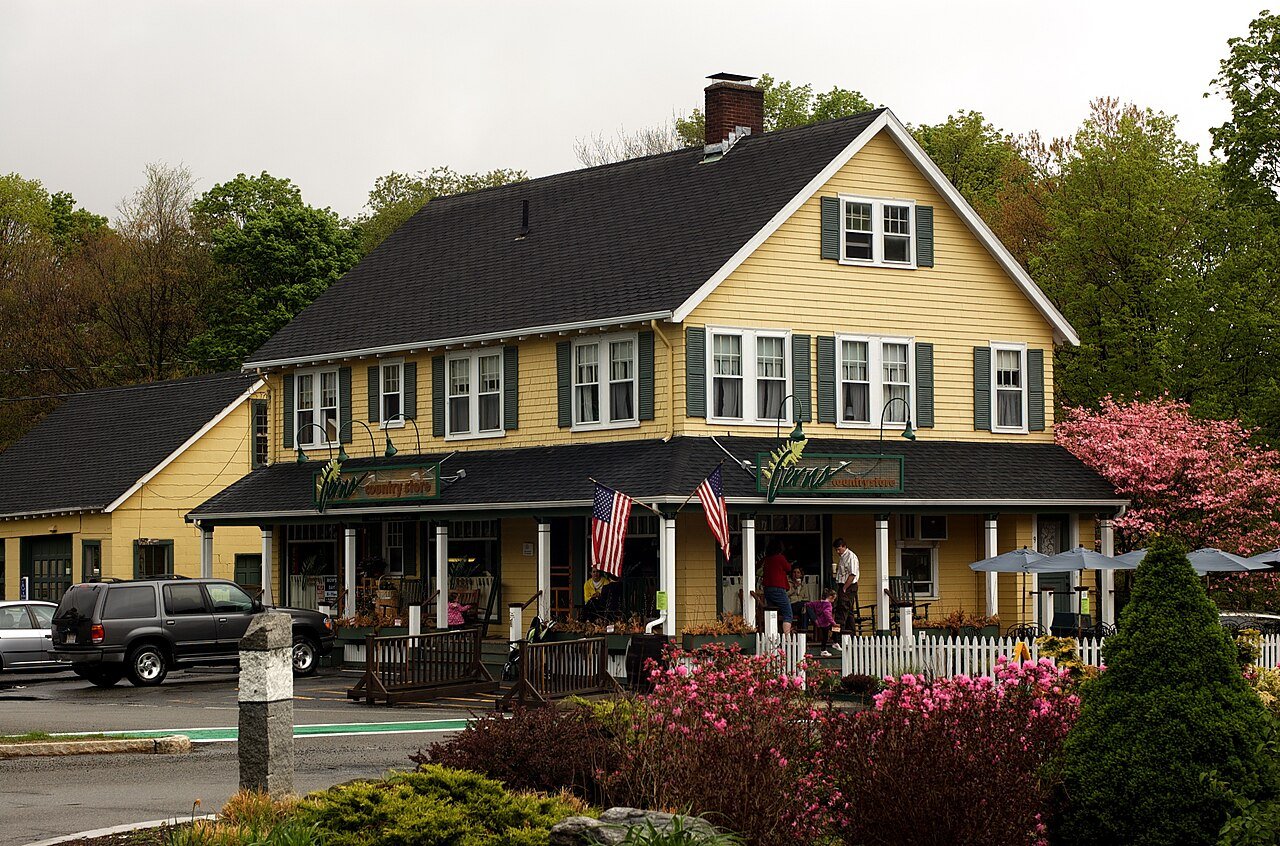 Your best match