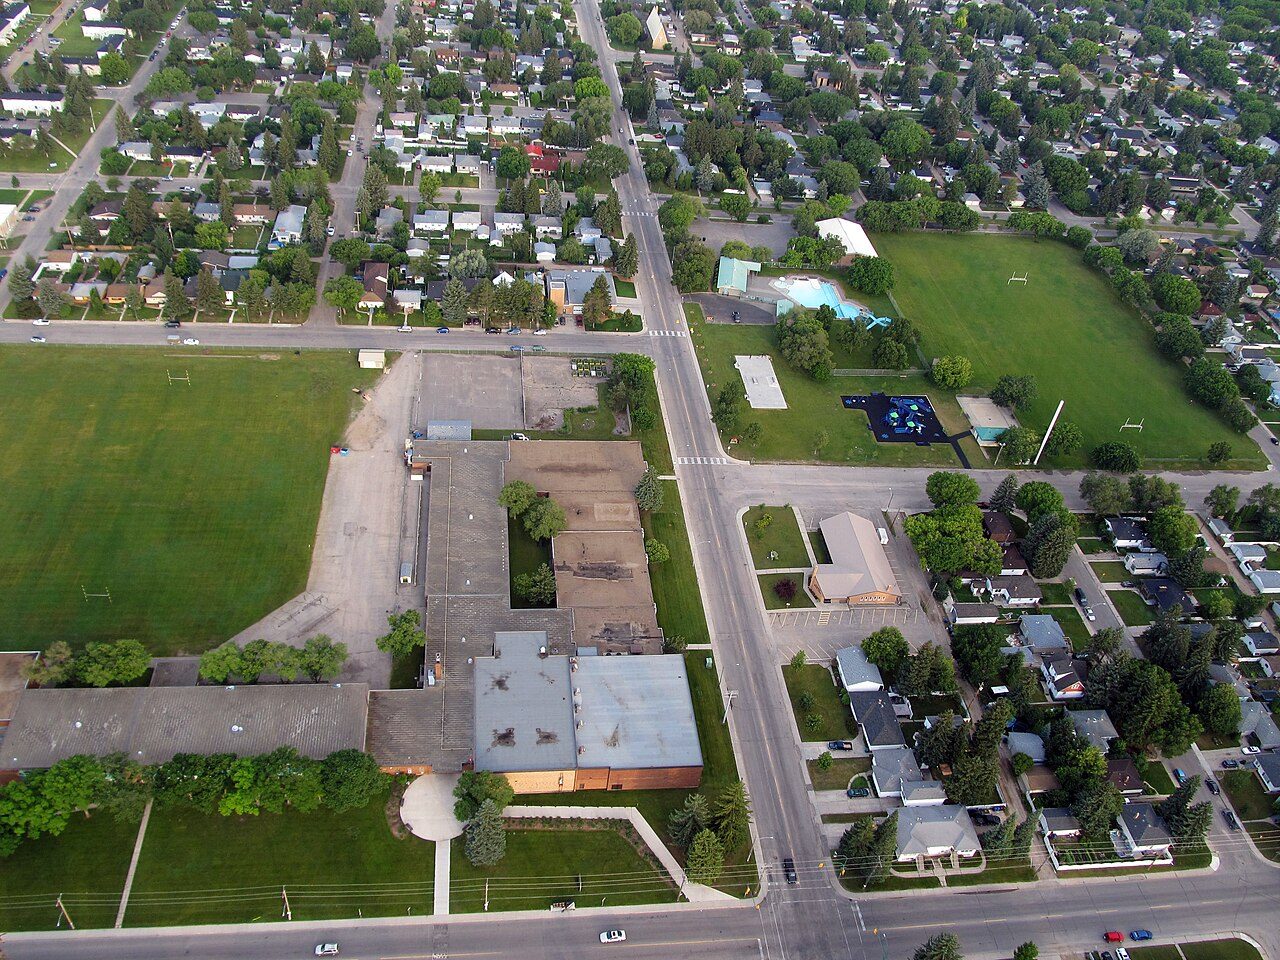
Home › Canada › Saskatchewan › Saskatoon › Rankings › Most bilingual Haultain, #1 on this list · Photo: daryl_mitchell from Saskatoon, Saskatchewan, Canada (CC BY-SA 2.0) Saskatoon · 2026 Most bilingual neighbourhoods in Saskatoon The national top 100 holds no neighbourhood from Saskatoon. Leading Saskatoon on this list is Haultain, at 11.2%. The places after the leader belong to Buena Vista (11.0%) and City Park (9.9%). Halfway down the list sits Holliston, at 6.2%. At the other end is Westview, with 3.6%. Across Canada, the same list puts Haultain #932 of 2,589.
Share of residents who can hold a conversation in both English and French, 2021 census How grades work
#1 Saskatchewan · 6,126 people 11.2% English and French Overall B− · #1,395 of 2,556
Strongest: walkability A+ , hazard risk A · lowest: cost of living D
#2 Saskatchewan · 5,777 people 11.0% English and French Overall B− · #1,179 of 2,556
Strongest: walkability A+ , jobs & income A+ · lowest: cost of living D
#3 Saskatchewan · 3,827 people 9.9% English and French Overall C+ · #1,744 of 2,556
Strongest: walkability A+ , hazard risk A · lowest: cost of living D−
All 43 neighbourhoods, ranked Best first in Saskatoon; beside each place, its rank on the same list for all of Canada.
Every Saskatoon list # Neighbourhood English and French Canada rank What drives it
1 Haultain 6,126 people 11.2% #932 of 2,589 Strongest: walkability A+ , hazard risk A · lowest: cost of living D 2 Buena Vista 5,777 people 11.0% #941 of 2,589 Strongest: walkability A+ , jobs & income A+ · lowest: cost of living D 3 City Park 3,827 people 9.9% #1,018 of 2,589 Strongest: walkability A+ , hazard risk A · lowest: cost of living D− 5 Brevoort Park 3,485 people 8.5% #1,153 of 2,589 Strongest: walkability A+ , hazard risk A · lowest: cost of living D 6 Grosvenor Park 6,240 people 8.5% #1,157 of 2,589 Strongest: walkability A+ , hazard risk A · lowest: cost of living D− 7 Eastview 7,536 people 8.2% #1,191 of 2,589 Strongest: hazard risk A , jobs & income B+ · lowest: cost of living D 8 Silverwood Heights 8,153 people 8.0% #1,211 of 2,589 Strongest: jobs & income A+ , hazard risk A · lowest: safety C− 9 North Park 5,000 people 7.9% #1,226 of 2,589 Strongest: hazard risk A , walkability A− · lowest: cost of living D 10 Lawson Heights 8,158 people 7.8% #1,240 of 2,589 Strongest: jobs & income A+ , hazard risk A · lowest: safety C− 12 Caswell Hill 2,573 people 7.5% #1,294 of 2,589 Strongest: hazard risk A , walkability A · lowest: safety C− 13 Adelaide/Churchill 2,652 people 7.3% #1,326 of 2,589 Strongest: jobs & income A+ , hazard risk A · lowest: safety C− 14 Brighton 7,238 people 7.2% #1,351 of 2,589 Strongest: jobs & income A+ , hazard risk A · lowest: safety C− 15 Greystone Heights 6,402 people 7.1% #1,371 of 2,589 Strongest: walkability A+ , jobs & income A · lowest: safety C− 16 Willowgrove 9,787 people 6.9% #1,409 of 2,589 Strongest: jobs & income A , hazard risk A · lowest: safety C− 17 Stonebridge 15,230 people 6.9% #1,415 of 2,589 Strongest: jobs & income A+ , hazard risk A · lowest: safety C− 18 Evergreen 16,088 people 6.6% #1,474 of 2,589 Strongest: jobs & income A+ , hazard risk A · lowest: safety C− 19 Mayfair 2,927 people 6.6% #1,481 of 2,589 Strongest: walkability A , hazard risk A · lowest: safety C− 20 Avalon 9,488 people 6.3% #1,547 of 2,589 Strongest: jobs & income A , hazard risk A · lowest: safety C− 21 University 5,888 people 6.3% #1,555 of 2,589 Strongest: hazard risk A , walkability A− · lowest: cost of living D 22 Holliston 2,963 people 6.2% #1,574 of 2,589 Strongest: walkability A , jobs & income A · lowest: safety C− 23 Lakewood Urban Centre 4,923 people 6.1% #1,601 of 2,589 Strongest: hazard risk A , jobs & income A · lowest: safety C− 24 Nutana Park 3,045 people 6.1% #1,610 of 2,589 Strongest: hazard risk A , jobs & income A · lowest: safety C− 25 South West Industrial 5,297 people 6.0% #1,634 of 2,589 Strongest: hazard risk A , health B+ · lowest: safety C− 26 Rosewood 8,427 people 5.9% #1,667 of 2,589 Strongest: jobs & income A , hazard risk A · lowest: safety C− 27 Hampton Village 9,119 people 5.8% #1,684 of 2,589 Strongest: jobs & income A+ , hazard risk A · lowest: safety C− 28 Westmount 2,872 people 5.8% #1,701 of 2,589 Strongest: walkability A , hazard risk A · lowest: cost of living D 29 Nutana Urban Centre 5,926 people 5.6% #1,756 of 2,589 Strongest: walkability A , hazard risk A · lowest: cost of living D 30 Lakewood 14,880 people 5.4% #1,807 of 2,589 Strongest: hazard risk A , walkability A− · lowest: cost of living D 32 Meadowgreen 3,782 people 4.9% #1,970 of 2,589 Strongest: hazard risk A , walkability A · lowest: cost of living D 35 Pleasant Hill 6,088 people 4.7% #2,033 of 2,589 Strongest: walkability A+ , hazard risk A · lowest: cost of living D 36 Dundonald 2,855 people 4.6% #2,037 of 2,589 Strongest: jobs & income A+ , hazard risk A · lowest: safety C− 37 Pacific Heights 3,770 people 4.6% #2,051 of 2,589 Strongest: hazard risk A , health B+ · lowest: safety C− 38 Confederation Park 5,771 people 4.5% #2,077 of 2,589 Strongest: jobs & income A , hazard risk A · lowest: safety C− 39 Mount Royal 5,292 people 4.4% #2,128 of 2,589 Strongest: hazard risk A , walkability A · lowest: cost of living D 40 Fairhaven 6,536 people 4.1% #2,205 of 2,589 Strongest: hazard risk A , walkability A− · lowest: cost of living D 41 Parkridge 4,518 people 3.8% #2,288 of 2,589 Strongest: hazard risk A , health B+ · lowest: safety C− 42 Massey Place 6,561 people 3.7% #2,321 of 2,589 Strongest: hazard risk A , walkability A · lowest: cost of living D 43 Westview 2,670 people 3.6% #2,330 of 2,589 Strongest: hazard risk A , jobs & income A− · lowest: safety C− Rankings
More lists for Saskatoon City by city
Most bilingual elsewhere Photos: Haultain, daryl_mitchell from Saskatoon, Saskatchewan, Canada (CC BY-SA 2.0 ) · Buena Vista, SriMesh (CC BY-SA 3.0 ) · City Park, Drm310 (CC BY-SA 3.0 ), via Wikimedia Commons.
Sources: TownRatings grades: our own summary of the data, ranking Canadian towns against each other only, run #73 of 10 November 2026. Under the Statistics Canada Open Licence.
Adapted from Statistics Canada (Census of Population 2021, population estimates 2025, 2021 census boundaries) under the Statistics Canada Open Licence; this does not constitute an endorsement by Statistics Canada. Neighbourhood names in some cities © OpenStreetMap contributors (ODbL).
 #1
 #2
 #3