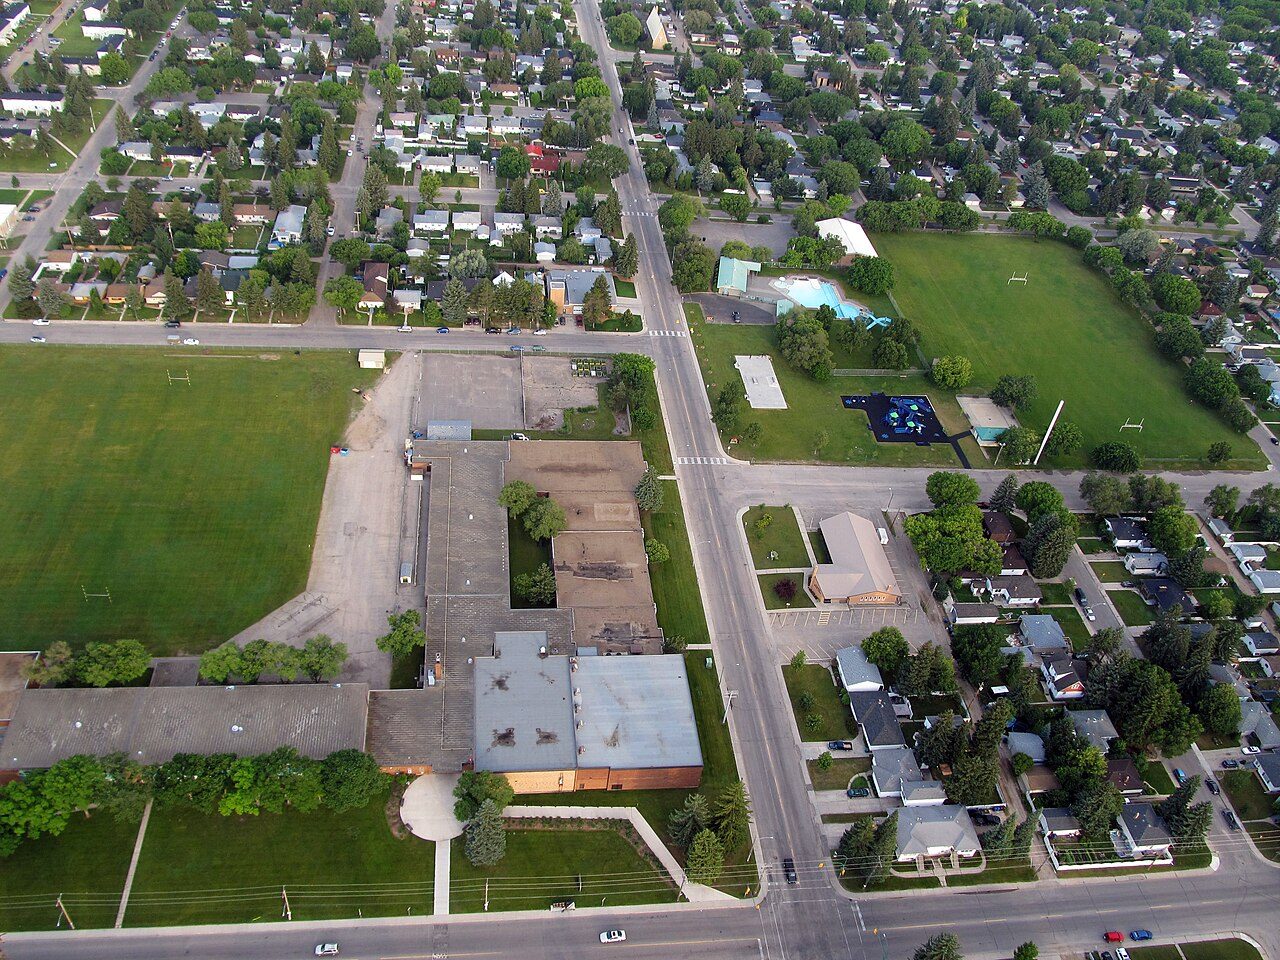
Home › Canada › Saskatchewan › Saskatoon › Rankings › Most historic Central Business District, #1 on this list · Photo: daryl_mitchell from Saskatoon, Saskatchewan, Canada (CC BY-SA 2.0) Saskatoon · 2026 Most historic neighbourhoods in Saskatoon Nationally, Central Business District ranks #55 of 2,589. A single neighbourhood in Saskatoon reaches the top 100 for all of Canada. Nowhere in Saskatoon does better on this list than Central Business District, at 10. Buena Vista is second (5) and Haultain third (5). The middle of the list is Confederation Park, with 0. The list ends with Nutana Urban Centre, at 0.
Places on Canada’s heritage registers per 10,000 people How grades work
#1 Saskatchewan · 4,987 people 10 Per 10,000 people Overall C− · #2,119 of 2,556
Strongest: walkability A+ , hazard risk A · lowest: cost of living D−
#2 Saskatchewan · 5,777 people 5 Per 10,000 people Overall B− · #1,179 of 2,556
Strongest: walkability A+ , jobs & income A+ · lowest: cost of living D
#3 Saskatchewan · 6,126 people 5 Per 10,000 people Overall B− · #1,395 of 2,556
Strongest: walkability A+ , hazard risk A · lowest: cost of living D
All 43 neighbourhoods, ranked Best first in Saskatoon; beside each place, its rank on the same list for all of Canada.
Every Saskatoon list # Neighbourhood Per 10,000 people Canada rank What drives it
2 Buena Vista 5,777 people 5 #137 of 2,589 Strongest: walkability A+ , jobs & income A+ · lowest: cost of living D 3 Haultain 6,126 people 5 #147 of 2,589 Strongest: walkability A+ , hazard risk A · lowest: cost of living D 4 Caswell Hill 2,573 people 4 #184 of 2,589 Strongest: hazard risk A , walkability A · lowest: safety C− 6 Grosvenor Park 6,240 people 3 #240 of 2,589 Strongest: walkability A+ , hazard risk A · lowest: cost of living D− 7 North Park 5,000 people 2 #360 of 2,589 Strongest: hazard risk A , walkability A− · lowest: cost of living D 8 University 5,888 people 2 #408 of 2,589 Strongest: hazard risk A , walkability A− · lowest: cost of living D 9 Pleasant Hill 6,088 people 2 #417 of 2,589 Strongest: walkability A+ , hazard risk A · lowest: cost of living D 10 Avalon 9,488 people 1 #521 of 2,589 Strongest: jobs & income A , hazard risk A · lowest: safety C− 11 Evergreen 16,088 people 1 #624 of 2,589 Strongest: jobs & income A+ , hazard risk A · lowest: safety C− 12 Brighton 7,238 people 0 #1,140 of 2,589 Strongest: jobs & income A+ , hazard risk A · lowest: safety C− 13 Dundonald 2,855 people 0 #1,171 of 2,589 Strongest: jobs & income A+ , hazard risk A · lowest: safety C− 14 Hampton Village 9,119 people 0 #1,186 of 2,589 Strongest: jobs & income A+ , hazard risk A · lowest: safety C− 15 Lakewood Urban Centre 4,923 people 0 #1,262 of 2,589 Strongest: hazard risk A , jobs & income A · lowest: safety C− 16 Adelaide/Churchill 2,652 people 0 #1,268 of 2,589 Strongest: jobs & income A+ , hazard risk A · lowest: safety C− 17 Silverwood Heights 8,153 people 0 #1,292 of 2,589 Strongest: jobs & income A+ , hazard risk A · lowest: safety C− 18 Willowgrove 9,787 people 0 #1,301 of 2,589 Strongest: jobs & income A , hazard risk A · lowest: safety C− 19 Holliston 2,963 people 0 #1,462 of 2,589 Strongest: walkability A , jobs & income A · lowest: safety C− 21 Nutana Park 3,045 people 0 #1,504 of 2,589 Strongest: hazard risk A , jobs & income A · lowest: safety C− 22 Confederation Park 5,771 people 0 #1,518 of 2,589 Strongest: jobs & income A , hazard risk A · lowest: safety C− 23 Greystone Heights 6,402 people 0 #1,597 of 2,589 Strongest: walkability A+ , jobs & income A · lowest: safety C− 24 Lawson Heights 8,158 people 0 #1,666 of 2,589 Strongest: jobs & income A+ , hazard risk A · lowest: safety C− 25 Westview 2,670 people 0 #1,685 of 2,589 Strongest: hazard risk A , jobs & income A− · lowest: safety C− 26 Stonebridge 15,230 people 0 #1,718 of 2,589 Strongest: jobs & income A+ , hazard risk A · lowest: safety C− 27 Rosewood 8,427 people 0 #1,764 of 2,589 Strongest: jobs & income A , hazard risk A · lowest: safety C− 28 Pacific Heights 3,770 people 0 #1,817 of 2,589 Strongest: hazard risk A , health B+ · lowest: safety C− 29 Brevoort Park 3,485 people 0 #1,843 of 2,589 Strongest: walkability A+ , hazard risk A · lowest: cost of living D 30 Parkridge 4,518 people 0 #1,879 of 2,589 Strongest: hazard risk A , health B+ · lowest: safety C− 33 City Park 3,827 people 0 #2,021 of 2,589 Strongest: walkability A+ , hazard risk A · lowest: cost of living D− 34 Lakewood 14,880 people 0 #2,050 of 2,589 Strongest: hazard risk A , walkability A− · lowest: cost of living D 35 Fairhaven 6,536 people 0 #2,069 of 2,589 Strongest: hazard risk A , walkability A− · lowest: cost of living D 37 Mayfair 2,927 people 0 #2,099 of 2,589 Strongest: walkability A , hazard risk A · lowest: safety C− 38 Eastview 7,536 people 0 #2,166 of 2,589 Strongest: hazard risk A , jobs & income B+ · lowest: cost of living D 39 Westmount 2,872 people 0 #2,214 of 2,589 Strongest: walkability A , hazard risk A · lowest: cost of living D 40 Mount Royal 5,292 people 0 #2,257 of 2,589 Strongest: hazard risk A , walkability A · lowest: cost of living D 41 Massey Place 6,561 people 0 #2,303 of 2,589 Strongest: hazard risk A , walkability A · lowest: cost of living D 42 Meadowgreen 3,782 people 0 #2,308 of 2,589 Strongest: hazard risk A , walkability A · lowest: cost of living D 43 Nutana Urban Centre 5,926 people 0 #2,373 of 2,589 Strongest: walkability A , hazard risk A · lowest: cost of living D Rankings
More lists for Saskatoon City by city
Most historic elsewhere Photos: Central Business District, daryl_mitchell from Saskatoon, Saskatchewan, Canada (CC BY-SA 2.0 ) · Buena Vista, SriMesh (CC BY-SA 3.0 ) · Haultain, daryl_mitchell from Saskatoon, Saskatchewan, Canada (CC BY-SA 2.0 ), via Wikimedia Commons.
Sources: TownRatings grades: our own summary of the data, ranking Canadian towns against each other only, run #73 of 10 November 2026. Under the Statistics Canada Open Licence.
Adapted from Statistics Canada (Census of Population 2021, population estimates 2025, 2021 census boundaries) under the Statistics Canada Open Licence; this does not constitute an endorsement by Statistics Canada. Neighbourhood names in some cities © OpenStreetMap contributors (ODbL).
 #1
 #2
 #3