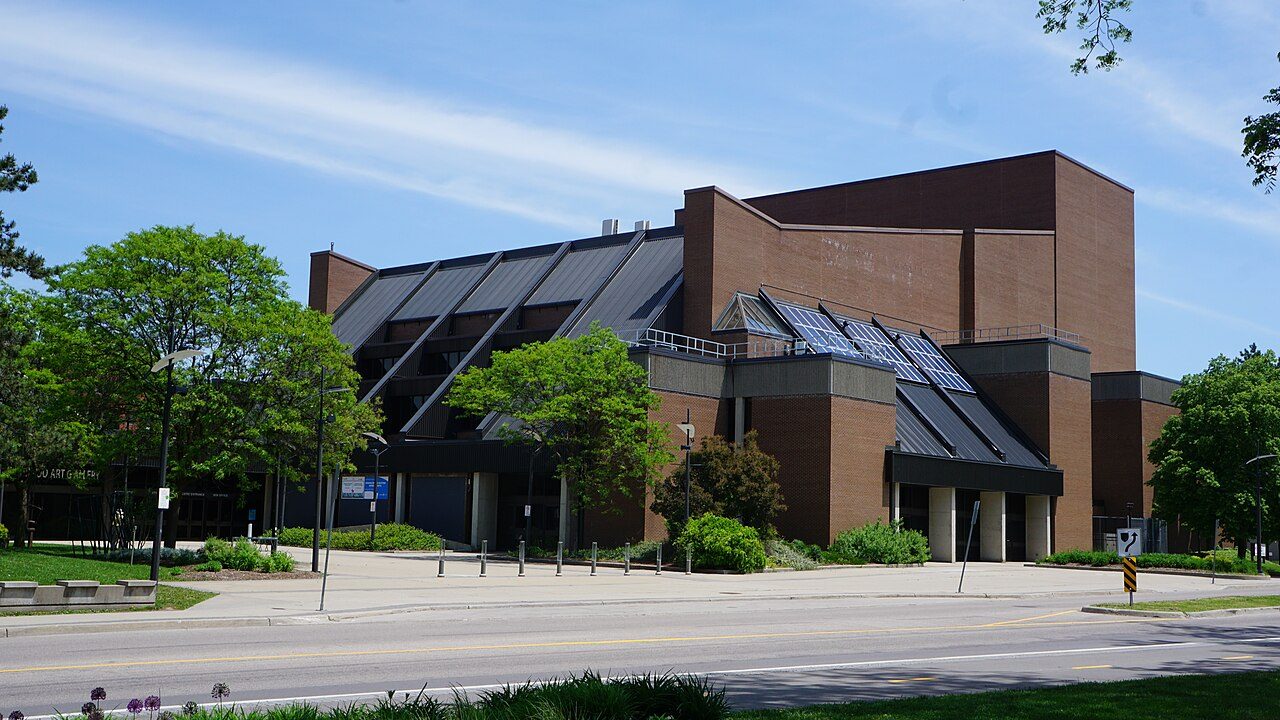
Home › Canada › Ontario › Kitchener › Rankings › Most bilingual Auditorium, #1 on this list · Photo: JFVoll (CC BY-SA 4.0) Kitchener · 2026 Most bilingual neighbourhoods in Kitchener Auditorium is #976 of 2,589 on the list for all of Canada. No neighbourhood in Kitchener makes the national top 100 on this list. First place in Kitchener goes to Auditorium, with 10.4%. Westmount takes second place with 10.2%; Central Frederick is third with 9.6%. At the halfway mark stands Idlewood, at 6.1%. Last comes Vanier, at 3.8%.
Share of residents who can hold a conversation in both English and French, 2021 census How grades work
#1 Overall B · #1,140 of 2,556
Strongest: health A , walkability A · lowest: cost of living D−
#2 Overall B+ · #803 of 2,556
Strongest: walkability A+ , health A · lowest: cost of living D−
#3 Overall B · #1,159 of 2,556
Strongest: walkability A+ , health A · lowest: cost of living D−
All 37 neighbourhoods, ranked Best first in Kitchener; beside each place, its rank on the same list for all of Canada.
Every Kitchener list # Neighbourhood English and French Canada rank What drives it
1 Auditorium 3,918 people 10.4% #976 of 2,589 Strongest: health A , walkability A · lowest: cost of living D− 2 Westmount 5,048 people 10.2% #990 of 2,589 Strongest: walkability A+ , health A · lowest: cost of living D− 3 Central Frederick 5,895 people 9.6% #1,038 of 2,589 Strongest: walkability A+ , health A · lowest: cost of living D− 4 Mt. Hope Huron Park 5,174 people 8.9% #1,102 of 2,589 Strongest: walkability A+ , health A · lowest: cost of living D− 5 Pioneer Tower West 4,122 people 8.6% #1,133 of 2,589 Strongest: health A , hazard risk A− · lowest: safety C+ 6 Victoria Park 3,574 people 8.6% #1,142 of 2,589 Strongest: walkability A+ , health A · lowest: cost of living D− 8 City Commercial Core 2,581 people 8.0% #1,212 of 2,589 Strongest: walkability A+ , health A · lowest: cost of living D 9 Cherry Hill 6,304 people 7.8% #1,241 of 2,589 Strongest: walkability A+ , health A · lowest: cost of living D− 10 Cedar Hill 3,190 people 7.8% #1,243 of 2,589 Strongest: walkability A+ , health A · lowest: cost of living D− 11 Bridgeport North 2,858 people 7.7% #1,249 of 2,589 Strongest: jobs & income A , health A · lowest: walkability D 12 Doon South 15,044 people 7.1% #1,369 of 2,589 Strongest: health A , hazard risk A− · lowest: cost of living C 13 Highland West 12,476 people 7.0% #1,386 of 2,589 Strongest: health A , hazard risk A− · lowest: cost of living C− 14 Stanley Park 8,721 people 6.8% #1,432 of 2,589 Strongest: health A , hazard risk A− · lowest: cost of living D− 15 Laurentian West 16,857 people 6.4% #1,511 of 2,589 Strongest: health A , hazard risk A− · lowest: cost of living C− 16 Grand River South 10,723 people 6.3% #1,534 of 2,589 Strongest: health A , jobs & income A · lowest: cost of living C 17 Huron South 5,555 people 6.3% #1,538 of 2,589 Strongest: health A , hazard risk A− · lowest: cost of living C− 18 Forest Hill 5,760 people 6.3% #1,546 of 2,589 Strongest: walkability A+ , health A · lowest: cost of living D− 19 Idlewood 5,005 people 6.1% #1,600 of 2,589 Strongest: health A , jobs & income A− · lowest: cost of living C 20 Rosenberg 9,831 people 6.1% #1,608 of 2,589 Strongest: health A , hazard risk A− · lowest: cost of living C− 22 Fairfield 3,497 people 5.9% #1,663 of 2,589 Strongest: health A , hazard risk A− · lowest: cost of living D− 23 Heritage Park 6,369 people 5.9% #1,666 of 2,589 Strongest: health A , walkability A · lowest: cost of living D− 24 Forest Heights 14,369 people 5.8% #1,687 of 2,589 Strongest: health A , hazard risk A− · lowest: cost of living C− 25 Bridgeport East 3,903 people 5.7% #1,718 of 2,589 Strongest: health A , hazard risk A− · lowest: cost of living D− 27 Centreville Chicopee 10,291 people 5.6% #1,746 of 2,589 Strongest: health A , walkability A · lowest: cost of living D− 28 Country Hills West 5,936 people 5.5% #1,773 of 2,589 Strongest: health A , hazard risk A− · lowest: cost of living D 29 Pioneer Park 8,781 people 5.0% #1,917 of 2,589 Strongest: health A , walkability A · lowest: cost of living D− 30 Southdale 5,277 people 4.8% #1,995 of 2,589 Strongest: health A , walkability A · lowest: cost of living D− 31 Rosemount 6,169 people 4.7% #2,018 of 2,589 Strongest: health A , walkability A · lowest: cost of living D− 32 Grand River North 3,823 people 4.5% #2,071 of 2,589 Strongest: jobs & income A , health A · lowest: cost of living C− 33 Alpine 3,055 people 4.4% #2,109 of 2,589 Strongest: walkability A , health A · lowest: cost of living D− 34 Victoria Hills 10,760 people 4.3% #2,148 of 2,589 Strongest: walkability A+ , health A · lowest: cost of living D− 35 Laurentian Hills 10,026 people 4.2% #2,179 of 2,589 Strongest: health A , walkability A− · lowest: cost of living D− 36 Country Hills 4,561 people 4.1% #2,202 of 2,589 Strongest: health A , walkability A · lowest: cost of living D− 37 Vanier 15,686 people 3.8% #2,287 of 2,589 Strongest: walkability A+ , health A · lowest: cost of living D− Rankings
More lists for Kitchener City by city
Most bilingual elsewhere Photos: Auditorium, JFVoll (CC BY-SA 4.0 ) · Central Frederick, JFVoll (CC BY-SA 4.0 ), via Wikimedia Commons.
Sources: TownRatings grades: our own summary of the data, ranking Canadian towns against each other only, run #73 of 10 November 2026. Under the Statistics Canada Open Licence.
Adapted from Statistics Canada (Census of Population 2021, population estimates 2025, 2021 census boundaries) under the Statistics Canada Open Licence; this does not constitute an endorsement by Statistics Canada. Neighbourhood names in some cities © OpenStreetMap contributors (ODbL).
 #1
 #3