Guest, Sign inJoin
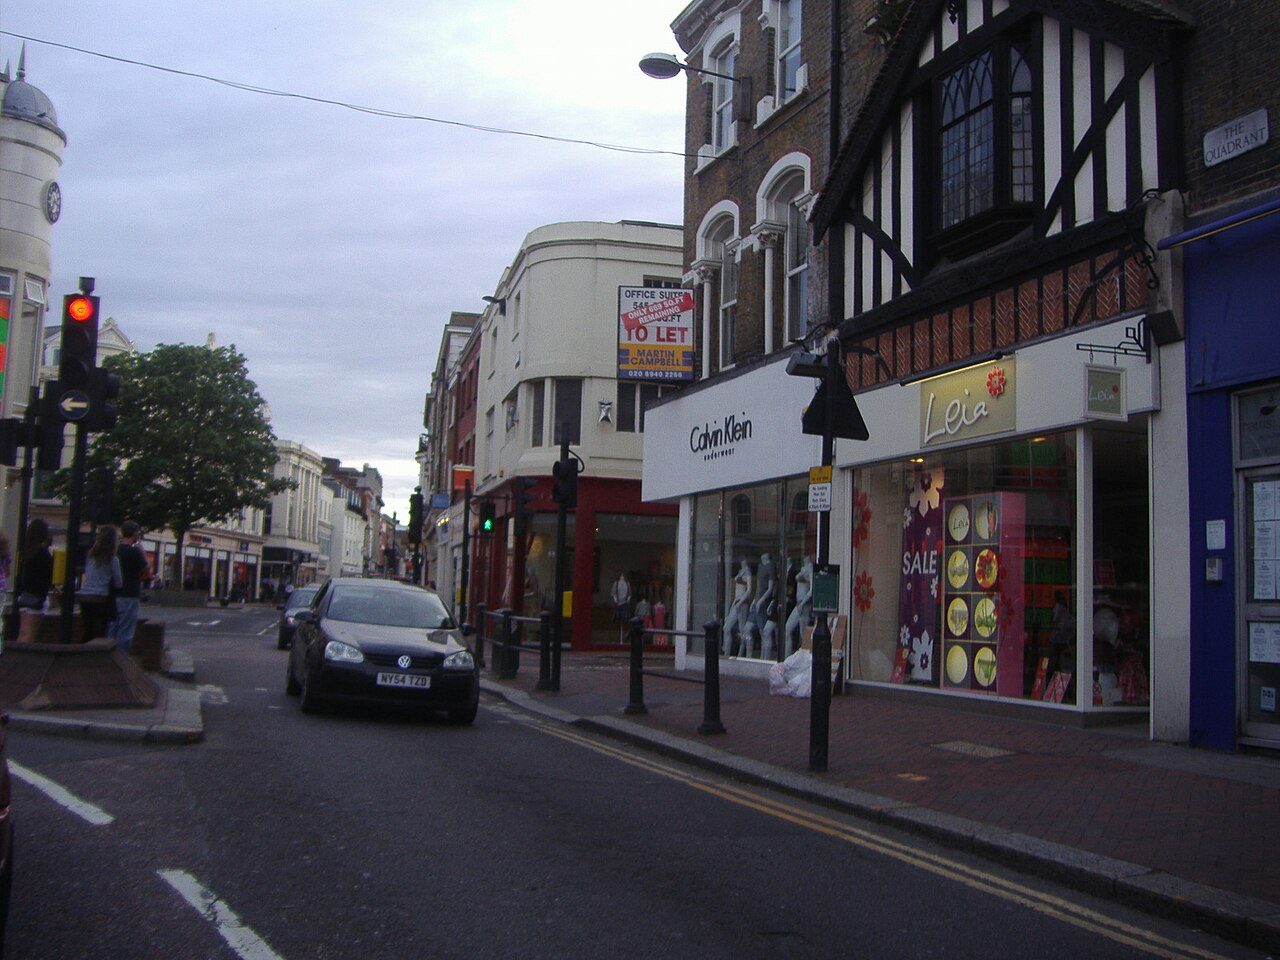
The Quadrant, Richmond town centreRichmond upon Thames, #1 on this list · Photo: David Howard · CC BY-SA 2.0
London rankings · Safety

Safest towns in London

Richmond upon Thames records the least crime per resident of London’s 33 boroughs with police.uk figures: 36.7 crimes per 1,000 residents a year (18.8 violent and sexual offences, 17.9 against homes and vehicles). 0 of the 33 grade A− or better on safety.

The Safety Grade: violent and sexual offences, burglary, vehicle crime and criminal damage recorded inside the town by police.uk, per 1,000 residents a year over three years, lowest first. The rank across England, Wales and Northern Ireland sits beside each letter. How grades work

#1

Richmond upon Thames

192,888 people
C+

36.7 crimes per 1,000 a year·18.8 violent and sexual, 17.9 homes and vehicles·#957 of 2,138 in England, Wales and Northern Ireland

#T2

Kingston upon Thames

166,333 people
C+

38.7 crimes per 1,000 a year·24.7 violent and sexual, 14.0 homes and vehicles·#1,050 of 2,138 in England, Wales and Northern Ireland

#T2

Harrow

260,534 people
C+

38.8 crimes per 1,000 a year·23.3 violent and sexual, 15.4 homes and vehicles·#1,051 of 2,138 in England, Wales and Northern Ireland

All 33 boroughs, ranked

Crimes per 1,000 residents a year, lowest first; the sort uses the exact rate. Military garrison towns and university campuses keep their grades but aren’t ranked. Each rank across England, Wales and Northern Ireland links to the national list.

London’s boroughs →

33 boroughs.

#TownGrade · UK rankCrime rate
1Richmond upon Thames192,888 peopleC+#957 of 2,138 nationally36.7 crimes per 1,000 a year·18.8 violent and sexual, 17.9 homes and vehicles
T2Kingston upon Thames166,333 peopleC+#1,050 of 2,138 nationally38.7 crimes per 1,000 a year·24.7 violent and sexual, 14.0 homes and vehicles
T2Harrow260,534 peopleC+#1,051 of 2,138 nationally38.8 crimes per 1,000 a year·23.3 violent and sexual, 15.4 homes and vehicles
T2Merton214,931 peopleC+#1,059 of 2,138 nationally39.0 crimes per 1,000 a year·24.2 violent and sexual, 14.8 homes and vehicles
5Sutton208,858 peopleC#1,197 of 2,138 nationally41.7 crimes per 1,000 a year·27.1 violent and sexual, 14.6 homes and vehicles
6Bexley246,074 peopleC#1,266 of 2,138 nationally43.6 crimes per 1,000 a year·26.1 violent and sexual, 17.5 homes and vehicles
T7Barnet388,572 peopleC#1,366 of 2,138 nationally46.3 crimes per 1,000 a year·25.3 violent and sexual, 21.0 homes and vehicles
T7Bromley325,469 peopleC#1,373 of 2,138 nationally46.5 crimes per 1,000 a year·25.7 violent and sexual, 20.8 homes and vehicles
T9Wandsworth326,725 peopleC#1,375 of 2,138 nationally46.5 crimes per 1,000 a year·27.7 violent and sexual, 18.9 homes and vehicles
T9Havering259,401 peopleC#1,387 of 2,138 nationally47.1 crimes per 1,000 a year·29.0 violent and sexual, 18.1 homes and vehicles
11Redbridge309,509 peopleC−#1,453 of 2,138 nationally48.8 crimes per 1,000 a year·31.1 violent and sexual, 17.7 homes and vehicles
12Waltham Forest278,129 peopleC−#1,476 of 2,138 nationally49.6 crimes per 1,000 a year·28.5 violent and sexual, 21.0 homes and vehicles
13Ealing367,271 peopleC−#1,663 of 2,138 nationally55.8 crimes per 1,000 a year·33.6 violent and sexual, 22.2 homes and vehicles
T14Hillingdon307,089 peopleC−#1,682 of 2,138 nationally56.4 crimes per 1,000 a year·33.4 violent and sexual, 23.0 homes and vehicles
T14Enfield329,822 peopleC−#1,687 of 2,138 nationally56.6 crimes per 1,000 a year·32.6 violent and sexual, 24.0 homes and vehicles
T14Brent340,611 peopleC−#1,690 of 2,138 nationally56.7 crimes per 1,000 a year·35.8 violent and sexual, 20.8 homes and vehicles
T14Hounslow286,591 peopleC−#1,692 of 2,138 nationally56.7 crimes per 1,000 a year·35.2 violent and sexual, 21.5 homes and vehicles
18Croydon389,242 peopleD#1,694 of 2,138 nationally56.9 crimes per 1,000 a year·36.3 violent and sexual, 20.5 homes and vehicles
19Greenwich288,117 peopleD#1,755 of 2,138 nationally59.2 crimes per 1,000 a year·38.3 violent and sexual, 20.8 homes and vehicles
T20Lewisham300,764 peopleD#1,771 of 2,138 nationally60.0 crimes per 1,000 a year·38.8 violent and sexual, 21.2 homes and vehicles
T20Barking and Dagenham218,236 peopleD#1,776 of 2,138 nationally60.4 crimes per 1,000 a year·40.5 violent and sexual, 20.0 homes and vehicles
T22Lambeth317,108 peopleD#1,793 of 2,138 nationally61.4 crimes per 1,000 a year·40.1 violent and sexual, 21.2 homes and vehicles
T22Newham351,065 peopleD#1,803 of 2,138 nationally61.9 crimes per 1,000 a year·38.9 violent and sexual, 23.0 homes and vehicles
T22Southwark307,076 peopleD#1,807 of 2,138 nationally62.1 crimes per 1,000 a year·40.0 violent and sexual, 22.1 homes and vehicles
T22Hackney258,464 peopleD#1,814 of 2,138 nationally62.4 crimes per 1,000 a year·40.5 violent and sexual, 21.9 homes and vehicles
T26Hammersmith and Fulham182,187 peopleD#1,824 of 2,138 nationally62.8 crimes per 1,000 a year·39.2 violent and sexual, 23.5 homes and vehicles
T26Haringey264,069 peopleD#1,834 of 2,138 nationally63.0 crimes per 1,000 a year·38.4 violent and sexual, 24.6 homes and vehicles
28Tower Hamlets311,072 peopleD#1,879 of 2,138 nationally66.3 crimes per 1,000 a year·43.3 violent and sexual, 23.0 homes and vehicles
29Islington216,309 peopleD#1,910 of 2,138 nationally68.4 crimes per 1,000 a year·44.1 violent and sexual, 24.3 homes and vehicles
30Kensington and Chelsea143,348 peopleD#1,941 of 2,138 nationally71.4 crimes per 1,000 a year·39.4 violent and sexual, 32.0 homes and vehicles
31Camden209,342 peopleD−#2,025 of 2,138 nationally79.3 crimes per 1,000 a year·48.8 violent and sexual, 30.5 homes and vehicles
T32Westminster203,571 peopleD−#2,134 of 2,138 nationally123.7 crimes per 1,000 a year·81.4 violent and sexual, 42.2 homes and vehicles
T32City of London7,820 peopleD−#2,138 of 2,138 nationally364.3 crimes per 1,000 a year·252.8 violent and sexual, 111.5 homes and vehicles
Quick answers

Questions people ask

What is the safest town in London?

Richmond upon Thames ranks first on safety among 33 towns, with a C+: 36.7 crimes per 1,000 residents a year (18.8 violent and sexual offences, 17.9 against homes and vehicles). Kingston upon Thames and Harrow follow.

How are these towns ranked?

The Safety Grade: violent and sexual offences, burglary, vehicle crime and criminal damage recorded inside the town by police.uk, per 1,000 residents a year over three years, lowest first. The letter and rank are the same as on each town’s page. How grades work.

Why isn’t my town on this list?

Garrison towns and university campuses aren’t ranked, and towns without the figures this grade needs are counted above. The list covers London’s towns of 2,500+ with the figure. Smaller places show it on their own pages; every town in London is on the county page.

Go deeper

More London lists

Every list ranks the same 2,500+ boroughs, so a borough’s rank means the same thing on each.

All London rankings →
County by county

Safest towns, county by county

Sources: data.police.uk street-level crime, 36 months to August 2026, points inside the built-up-area boundary · TownRatings grades: our own summary of the data, ranked against UK towns only. All under the Open Government Licence v3.0.

Contains public sector information licensed under the Open Government Licence v3.0. Contains HM Land Registry data © Crown copyright and database right 2026. Contains OS data © Crown copyright and database right 2026 (ONS boundaries). Northern Ireland: Source: NISRA; contains Land & Property Services data and Ordnance Survey of Northern Ireland information, © Crown copyright, licensed under the Open Government Licence v3.0. Scotland: contains National Records of Scotland data, Registers of Scotland data and SEPA data, © Crown copyright / © SEPA 2025, licensed under the Open Government Licence v3.0.