Guest, Sign inJoin
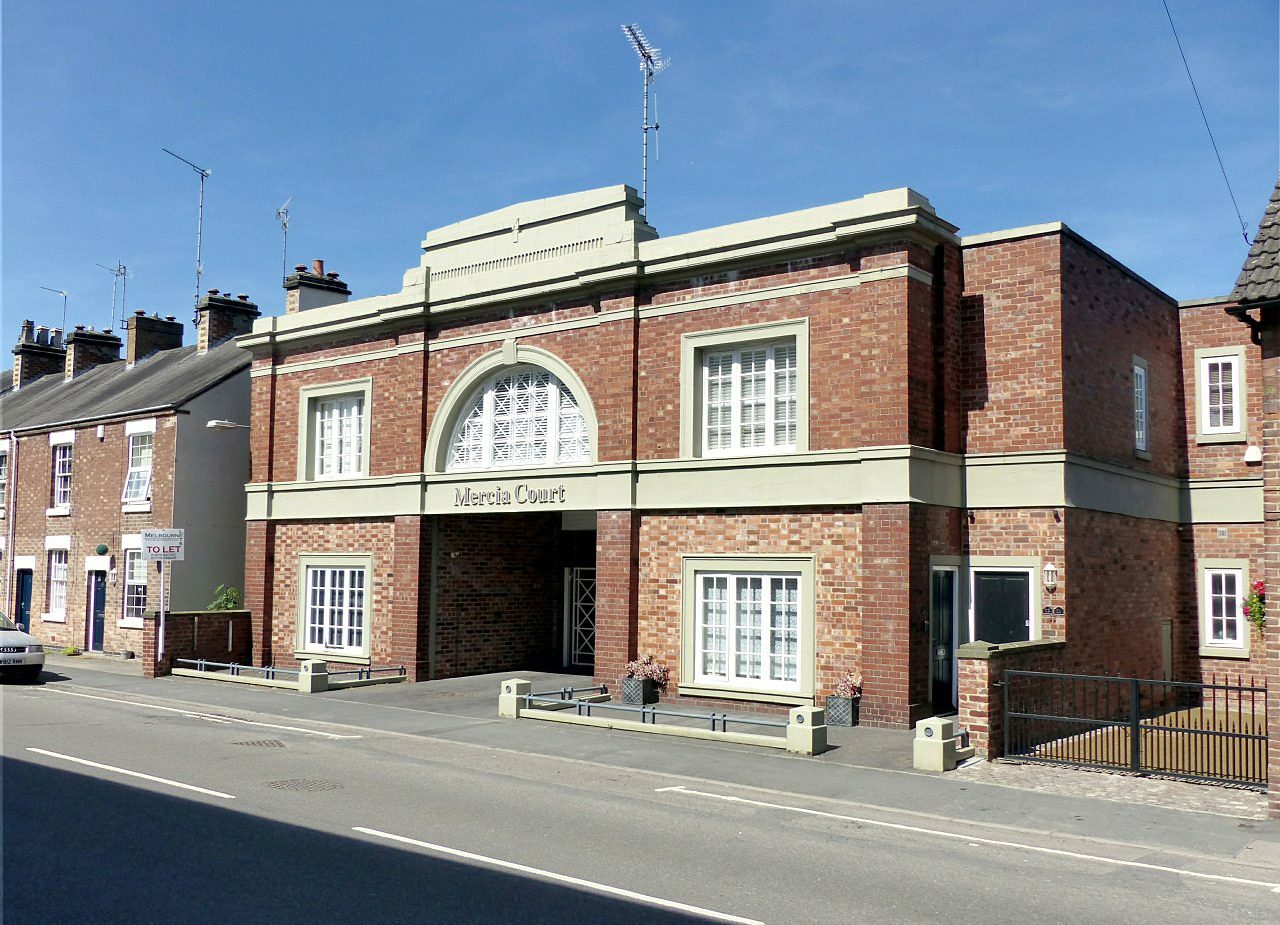
Mercia Court, High Street, ReptonRepton, #1 on this list · Photo: Alan Murray-Rust · CC BY-SA 2.0
Derbyshire rankings · Safety

Safest towns in Derbyshire

Repton records the least crime per resident of Derbyshire’s 59 towns of 2,500+ with police.uk figures: 20.5 crimes per 1,000 residents a year (14.9 violent and sexual offences, 5.5 against homes and vehicles). 5 of the 59 grade A− or better on safety.

The Safety Grade: violent and sexual offences, burglary, vehicle crime and criminal damage recorded inside the town by police.uk, per 1,000 residents a year over three years, lowest first. The rank across England, Wales and Northern Ireland sits beside each letter. How grades work

#1

Repton

2,766 people
A−

20.5 crimes per 1,000 a year·14.9 violent and sexual, 5.5 homes and vehicles·#156 of 2,138 in England, Wales and Northern Ireland

#T2

Wingerworth

6,404 people
A−

20.6 crimes per 1,000 a year·14.9 violent and sexual, 5.6 homes and vehicles·#160 of 2,138 in England, Wales and Northern Ireland

#T2

West Hallam

5,912 people
A−

20.8 crimes per 1,000 a year·14.9 violent and sexual, 5.8 homes and vehicles·#166 of 2,138 in England, Wales and Northern Ireland

All 59 towns, ranked

Crimes per 1,000 residents a year, lowest first; the sort uses the exact rate. Military garrison towns and university campuses keep their grades but aren’t ranked. Each rank across England, Wales and Northern Ireland links to the national list.

Every town in Derbyshire →

59 towns.

#TownGrade · UK rankCrime rate
1Repton2,766 peopleA−#156 of 2,138 nationally20.5 crimes per 1,000 a year·14.9 violent and sexual, 5.5 homes and vehicles
T2Wingerworth6,404 peopleA−#160 of 2,138 nationally20.6 crimes per 1,000 a year·14.9 violent and sexual, 5.6 homes and vehicles
T2West Hallam5,912 peopleA−#166 of 2,138 nationally20.8 crimes per 1,000 a year·14.9 violent and sexual, 5.8 homes and vehicles
4Makeney4,691 peopleA−#179 of 2,138 nationally21.2 crimes per 1,000 a year·15.8 violent and sexual, 5.5 homes and vehicles
5Heage2,584 peopleA−#255 of 2,138 nationally23.2 crimes per 1,000 a year·18.3 violent and sexual, 4.9 homes and vehicles
6Melbourne4,860 peopleB+#285 of 2,138 nationally23.9 crimes per 1,000 a year·17.2 violent and sexual, 6.7 homes and vehicles
7Dronfield21,161 peopleB+#309 of 2,138 nationally24.4 crimes per 1,000 a year·15.9 violent and sexual, 8.5 homes and vehicles
8Hadfield16,271 peopleB+#327 of 2,138 nationally24.8 crimes per 1,000 a year·17.5 violent and sexual, 7.3 homes and vehicles
9Hilton8,269 peopleB+#373 of 2,138 nationally25.7 crimes per 1,000 a year·19.8 violent and sexual, 5.9 homes and vehicles
10Willington2,717 peopleB+#400 of 2,138 nationally26.4 crimes per 1,000 a year·19.4 violent and sexual, 7.0 homes and vehicles
11Etwall3,080 peopleB#529 of 2,138 nationally28.6 crimes per 1,000 a year·22.8 violent and sexual, 5.7 homes and vehicles
12Darley Dale3,985 peopleB#563 of 2,138 nationally29.2 crimes per 1,000 a year·22.2 violent and sexual, 7.0 homes and vehicles
13Borrowash7,171 peopleB#611 of 2,138 nationally30.0 crimes per 1,000 a year·21.4 violent and sexual, 8.6 homes and vehicles
14Whaley Bridge4,618 peopleB−#681 of 2,138 nationally31.3 crimes per 1,000 a year·22.4 violent and sexual, 9.0 homes and vehicles
T15Kilburn and Horsley Woodhouse4,447 peopleB−#684 of 2,138 nationally31.4 crimes per 1,000 a year·22.6 violent and sexual, 8.8 homes and vehicles
T15Breaston and Draycott7,393 peopleB−#707 of 2,138 nationally31.8 crimes per 1,000 a year·22.6 violent and sexual, 9.2 homes and vehicles
17Belper19,076 peopleB−#741 of 2,138 nationally32.3 crimes per 1,000 a year·25.6 violent and sexual, 6.7 homes and vehicles
18Hatton2,560 peopleB−#769 of 2,138 nationally32.8 crimes per 1,000 a year·24.7 violent and sexual, 8.1 homes and vehicles
19Chapel-en-le-Frith7,235 peopleB−#801 of 2,138 nationally33.5 crimes per 1,000 a year·26.6 violent and sexual, 6.9 homes and vehicles
20Overseal and Castle Gresley5,055 peopleB−#821 of 2,138 nationally33.8 crimes per 1,000 a year·21.9 violent and sexual, 11.9 homes and vehicles
21Killamarsh9,082 peopleB−#839 of 2,138 nationally34.0 crimes per 1,000 a year·23.5 violent and sexual, 10.5 homes and vehicles
T22Wirksworth4,904 peopleC+#903 of 2,138 nationally35.8 crimes per 1,000 a year·25.9 violent and sexual, 9.9 homes and vehicles
T22New Mills9,195 peopleC+#905 of 2,138 nationally35.9 crimes per 1,000 a year·27.0 violent and sexual, 8.8 homes and vehicles
T22Barlborough2,859 peopleC+#911 of 2,138 nationally35.9 crimes per 1,000 a year·19.0 violent and sexual, 16.9 homes and vehicles
T25Glossop17,820 peopleC+#986 of 2,138 nationally37.3 crimes per 1,000 a year·28.0 violent and sexual, 9.3 homes and vehicles
T25Pilsley and Lower Pilsley3,470 peopleC+#993 of 2,138 nationally37.5 crimes per 1,000 a year·30.6 violent and sexual, 6.9 homes and vehicles
27Ashbourne8,854 peopleC+#1,062 of 2,138 nationally39.1 crimes per 1,000 a year·30.8 violent and sexual, 8.3 homes and vehicles
28Bakewell3,275 peopleC+#1,077 of 2,138 nationally39.4 crimes per 1,000 a year·28.5 violent and sexual, 10.9 homes and vehicles
29Shirland and Stonebroom3,988 peopleC+#1,111 of 2,138 nationally40.0 crimes per 1,000 a year·31.8 violent and sexual, 8.2 homes and vehicles
30Matlock11,990 peopleC#1,200 of 2,138 nationally41.8 crimes per 1,000 a year·33.1 violent and sexual, 8.7 homes and vehicles
31Sandiacre9,373 peopleC#1,220 of 2,138 nationally42.2 crimes per 1,000 a year·33.1 violent and sexual, 9.1 homes and vehicles
T32Tibshelf4,352 peopleC#1,265 of 2,138 nationally43.5 crimes per 1,000 a year·33.8 violent and sexual, 9.7 homes and vehicles
T32Newton and Blackwell3,053 peopleC#1,269 of 2,138 nationally43.7 crimes per 1,000 a year·29.3 violent and sexual, 14.4 homes and vehicles
34Eckington7,435 peopleC#1,333 of 2,138 nationally45.3 crimes per 1,000 a year·33.7 violent and sexual, 11.7 homes and vehicles
T35South Normanton and Pinxton16,028 peopleC#1,359 of 2,138 nationally46.0 crimes per 1,000 a year·33.1 violent and sexual, 12.9 homes and vehicles
T35Whitwell3,722 peopleC#1,368 of 2,138 nationally46.3 crimes per 1,000 a year·30.4 violent and sexual, 15.8 homes and vehicles
37Long Eaton37,815 peopleC−#1,480 of 2,138 nationally49.7 crimes per 1,000 a year·37.6 violent and sexual, 12.1 homes and vehicles
T38Old Tupton4,190 peopleC−#1,496 of 2,138 nationally50.3 crimes per 1,000 a year·39.5 violent and sexual, 10.7 homes and vehicles
T38Brimington11,068 peopleC−#1,506 of 2,138 nationally50.6 crimes per 1,000 a year·40.4 violent and sexual, 10.2 homes and vehicles
T38Langwith3,009 peopleC−#1,516 of 2,138 nationally51.0 crimes per 1,000 a year·34.6 violent and sexual, 16.4 homes and vehicles
T41Woodville7,255 peopleC−#1,584 of 2,138 nationally52.8 crimes per 1,000 a year·38.4 violent and sexual, 14.4 homes and vehicles
T41Swadlincote34,569 peopleC−#1,600 of 2,138 nationally53.3 crimes per 1,000 a year·40.6 violent and sexual, 12.7 homes and vehicles
T43Clowne7,759 peopleC−#1,615 of 2,138 nationally53.7 crimes per 1,000 a year·40.1 violent and sexual, 13.6 homes and vehicles
T43Somercotes and Swanwick15,105 peopleC−#1,628 of 2,138 nationally54.1 crimes per 1,000 a year·41.4 violent and sexual, 12.8 homes and vehicles
45Gamesley3,124 peopleC−#1,655 of 2,138 nationally55.4 crimes per 1,000 a year·39.6 violent and sexual, 15.8 homes and vehicles
T46Buxton20,048 peopleD#1,723 of 2,138 nationally57.9 crimes per 1,000 a year·43.8 violent and sexual, 14.1 homes and vehicles
T46Staveley15,151 peopleD#1,726 of 2,138 nationally58.1 crimes per 1,000 a year·44.7 violent and sexual, 13.3 homes and vehicles
T48Heanor24,264 peopleD#1,791 of 2,138 nationally61.3 crimes per 1,000 a year·45.3 violent and sexual, 16.0 homes and vehicles
T48Bolsover11,228 peopleD#1,811 of 2,138 nationally62.3 crimes per 1,000 a year·42.8 violent and sexual, 19.5 homes and vehicles
T50Shirebrook11,571 peopleD#1,858 of 2,138 nationally64.9 crimes per 1,000 a year·50.2 violent and sexual, 14.7 homes and vehicles
T50Ripley20,191 peopleD#1,876 of 2,138 nationally66.1 crimes per 1,000 a year·52.2 violent and sexual, 13.8 homes and vehicles
T50North Wingfield and Holmewood9,545 peopleD#1,877 of 2,138 nationally66.2 crimes per 1,000 a year·48.8 violent and sexual, 17.4 homes and vehicles
T53Grassmoor3,528 peopleD#1,920 of 2,138 nationally69.5 crimes per 1,000 a year·55.3 violent and sexual, 14.3 homes and vehicles
T53Creswell5,792 peopleD#1,935 of 2,138 nationally71.1 crimes per 1,000 a year·53.1 violent and sexual, 18.0 homes and vehicles
T55Ilkeston38,723 peopleD#1,951 of 2,138 nationally72.2 crimes per 1,000 a year·55.0 violent and sexual, 17.2 homes and vehicles
T55Chesterfield76,394 peopleD#1,967 of 2,138 nationally73.3 crimes per 1,000 a year·56.2 violent and sexual, 17.1 homes and vehicles
T57Clay Cross8,915 peopleD#1,974 of 2,138 nationally73.6 crimes per 1,000 a year·58.7 violent and sexual, 14.9 homes and vehicles
T57Alfreton8,790 peopleD#1,981 of 2,138 nationally74.3 crimes per 1,000 a year·57.0 violent and sexual, 17.2 homes and vehicles
T57Derby275,561 peopleD#1,988 of 2,138 nationally74.8 crimes per 1,000 a year·57.0 violent and sexual, 17.8 homes and vehicles
Quick answers

Questions people ask

What is the safest town in Derbyshire?

Repton ranks first on safety among 59 towns, with an A−: 20.5 crimes per 1,000 residents a year (14.9 violent and sexual offences, 5.5 against homes and vehicles). Wingerworth and West Hallam follow.

How are these towns ranked?

The Safety Grade: violent and sexual offences, burglary, vehicle crime and criminal damage recorded inside the town by police.uk, per 1,000 residents a year over three years, lowest first. The letter and rank are the same as on each town’s page. How grades work.

Why isn’t my town on this list?

Garrison towns and university campuses aren’t ranked, and towns without the figures this grade needs are counted above. The list covers Derbyshire’s towns of 2,500+ with the figure. Smaller places show it on their own pages; every town in Derbyshire is on the county page.

Go deeper

More Derbyshire lists

Every list ranks the same 2,500+ towns, so a town’s rank means the same thing on each.

All Derbyshire rankings →
County by county

Safest towns, county by county

Sources: data.police.uk street-level crime, 36 months to August 2026, points inside the built-up-area boundary · TownRatings grades: our own summary of the data, ranked against UK towns only. All under the Open Government Licence v3.0.

Contains public sector information licensed under the Open Government Licence v3.0. Contains HM Land Registry data © Crown copyright and database right 2026. Contains OS data © Crown copyright and database right 2026 (ONS boundaries). Northern Ireland: Source: NISRA; contains Land & Property Services data and Ordnance Survey of Northern Ireland information, © Crown copyright, licensed under the Open Government Licence v3.0. Scotland: contains National Records of Scotland data, Registers of Scotland data and SEPA data, © Crown copyright / © SEPA 2025, licensed under the Open Government Licence v3.0.