Guest, Sign inJoin
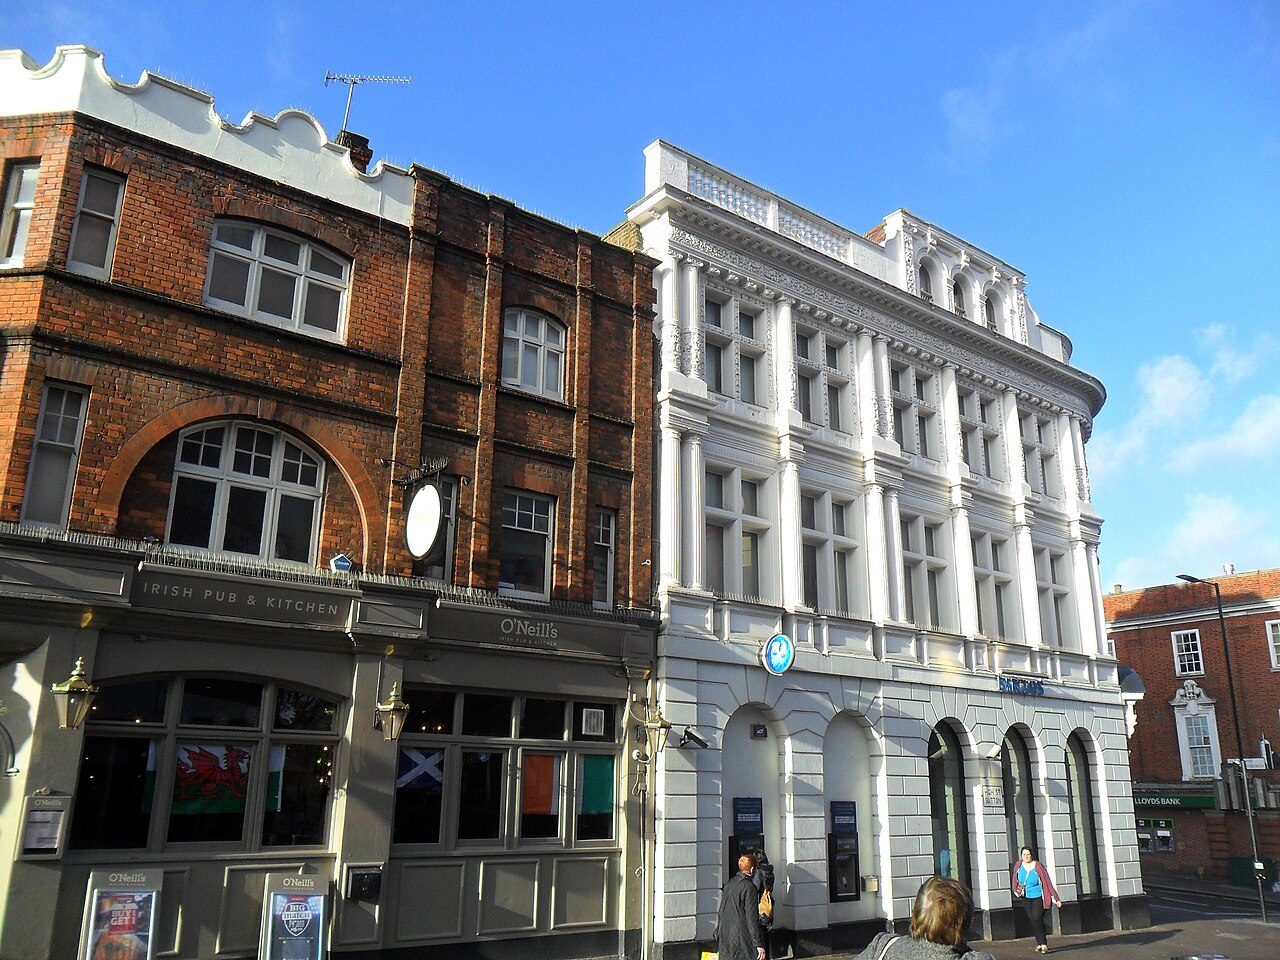
Sutton, Surrey London Sutton High Street -Sutton, #1 on this list · Photo: A P Monblat · CC BY-SA 3.0
London rankings · Cost of living

Most affordable towns in London

Sutton ranks first on cost of living among London’s 33 boroughs; 1 of the 33 grade A− or better against UK towns.

The Cost of living Grade: the median sale price (Land Registry), a year’s private rent (ONS) and Band D council tax with the parish precept, each against the mean household income of the town’s council area. The rank across England, Scotland, Wales and Northern Ireland sits beside each letter. How grades work

#1

Sutton

208,858 people
A−

Homes cost 5.5 years of area income·#536 of 2,515 in England, Scotland, Wales and Northern Ireland

#2

Bromley

325,469 people
B+

Homes cost 5.9 years of area income·#883 of 2,515 in England, Scotland, Wales and Northern Ireland

#3

Bexley

246,074 people
B+

Homes cost 5.6 years of area income·#917 of 2,515 in England, Scotland, Wales and Northern Ireland

All 33 boroughs, ranked

Cost of living grade, best first; ranks are the county ranks on each town’s page (T = tied). Military garrison towns and university campuses keep their grades but aren’t ranked. Each rank across England, Scotland, Wales and Northern Ireland links to the national list.

London’s boroughs →

33 boroughs.

#TownGrade · UK rankCompared with UK towns
1Sutton208,858 peopleA−#536 of 2,515 nationallyhomes cost 5.5 years of area income
2Bromley325,469 peopleB+#883 of 2,515 nationallyhomes cost 5.9 years of area income
3Bexley246,074 peopleB+#917 of 2,515 nationallyhomes cost 5.6 years of area income
4Kingston upon Thames166,333 peopleB#1,079 of 2,515 nationallyhomes cost 6.0 years of area income
5Havering259,401 peopleB#1,252 of 2,515 nationallyhomes cost 6.0 years of area income
6Croydon389,242 peopleB#1,312 of 2,515 nationallyhomes cost 5.7 years of area income
7Hillingdon307,089 peopleB−#1,389 of 2,515 nationallyhomes cost 6.6 years of area income
8Barking and Dagenham218,236 peopleC+#1,619 of 2,515 nationallyhomes cost 5.8 years of area income
9Greenwich288,117 peopleC+#1,735 of 2,515 nationallyhomes cost 6.3 years of area income
T10Merton214,931 peopleC+#1,745 of 2,515 nationallyhomes cost 6.5 years of area income
T10Redbridge309,509 peopleC+#1,745 of 2,515 nationallyhomes cost 6.7 years of area income
12Richmond upon Thames192,888 peopleC+#1,760 of 2,515 nationallyhomes cost 7.0 years of area income
13Lewisham300,764 peopleC+#1,768 of 2,515 nationallyhomes cost 6.4 years of area income
14Hounslow286,591 peopleC#1,800 of 2,515 nationallyhomes cost 6.6 years of area income
15Harrow260,534 peopleC#1,844 of 2,515 nationallyhomes cost 7.1 years of area income
16Tower Hamlets311,072 peopleC#1,900 of 2,515 nationallyhomes cost 6.9 years of area income
17Newham351,065 peopleC#1,915 of 2,515 nationallyhomes cost 6.9 years of area income
18Barnet388,572 peopleC#1,923 of 2,515 nationallyhomes cost 7.4 years of area income
19Enfield329,822 peopleC#1,925 of 2,515 nationallyhomes cost 6.8 years of area income
20Ealing367,271 peopleC#1,975 of 2,515 nationallyhomes cost 7.3 years of area income
21Southwark307,076 peopleC#1,983 of 2,515 nationallyhomes cost 7.4 years of area income
22Lambeth317,108 peopleC−#1,991 of 2,515 nationallyhomes cost 7.4 years of area income
23Wandsworth326,725 peopleC−#2,011 of 2,515 nationallyhomes cost 7.6 years of area income
24Waltham Forest278,129 peopleC−#2,020 of 2,515 nationallyhomes cost 7.5 years of area income
25City of London7,820 peopleC−#2,059 of 2,515 nationallyhomes cost 8.7 years of area income
T26Hackney258,464 peopleC−#2,117 of 2,515 nationallyhomes cost 8.5 years of area income
T26Haringey264,069 peopleC−#2,117 of 2,515 nationallyhomes cost 8.0 years of area income
28Islington216,309 peopleC−#2,142 of 2,515 nationallyhomes cost 9.1 years of area income
29Hammersmith and Fulham182,187 peopleC−#2,155 of 2,515 nationallyhomes cost 10.1 years of area income
30Camden209,342 peopleC−#2,176 of 2,515 nationallyhomes cost 10.2 years of area income
31Westminster203,571 peopleC−#2,186 of 2,515 nationallyhomes cost 12.4 years of area income
32Kensington and Chelsea143,348 peopleC−#2,196 of 2,515 nationallyhomes cost 15.1 years of area income
33Brent340,611 peopleD#2,216 of 2,515 nationallyhomes cost 8.6 years of area income
Quick answers

Questions people ask

What is the most affordable town in London?

Sutton ranks first on cost of living among 33 towns, with an A−: homes cost 5.5 years of area income. Bromley and Bexley follow.

How are these towns ranked?

The Cost of living Grade: the median sale price (Land Registry), a year’s private rent (ONS) and Band D council tax with the parish precept, each against the mean household income of the town’s council area. The letter and rank are the same as on each town’s page. How grades work.

Why isn’t my town on this list?

Garrison towns and university campuses aren’t ranked, and towns without the figures this grade needs are counted above. The list covers London’s towns of 2,500+ with the figure. Smaller places show it on their own pages; every town in London is on the county page.

Go deeper

More London lists

Every list ranks the same 2,500+ boroughs, so a borough’s rank means the same thing on each.

All London rankings →
County by county

Most affordable towns, county by county

Sources: HM Land Registry Price Paid (standard sales, September 2023 to August 2026) · ONS Price Index of Private Rents (August 2026, by council) · MHCLG and Welsh Government council tax, Band D 2026–27 (with parish precepts in England) · ONS small-area income estimates (financial year ending 2023) · TownRatings grades: our own summary of the data, ranked against UK towns only. All under the Open Government Licence v3.0.

Contains public sector information licensed under the Open Government Licence v3.0. Contains HM Land Registry data © Crown copyright and database right 2026. Contains OS data © Crown copyright and database right 2026 (ONS boundaries). Northern Ireland: Source: NISRA; contains Land & Property Services data and Ordnance Survey of Northern Ireland information, © Crown copyright, licensed under the Open Government Licence v3.0. Scotland: contains National Records of Scotland data, Registers of Scotland data and SEPA data, © Crown copyright / © SEPA 2025, licensed under the Open Government Licence v3.0.