Guest, Sign inJoin
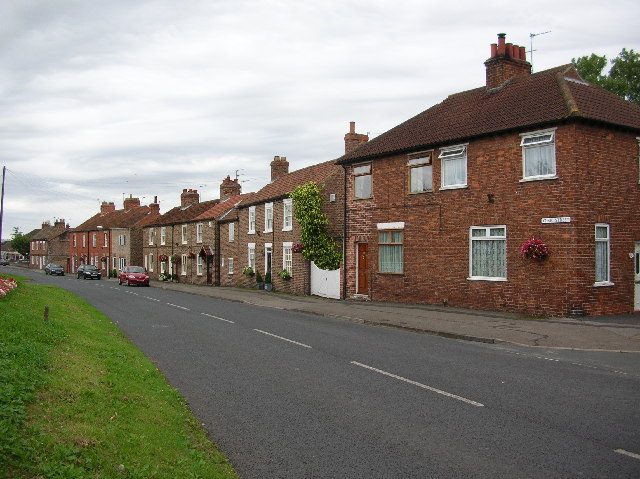
York Street, DunningtonDunnington, #1 on this list · Photo: DS Pugh · CC BY-SA 2.0
North Yorkshire rankings · Safety

Safest towns in North Yorkshire

Dunnington records the least crime per resident of North Yorkshire’s 54 towns of 2,500+ with police.uk figures: 9.4 crimes per 1,000 residents a year (5.3 violent and sexual offences, 4.1 against homes and vehicles). 12 of the 54 grade A− or better on safety.

The Safety Grade: violent and sexual offences, burglary, vehicle crime and criminal damage recorded inside the town by police.uk, per 1,000 residents a year over three years, lowest first. The rank across England, Wales and Northern Ireland sits beside each letter. How grades work

#1

Dunnington

3,256 people
A+

9.4 crimes per 1,000 a year·5.3 violent and sexual, 4.1 homes and vehicles·#3 of 2,138 in England, Wales and Northern Ireland

#T2

Upper Poppleton

3,520 people
A+

10.8 crimes per 1,000 a year·7.1 violent and sexual, 3.7 homes and vehicles·#7 of 2,138 in England, Wales and Northern Ireland

#T2

Copmanthorpe

3,671 people
A+

11.4 crimes per 1,000 a year·8.4 violent and sexual, 3.0 homes and vehicles·#10 of 2,138 in England, Wales and Northern Ireland

All 54 towns, ranked

Crimes per 1,000 residents a year, lowest first; the sort uses the exact rate. Military garrison towns and university campuses keep their grades but aren’t ranked. Each rank across England, Wales and Northern Ireland links to the national list.

Every town in North Yorkshire →

54 towns.

#TownGrade · UK rankCrime rate
1Dunnington3,256 peopleA+#3 of 2,138 nationally9.4 crimes per 1,000 a year·5.3 violent and sexual, 4.1 homes and vehicles
T2Upper Poppleton3,520 peopleA+#7 of 2,138 nationally10.8 crimes per 1,000 a year·7.1 violent and sexual, 3.7 homes and vehicles
T2Copmanthorpe3,671 peopleA+#10 of 2,138 nationally11.4 crimes per 1,000 a year·8.4 violent and sexual, 3.0 homes and vehicles
4Pannal2,530 peopleA+#17 of 2,138 nationally13.2 crimes per 1,000 a year·9.1 violent and sexual, 4.1 homes and vehicles
5Bishopthorpe3,333 peopleA+#24 of 2,138 nationally13.9 crimes per 1,000 a year·10.0 violent and sexual, 3.9 homes and vehicles
6Brayton4,092 peopleA#63 of 2,138 nationally17.0 crimes per 1,000 a year·12.6 violent and sexual, 4.4 homes and vehicles
7Haxby10,176 peopleA#68 of 2,138 nationally17.1 crimes per 1,000 a year·11.7 violent and sexual, 5.4 homes and vehicles
8Strensall6,060 peopleA#88 of 2,138 nationally18.0 crimes per 1,000 a year·14.5 violent and sexual, 3.5 homes and vehicles
9Romanby3,825 peopleA−#119 of 2,138 nationally19.3 crimes per 1,000 a year·14.2 violent and sexual, 5.0 homes and vehicles
10Ingleby Barwick23,380 peopleA−#168 of 2,138 nationally20.8 crimes per 1,000 a year·15.2 violent and sexual, 5.6 homes and vehicles
11East Ayton and West Ayton2,809 peopleA−#205 of 2,138 nationally22.1 crimes per 1,000 a year·17.8 violent and sexual, 4.3 homes and vehicles
12Great Ayton4,348 peopleA−#216 of 2,138 nationally22.3 crimes per 1,000 a year·12.9 violent and sexual, 9.4 homes and vehicles
13Thorpe Willoughby3,482 peopleB+#259 of 2,138 nationally23.4 crimes per 1,000 a year·19.2 violent and sexual, 4.2 homes and vehicles
14Settle2,710 peopleB+#277 of 2,138 nationally23.8 crimes per 1,000 a year·15.8 violent and sexual, 8.0 homes and vehicles
15Hunmanby2,900 peopleB#509 of 2,138 nationally28.3 crimes per 1,000 a year·20.6 violent and sexual, 7.7 homes and vehicles
16Cross Hills4,809 peopleB#592 of 2,138 nationally29.6 crimes per 1,000 a year·20.2 violent and sexual, 9.4 homes and vehicles
17Norton-on-Derwent7,909 peopleB#639 of 2,138 nationally30.4 crimes per 1,000 a year·23.0 violent and sexual, 7.4 homes and vehicles
T18Sutton-in-Craven2,719 peopleB−#694 of 2,138 nationally31.6 crimes per 1,000 a year·21.8 violent and sexual, 9.8 homes and vehicles
T18Huntington12,420 peopleB−#700 of 2,138 nationally31.7 crimes per 1,000 a year·23.1 violent and sexual, 8.6 homes and vehicles
T20Ripon16,593 peopleB−#716 of 2,138 nationally31.9 crimes per 1,000 a year·23.8 violent and sexual, 8.1 homes and vehicles
T20Tadcaster6,339 peopleB−#721 of 2,138 nationally32.0 crimes per 1,000 a year·21.8 violent and sexual, 10.2 homes and vehicles
T20Barlby3,499 peopleB−#725 of 2,138 nationally32.1 crimes per 1,000 a year·23.2 violent and sexual, 9.0 homes and vehicles
23New Marske2,990 peopleB−#772 of 2,138 nationally32.9 crimes per 1,000 a year·22.3 violent and sexual, 10.6 homes and vehicles
T24Filey6,664 peopleB−#789 of 2,138 nationally33.4 crimes per 1,000 a year·25.9 violent and sexual, 7.4 homes and vehicles
T24Sherburn in Elmet8,569 peopleB−#791 of 2,138 nationally33.4 crimes per 1,000 a year·23.3 violent and sexual, 10.1 homes and vehicles
26Knaresborough15,781 peopleB−#823 of 2,138 nationally33.8 crimes per 1,000 a year·23.6 violent and sexual, 10.2 homes and vehicles
27Stokesley4,906 peopleB−#847 of 2,138 nationally34.2 crimes per 1,000 a year·22.7 violent and sexual, 11.6 homes and vehicles
T28Easingwold5,036 peopleC+#895 of 2,138 nationally35.7 crimes per 1,000 a year·27.8 violent and sexual, 7.9 homes and vehicles
T28Malton6,320 peopleC+#922 of 2,138 nationally36.1 crimes per 1,000 a year·27.3 violent and sexual, 8.8 homes and vehicles
T30Sowerby4,727 peopleC+#928 of 2,138 nationally36.2 crimes per 1,000 a year·25.2 violent and sexual, 11.0 homes and vehicles
T30Marske-by-the-Sea7,576 peopleC+#940 of 2,138 nationally36.5 crimes per 1,000 a year·25.3 violent and sexual, 11.2 homes and vehicles
32Richmond8,076 peopleC+#988 of 2,138 nationally37.4 crimes per 1,000 a year·29.0 violent and sexual, 8.4 homes and vehicles
T33Pickering7,260 peopleC+#1,004 of 2,138 nationally37.6 crimes per 1,000 a year·27.5 violent and sexual, 10.2 homes and vehicles
T33Harrogate75,522 peopleC+#1,013 of 2,138 nationally37.8 crimes per 1,000 a year·27.3 violent and sexual, 10.5 homes and vehicles
35Kirkbymoorside2,763 peopleC+#1,042 of 2,138 nationally38.5 crimes per 1,000 a year·27.6 violent and sexual, 10.9 homes and vehicles
T36Bedale3,289 peopleC#1,295 of 2,138 nationally44.3 crimes per 1,000 a year·33.6 violent and sexual, 10.6 homes and vehicles
T36Skipton15,050 peopleC#1,300 of 2,138 nationally44.4 crimes per 1,000 a year·31.3 violent and sexual, 13.1 homes and vehicles
T36Thirsk5,891 peopleC#1,304 of 2,138 nationally44.5 crimes per 1,000 a year·33.2 violent and sexual, 11.4 homes and vehicles
39Boroughbridge3,064 peopleC#1,355 of 2,138 nationally45.9 crimes per 1,000 a year·31.9 violent and sexual, 14.0 homes and vehicles
T40Guisborough18,091 peopleC−#1,412 of 2,138 nationally47.6 crimes per 1,000 a year·31.0 violent and sexual, 16.6 homes and vehicles
T40Saltburn-by-the-Sea5,874 peopleC−#1,430 of 2,138 nationally48.2 crimes per 1,000 a year·31.7 violent and sexual, 16.5 homes and vehicles
42Skelton (Redcar and Cleveland)6,895 peopleC−#1,469 of 2,138 nationally49.4 crimes per 1,000 a year·33.6 violent and sexual, 15.8 homes and vehicles
43York141,696 peopleC−#1,612 of 2,138 nationally53.5 crimes per 1,000 a year·38.0 violent and sexual, 15.5 homes and vehicles
T44Northallerton13,314 peopleD#1,759 of 2,138 nationally59.4 crimes per 1,000 a year·42.3 violent and sexual, 17.1 homes and vehicles
T44Whitby12,603 peopleD#1,777 of 2,138 nationally60.6 crimes per 1,000 a year·46.6 violent and sexual, 14.0 homes and vehicles
46Brotton5,399 peopleD#1,816 of 2,138 nationally62.4 crimes per 1,000 a year·43.6 violent and sexual, 18.8 homes and vehicles
47Selby19,480 peopleD#1,828 of 2,138 nationally62.9 crimes per 1,000 a year·48.2 violent and sexual, 14.7 homes and vehicles
T48Loftus4,273 peopleD#1,948 of 2,138 nationally72.0 crimes per 1,000 a year·47.7 violent and sexual, 24.3 homes and vehicles
T48Redcar37,666 peopleD#1,969 of 2,138 nationally73.4 crimes per 1,000 a year·48.8 violent and sexual, 24.6 homes and vehicles
50Scarborough59,505 peopleD#2,003 of 2,138 nationally76.0 crimes per 1,000 a year·58.8 violent and sexual, 17.2 homes and vehicles
T51Yarm9,601 peopleD−#2,072 of 2,138 nationally87.6 crimes per 1,000 a year·77.0 violent and sexual, 10.7 homes and vehicles
T51Thornaby-on-Tees23,352 peopleD−#2,093 of 2,138 nationally92.6 crimes per 1,000 a year·59.3 violent and sexual, 33.4 homes and vehicles
53Eston29,625 peopleD−#2,118 of 2,138 nationally104.8 crimes per 1,000 a year·62.1 violent and sexual, 42.7 homes and vehicles
54Middlesbrough148,232 peopleD−#2,127 of 2,138 nationally110.9 crimes per 1,000 a year·70.8 violent and sexual, 40.1 homes and vehicles
Not ranked

Not on this list

2 military garrison towns and university campuses keep their grades but aren’t ranked: most residents serve in the forces or are students.

Quick answers

Questions people ask

What is the safest town in North Yorkshire?

Dunnington ranks first on safety among 54 towns, with an A+: 9.4 crimes per 1,000 residents a year (5.3 violent and sexual offences, 4.1 against homes and vehicles). Upper Poppleton and Copmanthorpe follow.

How are these towns ranked?

The Safety Grade: violent and sexual offences, burglary, vehicle crime and criminal damage recorded inside the town by police.uk, per 1,000 residents a year over three years, lowest first. The letter and rank are the same as on each town’s page. How grades work.

Why isn’t my town on this list?

Garrison towns and university campuses aren’t ranked, and towns without the figures this grade needs are counted above. The list covers North Yorkshire’s towns of 2,500+ with the figure. Smaller places show it on their own pages; every town in North Yorkshire is on the county page.

Go deeper

More North Yorkshire lists

Every list ranks the same 2,500+ towns, so a town’s rank means the same thing on each.

All North Yorkshire rankings →
County by county

Safest towns, county by county

Sources: data.police.uk street-level crime, 36 months to August 2026, points inside the built-up-area boundary · TownRatings grades: our own summary of the data, ranked against UK towns only. All under the Open Government Licence v3.0.

Contains public sector information licensed under the Open Government Licence v3.0. Contains HM Land Registry data © Crown copyright and database right 2026. Contains OS data © Crown copyright and database right 2026 (ONS boundaries). Northern Ireland: Source: NISRA; contains Land & Property Services data and Ordnance Survey of Northern Ireland information, © Crown copyright, licensed under the Open Government Licence v3.0. Scotland: contains National Records of Scotland data, Registers of Scotland data and SEPA data, © Crown copyright / © SEPA 2025, licensed under the Open Government Licence v3.0.