Guest, Sign inJoin
The Hawthorns, CharvilCharvil, #1 on this list · Photo: Andrew Smith · CC BY-SA 2.0
Berkshire rankings · Safety

Safest towns in Berkshire

Charvil records the least crime per resident of Berkshire’s 30 towns of 2,500+ with police.uk figures: 18.7 crimes per 1,000 residents a year (10.6 violent and sexual offences, 8.1 against homes and vehicles). 5 of the 30 grade A− or better on safety.

The Safety Grade: violent and sexual offences, burglary, vehicle crime and criminal damage recorded inside the town by police.uk, per 1,000 residents a year over three years, lowest first. The rank across England, Wales and Northern Ireland sits beside each letter. How grades work

#1

Charvil

3,158 people
A

18.7 crimes per 1,000 a year·10.6 violent and sexual, 8.1 homes and vehicles·#106 of 2,138 in England, Wales and Northern Ireland

#T2

Wargrave

2,896 people
A−

21.0 crimes per 1,000 a year·12.9 violent and sexual, 8.1 homes and vehicles·#172 of 2,138 in England, Wales and Northern Ireland
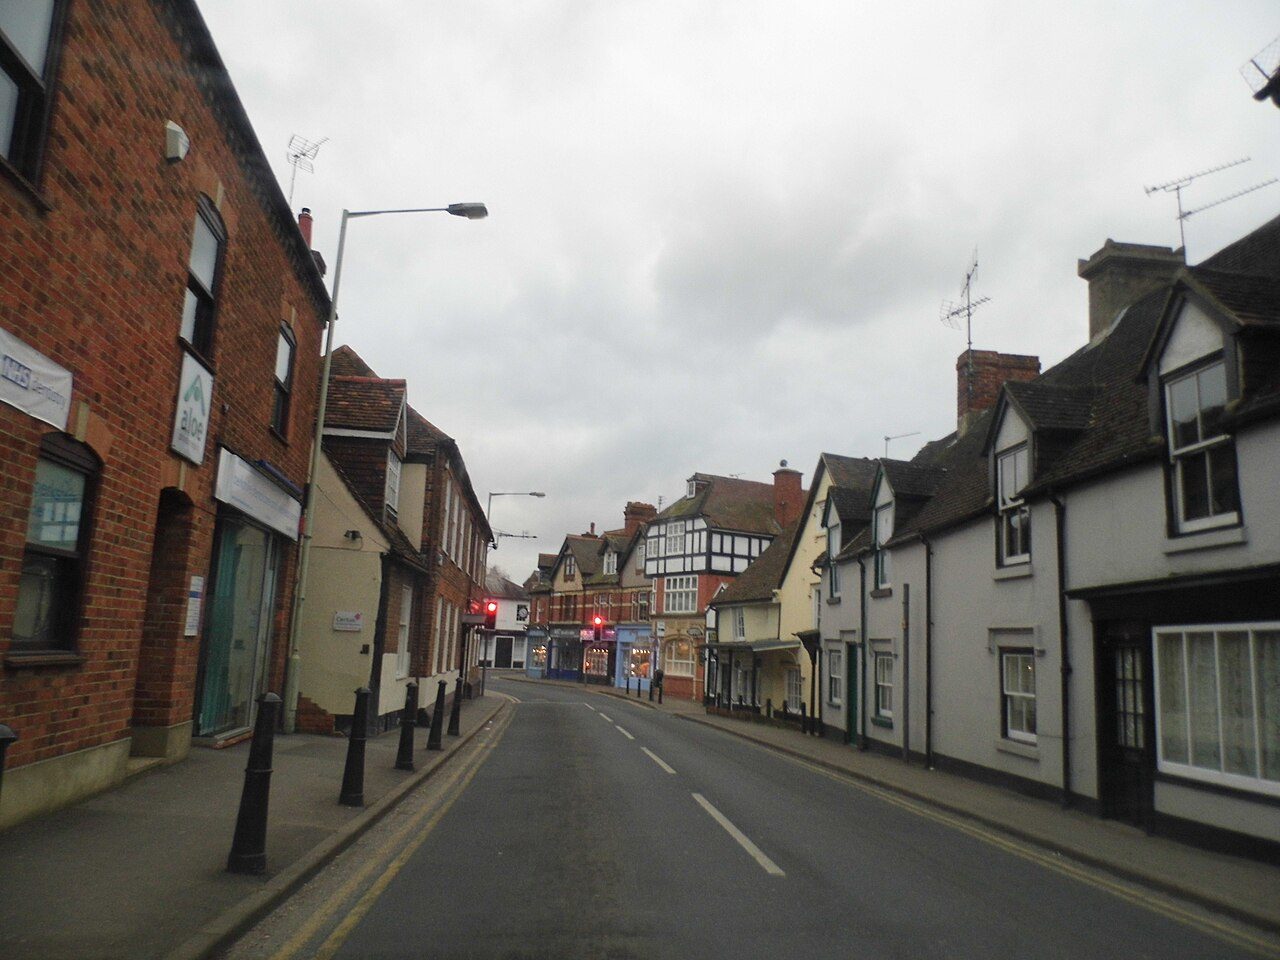
#T2

Twyford

8,072 people
A−

21.2 crimes per 1,000 a year·11.8 violent and sexual, 9.4 homes and vehicles·#177 of 2,138 in England, Wales and Northern Ireland

All 30 towns, ranked

Crimes per 1,000 residents a year, lowest first; the sort uses the exact rate. Military garrison towns and university campuses keep their grades but aren’t ranked. Each rank across England, Wales and Northern Ireland links to the national list.

Every town in Berkshire →

30 towns.

#TownGrade · UK rankCrime rate
1Charvil3,158 peopleA#106 of 2,138 nationally18.7 crimes per 1,000 a year·10.6 violent and sexual, 8.1 homes and vehicles
T2Wargrave2,896 peopleA−#172 of 2,138 nationally21.0 crimes per 1,000 a year·12.9 violent and sexual, 8.1 homes and vehicles
T2Twyford8,072 peopleA−#177 of 2,138 nationally21.2 crimes per 1,000 a year·11.8 violent and sexual, 9.4 homes and vehicles
4Sandhurst20,220 peopleA−#191 of 2,138 nationally21.7 crimes per 1,000 a year·14.9 violent and sexual, 6.8 homes and vehicles
5Binfield4,851 peopleA−#246 of 2,138 nationally23.0 crimes per 1,000 a year·17.0 violent and sexual, 6.0 homes and vehicles
6Cookham5,216 peopleB+#265 of 2,138 nationally23.5 crimes per 1,000 a year·14.1 violent and sexual, 9.4 homes and vehicles
7Woodley28,019 peopleB+#286 of 2,138 nationally24.0 crimes per 1,000 a year·18.1 violent and sexual, 5.8 homes and vehicles
8Caversham33,038 peopleB+#374 of 2,138 nationally25.7 crimes per 1,000 a year·16.7 violent and sexual, 9.0 homes and vehicles
T9Wokingham50,320 peopleB#430 of 2,138 nationally26.9 crimes per 1,000 a year·18.3 violent and sexual, 8.6 homes and vehicles
T9Crowthorne15,196 peopleB#434 of 2,138 nationally27.0 crimes per 1,000 a year·20.3 violent and sexual, 6.7 homes and vehicles
11Spencers Wood and Three Mile Cross7,612 peopleB#442 of 2,138 nationally27.2 crimes per 1,000 a year·19.3 violent and sexual, 7.9 homes and vehicles
12Ascot24,003 peopleB#516 of 2,138 nationally28.4 crimes per 1,000 a year·18.8 violent and sexual, 9.6 homes and vehicles
13Winnersh8,904 peopleB#545 of 2,138 nationally28.7 crimes per 1,000 a year·20.5 violent and sexual, 8.2 homes and vehicles
14Lambourn3,141 peopleB#601 of 2,138 nationally29.8 crimes per 1,000 a year·22.0 violent and sexual, 7.8 homes and vehicles
15Pangbourne3,279 peopleB−#680 of 2,138 nationally31.3 crimes per 1,000 a year·20.0 violent and sexual, 11.3 homes and vehicles
T16Old Windsor and Wraysbury7,689 peopleB−#743 of 2,138 nationally32.4 crimes per 1,000 a year·20.8 violent and sexual, 11.6 homes and vehicles
T16Burghfield Common6,216 peopleB−#755 of 2,138 nationally32.6 crimes per 1,000 a year·20.4 violent and sexual, 12.2 homes and vehicles
T16Shinfield5,417 peopleB−#758 of 2,138 nationally32.6 crimes per 1,000 a year·23.4 violent and sexual, 9.2 homes and vehicles
19Thatcham25,537 peopleC+#1,006 of 2,138 nationally37.6 crimes per 1,000 a year·29.6 violent and sexual, 8.0 homes and vehicles
20Maidenhead67,391 peopleC#1,175 of 2,138 nationally41.3 crimes per 1,000 a year·27.5 violent and sexual, 13.8 homes and vehicles
21Hungerford5,184 peopleC#1,211 of 2,138 nationally42.0 crimes per 1,000 a year·29.4 violent and sexual, 12.6 homes and vehicles
T22Theale3,053 peopleC#1,323 of 2,138 nationally45.2 crimes per 1,000 a year·33.7 violent and sexual, 11.5 homes and vehicles
T22Bracknell78,662 peopleC#1,340 of 2,138 nationally45.5 crimes per 1,000 a year·31.9 violent and sexual, 13.5 homes and vehicles
T24Mortimer2,932 peopleC#1,357 of 2,138 nationally45.9 crimes per 1,000 a year·25.8 violent and sexual, 20.1 homes and vehicles
T24Datchet4,807 peopleC#1,364 of 2,138 nationally46.2 crimes per 1,000 a year·24.3 violent and sexual, 21.9 homes and vehicles
26Arborfield Garrison4,311 peopleC−#1,455 of 2,138 nationally48.9 crimes per 1,000 a year·35.1 violent and sexual, 13.8 homes and vehicles
27Windsor31,569 peopleC−#1,494 of 2,138 nationally50.2 crimes per 1,000 a year·34.0 violent and sexual, 16.3 homes and vehicles
28Newbury42,262 peopleC−#1,520 of 2,138 nationally51.2 crimes per 1,000 a year·37.1 violent and sexual, 14.1 homes and vehicles
29Reading203,789 peopleC−#1,645 of 2,138 nationally55.1 crimes per 1,000 a year·39.6 violent and sexual, 15.5 homes and vehicles
30Slough166,868 peopleD#1,849 of 2,138 nationally64.1 crimes per 1,000 a year·43.4 violent and sexual, 20.7 homes and vehicles
Quick answers

Questions people ask

What is the safest town in Berkshire?

Charvil ranks first on safety among 30 towns, with an A: 18.7 crimes per 1,000 residents a year (10.6 violent and sexual offences, 8.1 against homes and vehicles). Wargrave and Twyford follow.

How are these towns ranked?

The Safety Grade: violent and sexual offences, burglary, vehicle crime and criminal damage recorded inside the town by police.uk, per 1,000 residents a year over three years, lowest first. The letter and rank are the same as on each town’s page. How grades work.

Why isn’t my town on this list?

Garrison towns and university campuses aren’t ranked, and towns without the figures this grade needs are counted above. The list covers Berkshire’s towns of 2,500+ with the figure. Smaller places show it on their own pages; every town in Berkshire is on the county page.

Go deeper

More Berkshire lists

Every list ranks the same 2,500+ towns, so a town’s rank means the same thing on each.

All Berkshire rankings →
County by county

Safest towns, county by county

Sources: data.police.uk street-level crime, 36 months to August 2026, points inside the built-up-area boundary · TownRatings grades: our own summary of the data, ranked against UK towns only. All under the Open Government Licence v3.0.

Contains public sector information licensed under the Open Government Licence v3.0. Contains HM Land Registry data © Crown copyright and database right 2026. Contains OS data © Crown copyright and database right 2026 (ONS boundaries). Northern Ireland: Source: NISRA; contains Land & Property Services data and Ordnance Survey of Northern Ireland information, © Crown copyright, licensed under the Open Government Licence v3.0. Scotland: contains National Records of Scotland data, Registers of Scotland data and SEPA data, © Crown copyright / © SEPA 2025, licensed under the Open Government Licence v3.0.