Guest, Sign inJoin
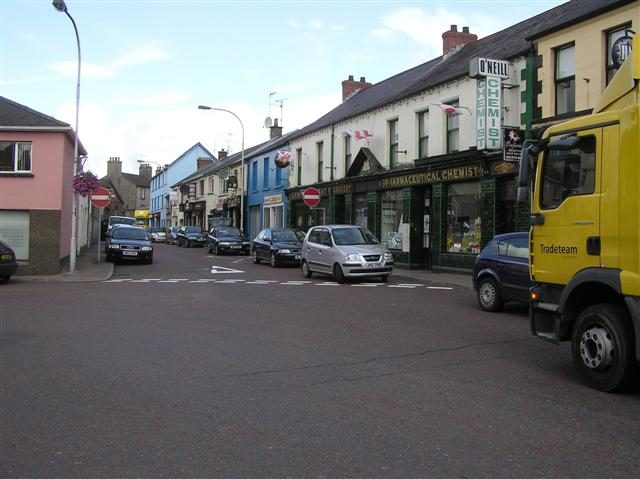
Main Street, CoalislandCoalisland, #1 on this list · Photo: Kenneth Allen · CC BY-SA 2.0
England, Scotland, Wales and Northern Ireland · Cost of living

Most affordable towns in England, Scotland, Wales and Northern Ireland: 1,901 to 2,000

Ranks 1,901 to 2,000 of 2,515 towns and cities of 2,500+ in England, Scotland, Wales and Northern Ireland, led on this page by Penarth, South Glamorgan.

The Cost of living Grade: the median sale price (Land Registry), a year’s private rent (ONS) and Band D council tax with the parish precept, each against the mean household income of the town’s council area. The area rank sits beside each letter. How grades work

Ranks 1,901 to 2,000

Cost of living grade, best first; towns with the same score share a rank (T = tied). Military garrison towns and university campuses keep their grades but aren’t ranked. Each area rank links to that area’s list.

100 towns on this page. Counties and council areas with 15 or more towns have their own list.

#TownGrade · area rankCompared with UK towns
T1900PenarthSouth Glamorgan · 28,391 peopleC#7 of 9 in South Glamorganhomes cost 6.2 years of area income
T1900Tower HamletsLondon · 311,072 peopleC#16 of 33 in Londonhomes cost 6.9 years of area income
T1903Bourne EndBuckinghamshire · 7,166 peopleC#24 of 39 in Buckinghamshirehomes cost 7.9 years of area income
T1903WillenhallWest Midlands · 49,582 peopleC#14 of 35 in West Midlandshomes cost 4.3 years of area income
1905StevenageHertfordshire · 94,462 peopleC#21 of 50 in Hertfordshirehomes cost 5.7 years of area income
T1906LyddKent · 3,911 peopleC#41 of 87 in Kenthomes cost 4.9 years of area income
T1906SmallfieldSurrey · 2,613 peopleC#36 of 65 in Surreyhomes cost 6.3 years of area income
T1906WroughtonWiltshire · 7,276 peopleC#29 of 30 in Wiltshirehomes cost 6.1 years of area income
1909Newton-le-WillowsMerseyside · 24,651 peopleC#8 of 25 in Merseysidehomes cost 4.8 years of area income
T1910Canvey IslandEssex · 38,004 peopleC#54 of 81 in Essexhomes cost 5.7 years of area income
T1910Forest TownNottinghamshire · 19,015 peopleC#45 of 49 in Nottinghamshirehomes cost 4.9 years of area income
T1910Hythe and Dibden PurlieuHampshire · 19,857 peopleC#63 of 76 in Hampshirehomes cost 5.7 years of area income
T1913GodstoneSurrey · 2,648 peopleC#37 of 65 in Surreyhomes cost 6.4 years of area income
T1913Lenham and HarrietshamKent · 4,763 peopleC#42 of 87 in Kenthomes cost 6.1 years of area income
T1915MarchwoodHampshire · 5,776 peopleC#64 of 76 in Hampshirehomes cost 5.7 years of area income
T1915NewhamLondon · 351,065 peopleC#17 of 33 in Londonhomes cost 6.9 years of area income
T1915Woburn SandsBuckinghamshire · 4,315 peopleC#25 of 39 in Buckinghamshirehomes cost 6.9 years of area income
T1918Church StrettonShropshire · 3,576 peopleC#19 of 19 in Shropshirehomes cost 7.2 years of area income
T1918MonmouthGwent · 10,330 peopleC#32 of 38 in Gwenthomes cost 5.8 years of area income
T1918Stoke PogesBuckinghamshire · 3,920 peopleC#26 of 39 in Buckinghamshirehomes cost 8.3 years of area income
T1921Burnham-on-SeaSomerset · 16,317 peopleC#29 of 49 in Somersethomes cost 5.4 years of area income
T1921Walter's Ash and NaphillBuckinghamshire · 3,893 peopleC#27 of 39 in Buckinghamshirehomes cost 8.2 years of area income
T1923BarnetLondon · 388,572 peopleC#18 of 33 in Londonhomes cost 7.4 years of area income
T1923BloxwichWest Midlands · 51,891 peopleC#15 of 35 in West Midlandshomes cost 4.3 years of area income
T1925Bredbury and WoodleyGreater Manchester · 17,044 peopleC#24 of 81 in Greater Manchesterhomes cost 4.9 years of area income
T1925CliffeKent · 2,531 peopleC#43 of 87 in Kenthomes cost 6.0 years of area income
T1925EnfieldLondon · 329,822 peopleC#19 of 33 in Londonhomes cost 6.8 years of area income
T1925HaddenhamBuckinghamshire · 5,603 peopleC#28 of 39 in Buckinghamshirehomes cost 7.4 years of area income
T1929BloxhamOxfordshire · 3,681 peopleC#32 of 38 in Oxfordshirehomes cost 6.8 years of area income
T1929ColeshillWarwickshire · 6,744 peopleC#32 of 34 in Warwickshirehomes cost 5.3 years of area income
T1931AvonmouthBristol · 2,643 peopleChomes cost 4.5 years of area income
T1931ReadingBerkshire · 203,789 peopleC#24 of 30 in Berkshirehomes cost 5.7 years of area income
T1931SturryKent · 4,857 peopleC#44 of 87 in Kenthomes cost 5.5 years of area income
T1934CharfieldGloucestershire · 2,833 peopleC#35 of 48 in Gloucestershirehomes cost 5.8 years of area income
T1934DanburyEssex · 6,196 peopleC#55 of 81 in Essexhomes cost 8.9 years of area income
T1936FavershamKent · 20,941 peopleC#45 of 87 in Kenthomes cost 6.1 years of area income
T1936PenllergaerWest Glamorgan · 3,578 peopleC#18 of 19 in West Glamorganhomes cost 6.4 years of area income
T1936Rusthall and Langton GreenKent · 7,783 peopleC#45 of 87 in Kenthomes cost 6.9 years of area income
T1936WhickhamTyne and Wear · 15,680 peopleC#31 of 34 in Tyne and Wearhomes cost 5.1 years of area income
1940KearsleyGreater Manchester · 11,117 peopleC#25 of 81 in Greater Manchesterhomes cost 4.3 years of area income
T1941MarkyateHertfordshire · 3,174 peopleC#22 of 50 in Hertfordshirehomes cost 6.2 years of area income
T1941Pevensey BayEast Sussex · 2,890 peopleC#3 of 26 in East Sussexhomes cost 5.6 years of area income
T1941WoodstockOxfordshire · 3,522 peopleC#33 of 38 in Oxfordshirehomes cost 8.3 years of area income
1944ConwyClwyd · 15,706 peopleC#37 of 39 in Clwydhomes cost 5.5 years of area income
T1945HeathfieldEast Sussex · 7,663 peopleC#4 of 26 in East Sussexhomes cost 5.6 years of area income
T1945RedbournHertfordshire · 5,188 peopleC#23 of 50 in Hertfordshirehomes cost 7.4 years of area income
T1945St AlbansHertfordshire · 75,544 peopleC#23 of 50 in Hertfordshirehomes cost 7.5 years of area income
T1948CorbridgeNorthumberland · 2,888 peopleC#19 of 20 in Northumberlandhomes cost 8.5 years of area income
T1948Dinas PowisSouth Glamorgan · 7,891 peopleC#8 of 9 in South Glamorganhomes cost 6.5 years of area income
T1948KirkbymoorsideNorth Yorkshire · 2,763 peopleC#39 of 54 in North Yorkshirehomes cost 4.9 years of area income
T1948Paddock WoodKent · 7,616 peopleC#47 of 87 in Kenthomes cost 6.4 years of area income
T1952CaerleonGwent · 7,329 peopleC#33 of 38 in Gwenthomes cost 6.1 years of area income
T1952GoringOxfordshire · 3,434 peopleC#34 of 38 in Oxfordshirehomes cost 9.5 years of area income
T1954LoggerheadsStaffordshire · 2,523 peopleC#46 of 46 in Staffordshirehomes cost 7.0 years of area income
T1954PemburyKent · 5,783 peopleC#48 of 87 in Kenthomes cost 6.8 years of area income
T1956DatchetBerkshire · 4,807 peopleC#25 of 30 in Berkshirehomes cost 7.5 years of area income
T1956Farnham Common and Farnham RoyalBuckinghamshire · 6,711 peopleC#29 of 39 in Buckinghamshirehomes cost 8.7 years of area income
T1956Hockley and HawkwellEssex · 15,430 peopleC#56 of 81 in Essexhomes cost 7.0 years of area income
T1959Chadwell St MaryEssex · 10,680 peopleC#57 of 81 in Essexhomes cost 6.1 years of area income
T1959CottamLancashire · 5,507 peopleC#56 of 65 in Lancashirehomes cost 6.1 years of area income
T1959TangmereWest Sussex · 4,000 peopleC#15 of 40 in West Sussexhomes cost 5.6 years of area income
T1962ClevedonSomerset · 21,084 peopleC#30 of 49 in Somersethomes cost 6.0 years of area income
T1962South MoltonDevon · 6,226 peopleC#27 of 47 in Devonhomes cost 5.8 years of area income
1964BrutonSomerset · 2,816 peopleC#31 of 49 in Somersethomes cost 5.7 years of area income
T1965Knowle and DorridgeWest Midlands · 19,323 peopleC#16 of 35 in West Midlandshomes cost 9.3 years of area income
T1965Marlow BottomBuckinghamshire · 3,339 peopleC#30 of 39 in Buckinghamshirehomes cost 10.4 years of area income
T1965ScarboroughNorth Yorkshire · 59,505 peopleC#40 of 54 in North Yorkshirehomes cost 4.4 years of area income
1968Talbot GreenMid Glamorgan · 3,291 peopleC#29 of 32 in Mid Glamorganhomes cost 6.2 years of area income
T1969DrighlingtonWest Yorkshire · 5,280 peopleC#80 of 91 in West Yorkshirehomes cost 5.4 years of area income
T1969HextableKent · 4,100 peopleC#49 of 87 in Kenthomes cost 6.4 years of area income
1971EghamSurrey · 28,003 peopleC#38 of 65 in Surreyhomes cost 6.6 years of area income
T1972Henley-on-ThamesOxfordshire · 11,786 peopleC#35 of 38 in Oxfordshirehomes cost 9.3 years of area income
T1972West KingsdownKent · 4,306 peopleC#50 of 87 in Kenthomes cost 6.7 years of area income
1974Moreton-in-MarshGloucestershire · 5,015 peopleC#36 of 48 in Gloucestershirehomes cost 6.7 years of area income
T1975BirminghamWest Midlands · 1,121,367 peopleC#17 of 35 in West Midlandshomes cost 4.8 years of area income
T1975EalingLondon · 367,271 peopleC#20 of 33 in Londonhomes cost 7.3 years of area income
T1977CodicoteHertfordshire · 2,677 peopleC#25 of 50 in Hertfordshirehomes cost 7.7 years of area income
T1977GraysEssex · 44,340 peopleC#58 of 81 in Essexhomes cost 6.2 years of area income
T1977North BerwickEast Lothian · 8,314 peopleC#9 of 11 in East Lothianhomes cost 7.2 years of area income
T1977Stanford-le-HopeEssex · 29,527 peopleC#58 of 81 in Essexhomes cost 6.2 years of area income
1981Southend-on-SeaEssex · 182,295 peopleC#60 of 81 in Essexhomes cost 6.1 years of area income
1982SettleNorth Yorkshire · 2,710 peopleC#41 of 54 in North Yorkshirehomes cost 5.4 years of area income
T1983MarlowBuckinghamshire · 14,641 peopleC#31 of 39 in Buckinghamshirehomes cost 9.2 years of area income
T1983SouthwarkLondon · 307,076 peopleC#21 of 33 in Londonhomes cost 7.4 years of area income
T1985NorthfleetKent · 29,892 peopleC#51 of 87 in Kenthomes cost 5.8 years of area income
T1985TarvinCheshire · 2,744 peopleC#36 of 46 in Cheshirehomes cost 6.3 years of area income
T1987AddinghamWest Yorkshire · 3,247 peopleC−#81 of 91 in West Yorkshirehomes cost 8.1 years of area income
T1987BramptonCumbria · 4,187 peopleC−#11 of 23 in Cumbriahomes cost 4.5 years of area income
T1987DollarClackmannanshire · 2,853 peopleC−#8 of 8 in Clackmannanshirehomes cost 7.5 years of area income
T1987PontelandNorthumberland · 10,149 peopleC−#20 of 20 in Northumberlandhomes cost 10.2 years of area income
1991LambethLondon · 317,108 peopleC−#22 of 33 in Londonhomes cost 7.4 years of area income
T1992Longfield, New Ash Green and HartleyKent · 16,077 peopleC−#52 of 87 in Kenthomes cost 6.7 years of area income
T1992West MoleseySurrey · 47,144 peopleC−#39 of 65 in Surreyhomes cost 8.4 years of area income
T1992WesterhamKent · 3,390 peopleC−#52 of 87 in Kenthomes cost 6.3 years of area income
T1995AbergavennyGwent · 13,689 peopleC−#34 of 38 in Gwenthomes cost 6.0 years of area income
T1995ChepstowGwent · 11,939 peopleC−#34 of 38 in Gwenthomes cost 6.0 years of area income
T1995Old Windsor and WraysburyBerkshire · 7,689 peopleC−#26 of 30 in Berkshirehomes cost 7.9 years of area income
T1995West ClystDevon · 2,683 peopleC−#28 of 47 in Devonhomes cost 7.2 years of area income
T1999ExminsterDevon · 4,388 peopleC−#29 of 47 in Devonhomes cost 6.6 years of area income
T1999Sutton on Sea and TrusthorpeLincolnshire · 5,042 peopleC−#57 of 61 in Lincolnshirehomes cost 5.8 years of area income
Not ranked

Not on this list

22 military garrison towns and university campuses keep their grades but aren’t ranked: most residents serve in the forces or are students.

  • Albrighton Shropshire · 6,983 people. Garrison town.
  • Bailrigg Lancashire · 4,788 people. University campus.
  • Benson Oxfordshire · 5,236 people. Garrison town.
  • Bulford Wiltshire · 4,923 people. Garrison town.
  • Carterton Oxfordshire · 17,951 people. Garrison town.
  • Catterick North Yorkshire · 2,718 people. Garrison town.
  • Catterick Garrison North Yorkshire · 14,212 people. Garrison town.
  • Coningsby and Tattershall Lincolnshire · 5,511 people. Garrison town.
  • Cranwell Lincolnshire · 2,583 people. Garrison town.
  • Greetham Rutland · 2,807 people. Garrison town.
  • Keele Staffordshire · 2,607 people. University campus.
  • Larkhill Wiltshire · 2,728 people. Garrison town.
  • Little Eriswell Suffolk · 4,120 people. Garrison town.
  • Lyneham Wiltshire · 4,645 people. Garrison town.
  • Marham Norfolk · 2,608 people. Garrison town.
  • Odiham Hampshire · 5,091 people. Garrison town.
  • Pimperne Dorset · 2,770 people. Garrison town.
  • Pirbright Surrey · 3,920 people. Garrison town.
  • Tidworth Wiltshire · 10,693 people. Garrison town.
  • Waddington Lincolnshire · 6,828 people. Garrison town.
  • Wittering Cambridgeshire · 2,678 people. Garrison town.
  • Wool Dorset · 5,044 people. Garrison town.
County by county

Most affordable towns, county by county

Sources: HM Land Registry Price Paid (standard sales, September 2023 to August 2026) · ONS Price Index of Private Rents (August 2026, by council) · MHCLG and Welsh Government council tax, Band D 2026–27 (with parish precepts in England) · ONS small-area income estimates (financial year ending 2023) · TownRatings grades: our own summary of the data, ranked against UK towns only. All under the Open Government Licence v3.0.

Contains public sector information licensed under the Open Government Licence v3.0. Contains HM Land Registry data © Crown copyright and database right 2026. Contains OS data © Crown copyright and database right 2026 (ONS boundaries). Northern Ireland: Source: NISRA; contains Land & Property Services data and Ordnance Survey of Northern Ireland information, © Crown copyright, licensed under the Open Government Licence v3.0. Scotland: contains National Records of Scotland data, Registers of Scotland data and SEPA data, © Crown copyright / © SEPA 2025, licensed under the Open Government Licence v3.0.