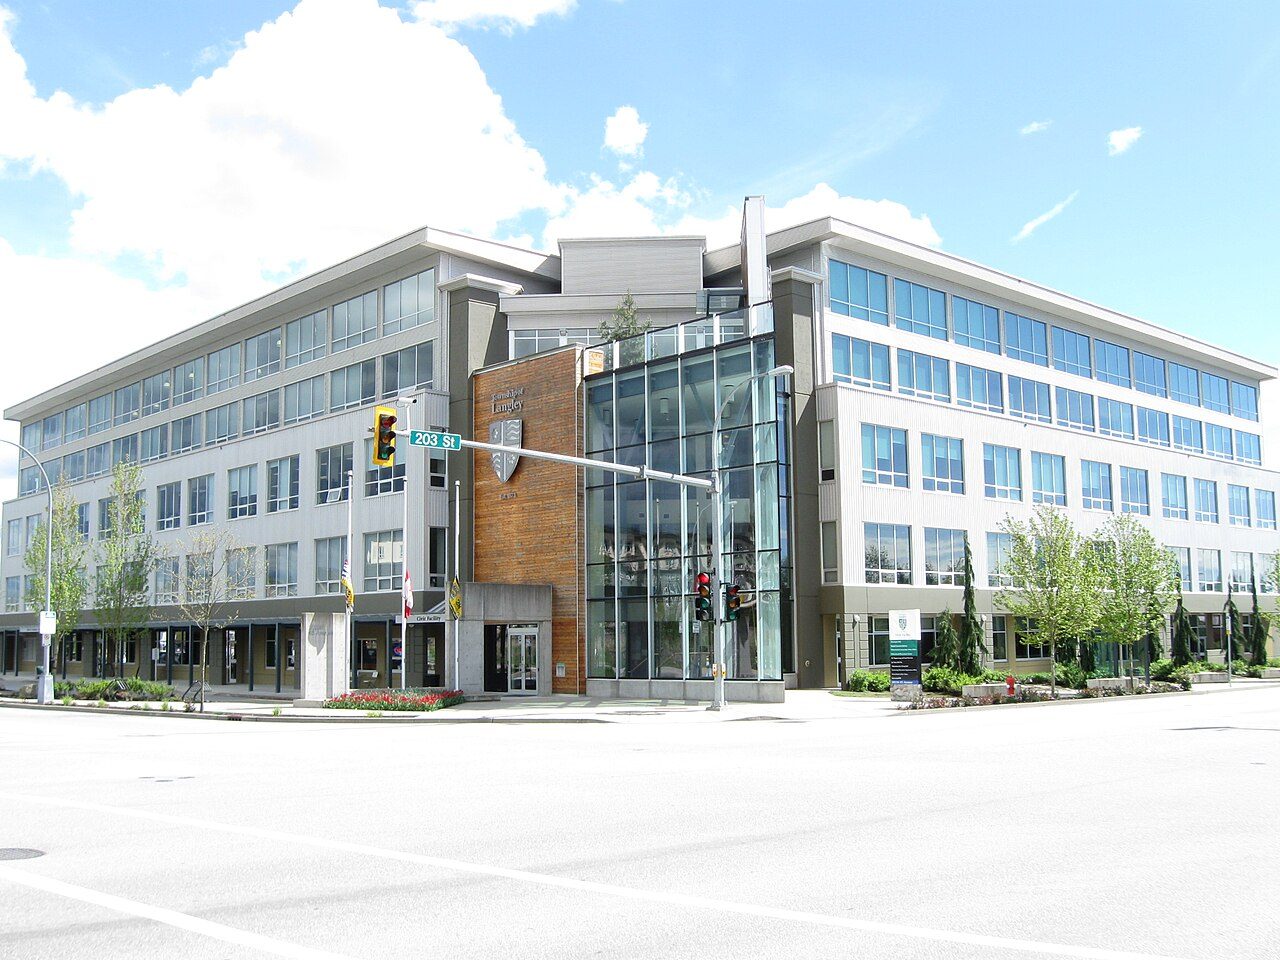
 Photo: Leoboudv · CC BY-SA 4.0
Household incomes in Langley are higher than in 92% of Canadian towns
Of Langley’s residents aged 15 to 64, 78% were employed when the 2021 census was taken; the middle of Canadian towns is 73%. Commutes from Langley average 29.7 minutes, and 8% take an hour or more. Unemployment in Langley stood at 6.2% on census day 2021, and the middle of Canadian towns sits at 9.9%.
What the numbers say about work in Langley
Less unemployment than most towns
The Labour Force Survey had the area at 6.7% in October 2026; on census day in 2021 the town’s own rate was 6.2%, where the middle of Canadian towns had 9.9%. Unemployment ↓
Higher incomes than most towns
Household income at the median was $108,300 in 2020, before tax; Canadian towns have $85,900 at the middle. Household income ↓
More jobs than the typical town
44,735 people work in Langley and 41,575 residents commute to a fixed workplace; the middle of Canadian towns has 0.8 jobs per working resident. The daily tide ↓
Longer trips than most towns
Commutes take 29.7 minutes on average, against 26 in the middle of Canadian towns; 8% take an hour or more. The trip to work ↓
Written from the data on this page: Statistics Canada’s 2021 Census, its commuting tables, Employment Insurance and the Labour Force Survey.
Langley grades B+ for jobs and income
Better than 68% of Canadian towns on three measures together, #91 of 254 in British Columbia.
Its strongest measure is household income; its weakest, trip times.
Graded against Canadian towns of 2,500 people or more; less unemployment and a shorter commute count in its favour.
How the grade works
Census 2021 measures, weighed equally against every Canadian town and neighbourhood of 2,500 people or more: the share of residents aged 15 to 64 in work, median household income (2020), the unemployment rate and the average commute. Each becomes a percentile; their average sets the letter.
In Langley, 78% of people aged 15 to 64 have a job
Of the 95 other places of 2,500 people or more in the Greater Vancouver census division, 75 have a smaller share of 15-to-64s in work.
An older population pulls the all-ages rate down: 63% of residents 15 and over were in work. By October 2026, the Labour Force Survey had 63% of the wider area’s adults in work. The participation rate, everyone 15 and over working or looking for work, was 67%. The census caught the labour market on 11 May 2021, deep in the pandemic, so unemployment and working from home both ran above normal.
Statistics Canada, 2021 Census: people in work of any age over residents aged 15 to 64, and the census unemployment rate (15 and over); the 25-to-54 rate is Statistics Canada’s own (98-10-0485). The Labour Force Survey and business counts are context, not grade inputs.
The median household in Langley had $108,300 in 2020
That puts Langley 25% above the median of British Columbia’s towns, $86,900. 25 of the 95 other places of 2,500+ in the Greater Vancouver census division have a higher median. The year is 2020: emergency benefits like CERB count in these incomes, and they raised the bottom of the range.
Statistics Canada, 2021 Census: median total income of households in 2020, before tax (a neighbourhood’s estimated from its dissemination areas’ income groups).
Langley fills up on a working day: 6% more workers
The job is inside the municipality for 37% of its commuters (70% in the middle of Canadian towns).
People with no fixed workplace are in neither count.
The length of the trip to work in Langley
In the middle of British Columbia’s towns, the average commute is 26.4 minutes. Trips under 15 minutes: 24%, fewer than the 39% in the middle of British Columbia’s towns. Statistics Canada’s own average, timed exactly rather than by band, is 26.3 minutes.
Statistics Canada, 2021 Census: commuting duration in five bands; our average uses each band’s middle (75 minutes for an hour or more), so it runs about two minutes above Statistics Canada’s own.
29,228 people come into Langley to work, most from Surrey and Abbotsford
- Surrey12,430
- Abbotsford5,650
- Langley (British Columbia part)2,620
- Maple Ridge1,455
- Vancouver920
- Mission900
- Chilliwack870
- Coquitlam785
- Burnaby650
- Delta565
- Surrey9,895
- Langley (British Columbia part)3,090
- Abbotsford2,570
- Vancouver1,995
- Burnaby1,800
- Delta1,500
- Richmond1,035
- Coquitlam875
- Maple Ridge650
- New Westminster580
Of everyone working in Langley, 65% come in from elsewhere; 12,430 make the 14 km trip from Surrey. The main destination the other way is Surrey, with 9,895.
Statistics Canada, 2021 Census (98-10-0459): commuting flows between municipalities (census subdivisions), rounded to 5; linked names have their own pages.
Leaving the car at home: 6.5% of commuters in Langley
Transit takes 2.7% of commuters, close to the middle of Canadian towns. Working at home: 21%, close to the middle of Canadian towns.
Statistics Canada, 2021 Census: main mode of commuting; average durations by mode from table 98-10-0458 (whole municipalities only).
In the Greater Vancouver census division, 63% more people receive EI than in 2019
At its peak, in January 2021, 117,570 people were on EI, 3.3 times the 2019 average. That is about 3.6 people on EI for every 100 aged 15 to 64 in the division. Set against the same month a year before, the count in August 2026 rose by 4%.
Statistics Canada, Employment Insurance beneficiaries by census division (14-10-0323): all income benefits, not seasonally adjusted. Not measured by town: EI beneficiaries (the Greater Vancouver census division). EI counts are context, not part of any grade.
People receiving Employment Insurance each month, as a share of the 2019 average (100).
Everyday places on foot in Langley: A−
Better than 76% of Canadian towns on two measures together, #144 of 254 in British Columbia.
OpenStreetMap (© OpenStreetMap contributors, ODbL); active commuting from the 2021 Census.
Ranked on jobs and income, Langley is 5th among 28 Canadian towns of 114,700 to 221,200
| # | Place | People | In work, 15–64 | Unemployment | Household income | Grade |
|---|---|---|---|---|---|---|
| 1 | Lévis Quebec | 160,882 | 84% | 5.3% | $84K | A |
| 2 | Saanich British Columbia | 126,011 | 77% | 6.8% | $93K | A |
| 3 | Kelowna British Columbia | 167,654 | 78% | 7.9% | $83K | A |
| 4 | Burlington Ontario | 197,737 | 76% | 11% | $110K | B+ |
| 5 | Langley British Columbia | 163,885 | 78% | 6.2% | $108K | B+ |
| 6 | Saguenay Quebec | 151,972 | 78% | 5.5% | $69K | B+ |
| 7 | Guelph Ontario | 160,760 | 74% | 11% | $93K | B |
| 8 | Delta British Columbia | 124,670 | 77% | 7.3% | $108K | B |
| … | ||||||
| 10 | Abbotsford British Columbia | 175,358 | 76% | 7.8% | $90K | B |
| … | ||||||
| 28 | Oshawa Ontario | 213,592 | 64% | 15% | $86K | D |
Ordered by Jobs & income Grade: the top three, the places either side of Langley, and others among British Columbia’s towns.
Jobs and income in the places around Langley
| Place | In work, 15–64 | Unemployment | Household income | Average trip | Jobs | Walk |
|---|---|---|---|---|---|---|
| Langley | 78% | 6.2% | $108K | 29.7 min | B+ | A− |
| Langley 3.1 km | 77% | 6.9% | $77K | 29.9 min | C | A |
| Aloha Estates 4.5 km | 80% | 7% | $101K | 29.9 min | B+ | A |
| Sunrise Estates 5.2 km | 73% | 6.6% | $119K | 27.4 min | B | B |
| Rosewood Park 5.2 km | 80% | 6.1% | $118K | 29.3 min | A− | B+ |
| Clayton Heights 5.3 km | 81% | 6% | $113K | 30.9 min | B+ | A |
| Cloverdale 7 km | 74% | 8.5% | $109K | 29.4 min | B− | A− |
The people of each place: the share in work, unemployment, household income and the average commute, with both grades once they come.
What this data can and can’t tell you
What each figure measures for Langley, where it comes from, and what it leaves out.
- Unemployment. Unemployed people over the labour force (in work or looking), aged 15 and over, on census day.
- Household income. The 2020 income of the household at the midpoint, all sources and before tax. Inside a city we rebuild it from the dissemination areas’ income bands, so there it is an estimate.
- Trip times. Commuters picked a band for their usual trip (under 15 minutes, 15 to 29, and so on). We place each person at the middle of their band, which lands a little above Statistics Canada’s own timed average.
- Where people commute. Who travels where, from the census: workers with a regular workplace, sorted by the municipality they live in and the one they work in.
- Employment Insurance. Beneficiaries of Employment Insurance, month by month, for the census division rather than the town. Many jobless people don’t qualify, so it isn’t an unemployment rate.
- The Labour Force Survey. Sampled each month and released for regions rather than towns, so its rate describes the area around the town.
- In work. Why 15 to 64? Otherwise retirees would pull the rate down in older towns. The census can’t say how old a neighbourhood’s workers are, so the count of people in work takes every age.
- Which towns we compare. Comparisons are with the median of Canadian towns and city neighbourhoods counting 2,500 people or more, reserves and entire cities excluded.
Questions about work in Langley
Where do people in Langley work?
Only 37% work in Langley itself; the rest go first to Surrey (9,895) and Langley (British Columbia part) (3,090).
How many jobs are there in Langley?
The 2021 census counted about 44,735 people working in Langley: 1.1 jobs for every resident who commutes to a fixed workplace. In June 2026, 6,542 businesses with employees were on Statistics Canada’s count.
What is the unemployment rate in Langley?
On census day in May 2021, unemployment stood at 6.2% of the labour force (9.9% in the middle of Canadian towns). For a recent figure, the Labour Force Survey put the Vancouver metro area at 6.7% in October 2026.
What is the average household income in Langley?
Before tax, half the households in Langley had more than $108,300 in 2020; the middle of Canadian towns is $85,900.
How do people in Langley get to work?
By car: 92% of commuters, 2.7% take public transit, 3.3% walk and 0.5% cycle; on census day 21% of those in work worked from home.
How long is the commute from Langley?
29.7 minutes is the average trip, with 24% of commuters there in under 15 minutes and 8% taking an hour or more.
Sources: Statistics Canada, 2021 Census of Population (Census Profile) · Statistics Canada, tables 98-10-0458 and 98-10-0459 (commuting) · Statistics Canada, table 14-10-0323 (EI beneficiaries) · Statistics Canada, Labour Force Survey (14-10-0459, 14-10-0462) · Statistics Canada, Canadian Business Counts (33-10-1176) · grades: TownRatings. Under the Statistics Canada Open Licence.
Adapted from Statistics Canada (Census of Population 2021, population estimates 2025, 2021 census boundaries) under the Statistics Canada Open Licence; this does not constitute an endorsement by Statistics Canada. Neighbourhood names in some cities © OpenStreetMap contributors (ODbL).