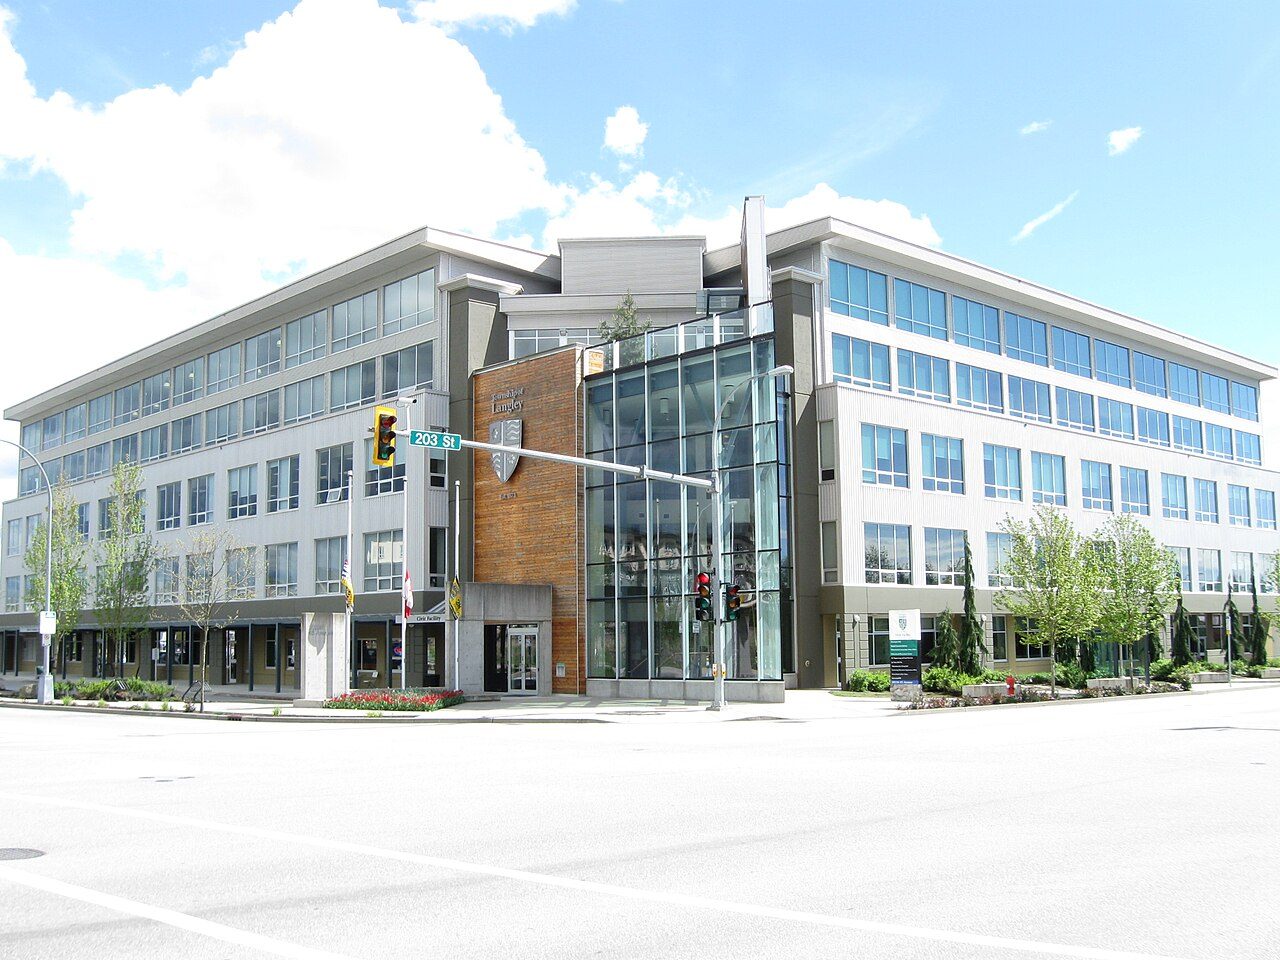
 Photo: Leoboudv · CC BY-SA 4.0
Langley is among the wettest of Canadian towns: 1,649 mm of rain and snow a year
The warmest part of a July day comes in at 25.0°C on average. Its January nights stay gentler than in 95% of Canadian towns. The wettest month is January; the driest is August. Picnics, hikes and garden evenings come into their own from June to September, with highs of 21–25°C.
These are not Langley’s own readings: ECCC keeps no normals there, so the page uses Pitt Meadows, 12 km north-west.
A year in Langley at a glance
Each month’s typical high and low, in °C.
What stands out about Langley’s climate
Compared with Canadian towns, with its place among towns of 2,500+ in British Columbia beside it.
What a year in Langley feels like
Seasons and months as ECCC’s 1991–2020 normals give them: a typical day’s high and low.
60 frost days and 107 days above 20°C a year
Frosts fall from October to April; December has the most, about 15. Some 11 days a year climb past 30°C.
Frost days by month
Average days at 0°C or below
Days above 20°C by month
Average days
Rain and melted snow: about 1,649 mm a year
10th wettest of 255 towns of 2,500+ in British Columbia. On about 148 days a year, 1 mm or more falls.
Rain and snow by month
Millimetres
56 cm of snow in a typical year
From November to March snow is likely; January is the peak, at about 22 cm.
Snowfall by month
Centimetres
Pitt Meadows publishes no full year of snowfall, so these figures come from Abbotsford, 22 km away.
Heating a home in Langley
88% of a year’s heating need falls between October and April. Months averaging under 10°C: November to April.
Each day the mean sits under 18°C adds its shortfall; a year’s total is its heating degree days. In heating terms, homes need less heating than 96% of Canadian towns.
Living with Langley’s climate
What the normals mean for a garden, a day outside and the depth of winter.
About 201 days a year pass without frost, from an average last frost of 11 April to a first of 30 October.
The comfortable months for a day outside, highs of 17–27°C and nights of 8°C or more: Jun, Jul, Aug and Sep.
Parks & trails →Summer brings about 26 days when the humidex passes 30.
Extremes don’t show in averages: floods, wildfire smoke and ice storms are on Langley’s hazards page.
Flood & hazards →ECCC’s normals location: Pitt Meadows
The page’s figures are ECCC’s 1991–2020 normals for Pitt Meadows, one of its 450 normals locations.
| Distance from the town | 12 km north-west |
| Station altitude | 5 m |
| Completeness | meets the WMO “3 and 5” rule |
| WMO standard normals | No |
| Snowfall from | Abbotsford, 22 km |
| Coldest reading, 1991–2020 | −16.3°C |
| Hottest reading, 1991–2020 | 37.6°C |
| Average wind | 4.8 km/h on average, most often from the east |
| Next-nearest location | Abbotsford, 22 km |
How Langley compares
Against the 2,611 Canadian towns and neighbourhoods of 2,500 or more, each read from its own normals location; the dots are the other locations those towns use in British Columbia.
Nearby towns’ climate
The nearest places on a normals location of their own: those that share Langley’s would only repeat its figures. No closer places have figures: these lie 23–29 km from Langley.
| Town | July high | January low | Rain & snow |
|---|---|---|---|
| Langley Pitt Meadows | 25.0°C | 0.5°C | 1,649 mm |
| Mission 23 km · Abbotsford | 24.4°C 0.6°C cooler | 0.6°C about the same | 1,505 mm |
| Delta 27 km · Vancouver International (Airport) | 22.4°C 2.6°C cooler | 1.4°C 0.9°C milder | 1,160 mm |
| Burnaby 29 km · Vancouver (Harbour) | 23.0°C 2.0°C cooler | 3.3°C 2.8°C milder | 1,537 mm |
Langley weather by month
Each month’s normals, 1991–2020: high, low, mean, precipitation and snowfall.
| Month | High | Low | Mean | Rain & snow | Snow |
|---|---|---|---|---|---|
| January | 6.8°C | 0.5°C | 3.6°C | 252 mm | 22 cm |
| February | 8.8°C | 0.4°C | 4.6°C | 134 mm | 7 cm |
| March | 11.3°C | 2.3°C | 6.8°C | 173 mm | 5 cm |
| April | 14.9°C | 4.5°C | 9.7°C | 105 mm | 1 cm |
| May | 19.0°C | 7.9°C | 13.5°C | 95 mm | 0 cm |
| June | 21.3°C | 10.8°C | 16.1°C | 69 mm | 0 cm |
| July | 25.0°C | 12.6°C | 18.8°C | 48 mm | 0 cm |
| August | 25.1°C | 12.4°C | 18.8°C | 36 mm | 0 cm |
| September | 21.5°C | 9.8°C | 15.7°C | 94 mm | 0 cm |
| October | 15.0°C | 5.9°C | 10.5°C | 180 mm | 0 cm |
| November | 9.6°C | 2.4°C | 6.0°C | 249 mm | 7 cm |
| December | 6.1°C | 0.1°C | 3.1°C | 214 mm | 14 cm |
| Year | 15.4°C | 5.8°C | 10.6°C | 1,649 mm | 56 cm |
From year to year, February moves by 1.7°C, more than any month, and October least
Over 1991–2020, September saw both 0.9°C (2000) and 34.4°C (2017), the widest span of any month.
Where Langley’s numbers come from
Averages over 30 years, not a forecast.
- Normals: the 1991–2020 Canadian Climate Normals at Pitt Meadows, the closest ECCC location with twelve months of temperature normals.
- Other locations: where a location publishes no full year of precipitation or snowfall, the nearest one that does supplies it, named beside those figures.
- Comparisons: Canadian towns and neighbourhoods of at least 2,500, each placed by its nearest location (city totals and reserves excluded).
- Not on this page: hours of sunshine, missing from the 1991–2020 normals, and a height correction: the town has no elevation on file.
Canadian Climate Normals 1991–2020 · ECCC Data Services End-use Licence. Data Source: Environment and Climate Change Canada
Questions about Langley’s climate
How warm does Langley get in summer?
Midsummer means August, with afternoons near 25.1°C on a typical day.
How cold does Langley get in winter?
The coldest nights come in December, averaging 0.1°C.
How much rain and snow does Langley get?
Rain and snow add up to about 1,649 mm of water a year; January brings the most (252 mm), August the least (36 mm).
Are these figures for Langley itself?
They come from Pitt Meadows, which ECCC uses as the nearest normals location for Langley.
Data Source: Environment and Climate Change Canada · ECCC Data Services End-use Licence Today’s forecast for Langley →
Adapted from Statistics Canada (Census of Population 2021, population estimates 2025, 2021 census boundaries) under the Statistics Canada Open Licence; this does not constitute an endorsement by Statistics Canada. Neighbourhood names in some cities © OpenStreetMap contributors (ODbL).