Spanish ValleyUT
This town in Utah has a population of 756.
Is Spanish Valley a good place to live?
Of the 120 Utah towns we compare, none has a lower share of residents below the poverty line than Spanish Valley. 85% of the land in Spanish Valley is conserved, above both Utah’s towns (3.4%) and U.S. towns (4.3%). Spanish Valley has fewer than 1,000 residents, too few for fair grades; the figures below are still real.
756 people, and everyone knows the way
In a town this size, neighbors are the best guide. Ask them anything.
Moving to Spanish Valley: who provides what
Spanish Valley is unincorporated, so San Juan County and regional agencies provide most services.
EPA SDWIS (Oct 9, 2026) · HIFLD + EIA-861 2025 · Census 2020 ZCTAs · NCES 2024–25 · registration: vote.gov, updated Mar 13, 2026.
The data
Ordered by what stands out in Spanish Valley.
Spanish Valley has set aside nearly a third of its land for conservation
27 miles of trail. Spanish Valley’s trail density is 1.9 miles per square mile.
Trails & parks © OpenStreetMap contributors · Conserved land: USGS PAD-US
Fewer young adults than Utah overall
The bachelor’s-degree share among adults 25 and older is 41%, against 38% across Utah. Adults 18 to 34 are 5% of residents (26% statewide); adults 35 to 64 are 53% of residents (34% statewide). For Spanish Valley, the median age is 39.1 years.
| Spanish Valley | Utah towns | U.S. towns | |
|---|---|---|---|
| Bachelor’s degree or more, 25+ | 41% | 36% | 29% |
| Median age | 39.1 years | 32.6 years | 40.5 years |
Ages · share of residents
Education · adults 25 and older
Women and men · all residents
Somewhere between 10% and 79% women
The Census survey reached too few of Spanish Valley’s residents to say more: its margin here is ±34.1 points. Across Utah, 49.3% of residents are women.
| Spanish Valley | UT | U.S. | |
|---|---|---|---|
| Under 10 | 26.7% | 14.6% | 11.6% |
| 10 to 17 | 9% | 13.2% | 10.3% |
| 18 to 24 | 2.5% | 11.6% | 9.1% |
| 25 to 34 | 2.4% | 14.8% | 13.7% |
| 35 to 44 | 23.7% | 13.8% | 13.2% |
| 45 to 54 | 23% | 11% | 12.2% |
| 55 to 64 | 6.1% | 9.1% | 12.7% |
| 65 to 74 | 4.8% | 7.3% | 10.2% |
| 75 and older | 1.9% | 4.6% | 7% |
| No diploma | 0% | 6.6% | 10.4% |
| High school | 43.5% | 22.3% | 26% |
| Some college | 13.7% | 23.5% | 19.1% |
| Associate’s | 1.7% | 9.9% | 8.8% |
| Bachelor’s | 33.8% | 24.7% | 21.6% |
| Graduate | 7.3% | 13% | 14.1% |
U.S. Census Bureau · ACS 2020-2024 5-year estimates · in a town of 800, single groups can be off by several points
The FEMA risk score in Spanish Valley is lower than in the typical Utah or U.S. town
Of the losses FEMA expects in Spanish Valley, 40% come from avalanches and 23% from inland flooding. Expected storm and flood damage is lower than in 96% of U.S. communities.
FEMA National Risk Index · OpenFEMA
Typical low → high °F
NOAA U.S. Climate Normals, 1991–2020
A job hub: Spanish Valley has 1.2 jobs for every working resident and draws in 166 commuters
The top destinations are Monticello (28%), Moab (16%) and Blanding (11%). Just 4% of Spanish Valley’s working residents have a job in town. Jobs based in Spanish Valley grew to 172 in 2023, 83 more than in 2013. Half the trips to work are shorter than 44 miles.
| Spanish Valley | Utah towns | U.S. towns | |
|---|---|---|---|
| Working residents who work in town | 4% | 8.4% | 8% |
| Average trip to work | 23 minutes | 22 minutes | 25 minutes |
Where working residents work
Census LEHD 2023 · ACS
How healthy Spanish Valley is
Only 8 of the 119 Utah towns we compare have a higher share of adults who smoke cigarettes than Spanish Valley. The town does better than the Utah average on 2 of 32 CDC measures and worse on 10. Just over a tenth of Spanish Valley adults binge drink.
| Spanish Valley | Utah towns | U.S. towns | |
|---|---|---|---|
| Binge drink (CDC PLACES) | 11% | 11% | 16% |
| Frequent physical distress (CDC PLACES) | 15% | 12% | 14% |
| Yearly checkup (CDC PLACES) | 74% | 72% | 79% |
| Feel lonely (CDC PLACES) | 31% | 33% | 33% |
| What stands out | Spanish Valley | UT |
|---|---|---|
| Fewer older adults who have lost all their teeth | 6.7% | 9.8% |
| More adults treating high blood pressure | 72% | 65.6% |
| More adults with COPD | 6.9% | 4.6% |
CDC PLACES 2025 · modeled estimates for adults · CMS · HRSA
Arches National Park and 5 more within 40 miles
Museums, parks, gardens and other places to visit around Spanish Valley. Close and well known come first.
 Big draw11 mi National ParkArches National Park1.5M visitors a year
 17 mi National ParkCanyonlands National Park796K visitors a year
 17 mi State parkDead Horse Point State Park
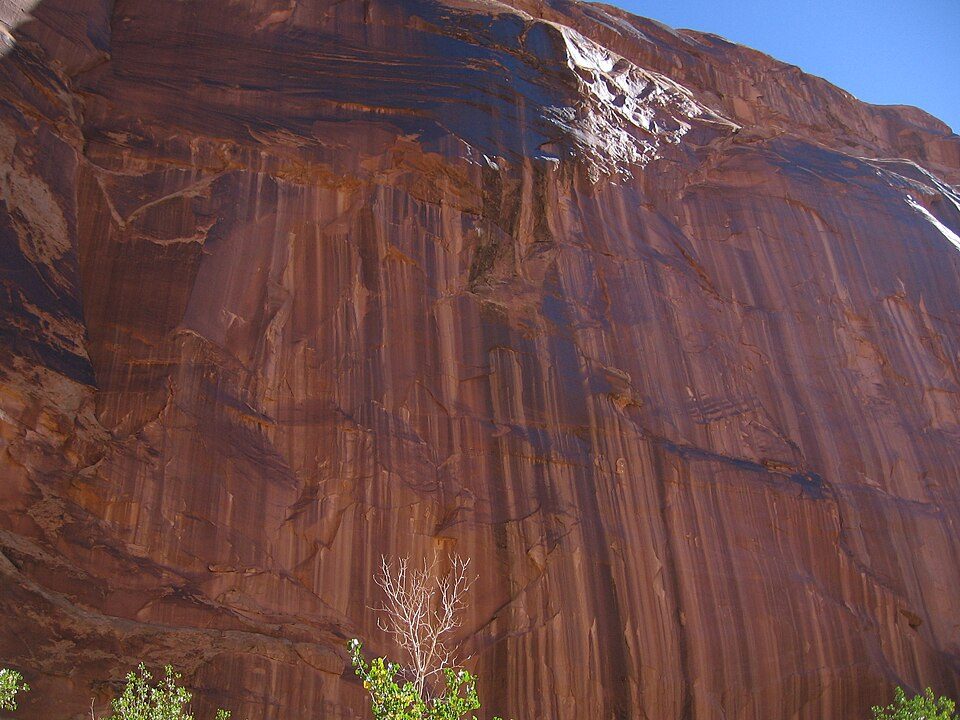 34 mi Canyon & gorgeHorseshoe Canyon
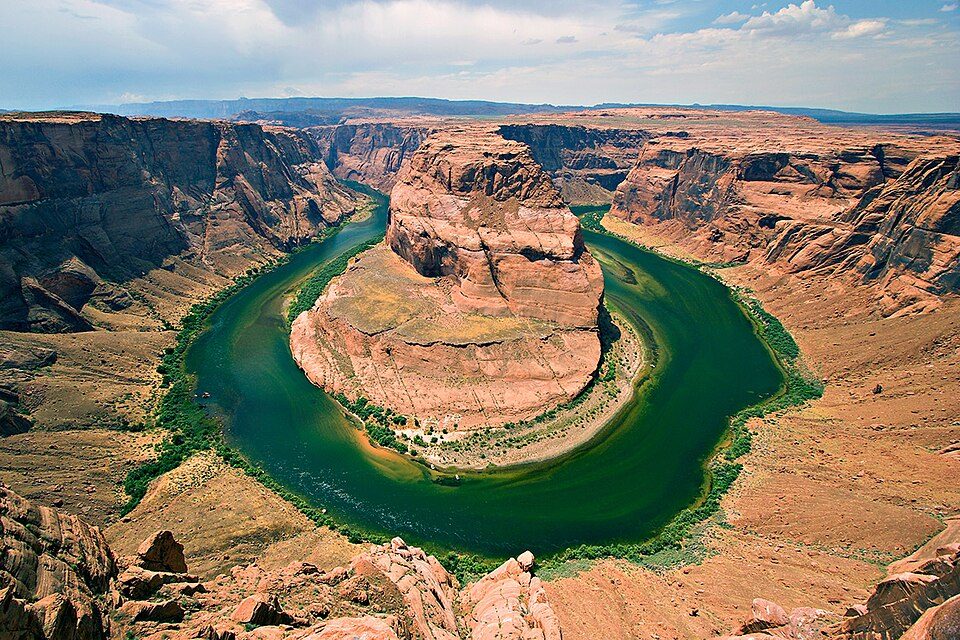 31 mi National Recreation AreaGlen Canyon National Recreation Area3.7M visitors a year
 34 mi Ancient siteNewspaper Rock State Historic Monument
Photo credits
Arches National Park: m01229 from USA, CC BY-SA 2.0 · Canyonlands National Park: Phil Armitage, Public domain · Dead Horse Point State Park: Nikater, Public domain · Horseshoe Canyon: Surfsupusa at en.wikipedia, CC0 · Glen Canyon National Recreation Area: User:Moondigger, CC BY-SA 2.5 · Newspaper Rock State Historic Monument: Unknown, CC BY-SA 3.0


Everything we know about Spanish Valley
Colleges nearby
None within 15 miles of Spanish Valley; the nearest are
About 3 of every 100 Spanish Valley residents are enrolled in college, against 8 across Utah.
Questions about Spanish Valley
Short answers, built from the data on this page.
Is Spanish Valley, UT a good place to live?
Spanish Valley has fewer than 1,000 residents, too few for fair grades; the figures below are still real.