Guest, Sign inJoin
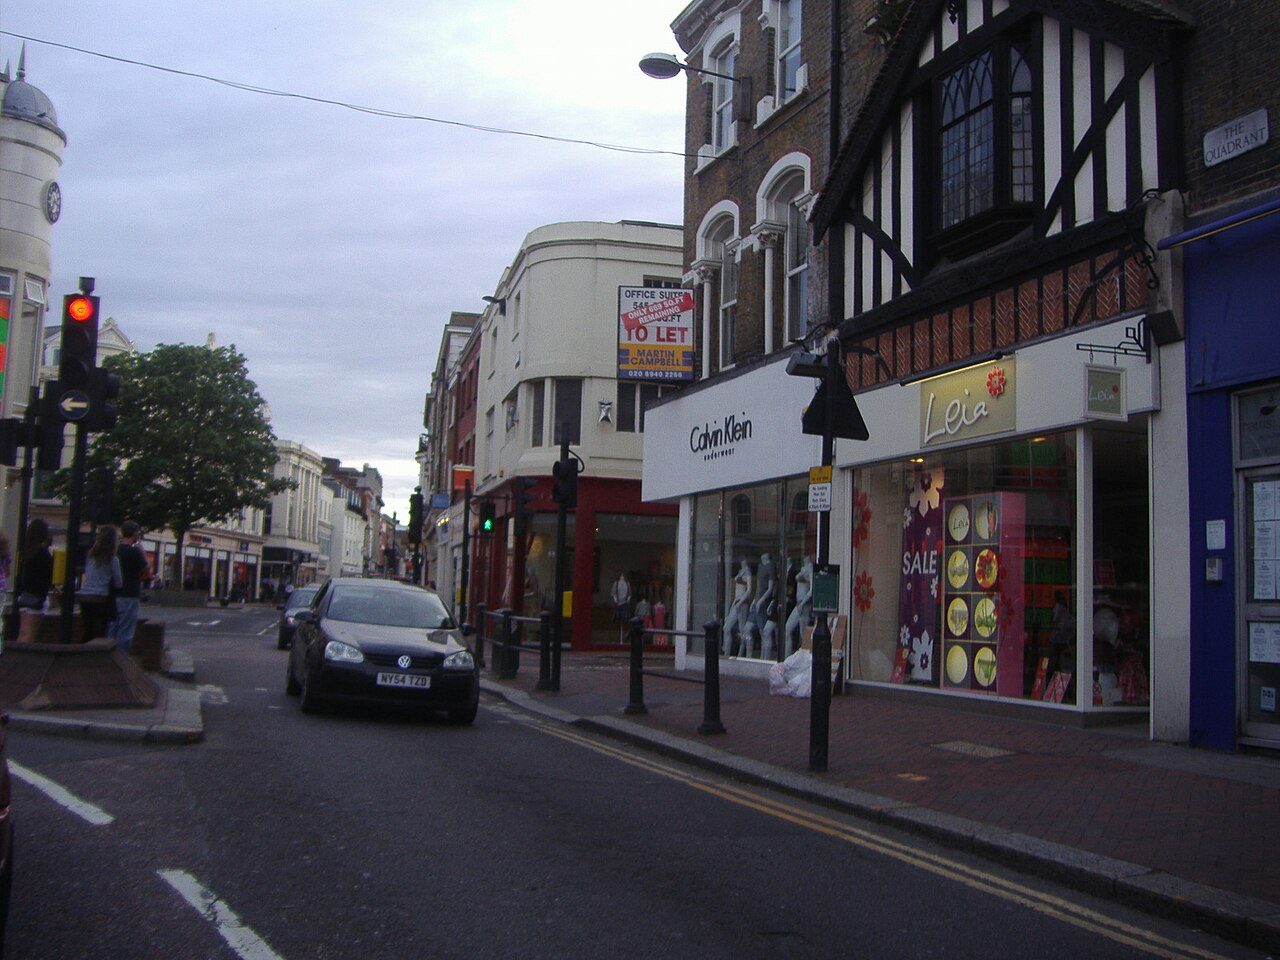
The Quadrant, Richmond town centrePhoto: David Howard · CC BY-SA 2.0
A+School Grade
Schools in Richmond upon Thames · DfE, Ofsted

Richmond upon Thames’s state schools are in the top tenth: better results than 98% of towns in England

Attainment 8, the average across eight GCSEs, is 57.7 at Richmond upon Thames’s secondaries, above both London’s towns (51.7) and towns in England (45.9). 60 state-funded schools are located in Richmond upon Thames’s built-up area. Richmond upon Thames grades A+ for schools, on Department for Education Key Stage 2 and GCSE results: #1 of 33 in London. Ofsted is shown, not graded.

State schools
60
45 primary, 11 secondary
Reading, writing & maths
77%
meet the expected standard at 11 · 2023–25
England’s schools: 62%
Attainment 8
57.7
GCSE average across 8 subjects · 2025/26
England’s schools: 47.3
Grade 5+ English & maths
67%
a strong pass in both · 2025/26
England’s schools: 47%

Town figures are pupil-weighted across the schools the grade uses; England’s are the average school.

What stands out · In brief

What stands out about Richmond upon Thames’s schools

Strong at both ages

Richmond upon Thames’s secondary results beat 97% of English towns; its primary results beat 97%. 77% of the London borough’s 11-year-olds meet the expected standard in reading, writing and maths, against 62% at the average school in England and 76% across Richmond upon Thames. The spread between primaries is wide: 94% at Barnes Primary School, 49% at Darell Primary and Nursery School. Every school’s result ↓

Lowther beats its intake

Schools with more pupils on free school meals usually get lower results. At Lowther Primary School, 26% of pupils are on free school meals and 80% meet the expected standard; a typical school in England with that intake reaches 61%. Results and intake ↓

Written from the Department for Education and Ofsted data on this page.

School Grade

Richmond upon Thames grades A+ for schools

Against every town in England with results; Wales publishes none.

Primary: reading, writing and maths at 11 (77% meet the standard)Better than 97% of towns in England
Secondary: Attainment 8 and grade 5+ English and maths (57.7 and 67%)Better than 97% of towns in England
Each of Richmond upon Thames’s 40 primaries: % meeting the expected standard in reading, writing and maths (2023–25)40%50%60%70%80%90%100%England 62%Richmond upon Thames 76%Darell Primary and Nursery School: 49% · C−Nelson Primary School: 52% · C−Buckingham Primary School: 56% · CSt Richard's Church of England Primary School: 63% · B−Twickenham Primary Academy: 64% · B−Stanley Primary School: 66% · BHeathfield Junior School: 67% · BSacred Heart Catholic Primary School: 67% · BSt John the Baptist Church of England Junior School: 67% · BSt Mary's Hampton Church of England Primary: 68% · B+Kew Riverside Primary School: 71% · A−Hampton Hill Junior School: 72% · A−Trafalgar Junior School: 72% · A−Bishop Perrin Church of England Primary School: 74% · A−Holy Trinity Church of England Primary School: 74% · A−Orleans Primary School: 74% · A−St Mary Magdalen's Catholic Primary School: 76% · AThe Russell Primary School: 76% · AHampton Junior School: 77% · ASt Edmund's Catholic Primary School: 78% · ASt Elizabeth's Catholic Primary School: 78% · ASt Osmund's Catholic Primary School: 78% · ALowther Primary School: 80% · AThe Vineyard School: 80% · AArchdeacon Cambridge's Church of England Primary School: 81% · AEast Sheen Primary School: 81% · ASt Stephen's C E Primary School: 81% · AChase Bridge Primary School: 82% · ASheen Mount Primary School: 82% · ASt Mary's Church of England Primary School: 82% · ACollis Primary School: 83% · A+The King's Church of England Primary School: 84% · A+St Mary's and St Peter's Church of England Primary School: 85% · A+Thomson House School: 85% · A+Meadlands Primary School: 86% · A+St James's Catholic Primary School: 86% · A+Marshgate Primary School: 87% · A+St Richard Reynolds Catholic Primary School: 91% · A+Deer Park School: 93% · A+Barnes Primary School: 94% · A+
Each of Richmond upon Thames’s 11 secondaries: Attainment 8 (2025/26)455055606570England 47Richmond upon Thames 57Hampton High: 46 · B−Twickenham School: 49 · B−Lift Richmond Park: 52 · A−The Richmond upon Thames School: 53 · A−Teddington School: 56 · AChrist's Church of England Comprehensive Secondary School: 56 · ATuring House School: 57 · AGrey Court School: 62 · ASt Richard Reynolds Catholic High School: 64 · A+Waldegrave School: 65 · AOrleans Park School: 66 · A+
England’s average schoolRichmond upon Thames’s average school

The primary figure: 40 primaries in the town, 6,831 pupils in results over three years. The secondary figure: 11 secondaries in the town, 2,018 pupils in results. Mainstream state schools only (grammar schools included); special schools, alternative provision, nurseries and 16–19 colleges are listed below but not graded. Each school’s results are compared with every school in England, then weighted by its pupils.

Map

Where Richmond upon Thames’s 60 state schools are

Each school at its address, coloured by its own letter and sized by pupils. Open a school for its own page. The dashed shape is Richmond upon Thames’s built-up area.

Capella House School · no letter · 78 pupilsWindham Nursery School · no letter · 83 pupilsStrathmore School · no letter · 108 pupilsClarendon School · no letter · 164 pupilsKew Riverside Primary School · A− · 84 pupilsTrafalgar Infant School · no letter · 133 pupilsSt Mary Magdalen's Catholic Primary School · A · 152 pupilsSt Richard's Church of England Primary School · B− · 153 pupilsSacred Heart Catholic Primary School · B · 160 pupilsSt Mary's Hampton Church of England Primary · B+ · 161 pupilsHampton Wick Infant and Nursery School · no letter · 165 pupilsSt Osmund's Catholic Primary School · A · 167 pupilsDarell Primary and Nursery School · C− · 192 pupilsBishop Perrin Church of England Primary School · A− · 204 pupilsThe Russell Primary School · A · 207 pupilsSt Richard Reynolds Catholic Primary School · A+ · 210 pupilsCarlisle Infant School · no letter · 212 pupilsSt Elizabeth's Catholic Primary School · A · 212 pupilsSt John the Baptist Church of England Junior School · B · 212 pupilsMeadlands Primary School · A+ · 221 pupilsNelson Primary School · C− · 227 pupilsLowther Primary School · A · 244 pupilsTrafalgar Junior School · A− · 274 pupilsHeathfield Infant School · no letter · 286 pupilsHampton Hill Junior School · A− · 306 pupilsHoly Trinity Church of England Primary School · A− · 309 pupilsThomson House School · A+ · 366 pupilsHeathfield Junior School · B · 370 pupilsHampton Infant School and Nursery · no letter · 372 pupilsBuckingham Primary School · C · 377 pupilsTwickenham Primary Academy · B− · 380 pupilsStanley Primary School · B · 385 pupilsMarshgate Primary School · A+ · 389 pupilsThe King's Church of England Primary School · A+ · 397 pupilsDeer Park School · A+ · 417 pupilsSt Stephen's C E Primary School · A · 417 pupilsOrleans Primary School · A− · 429 pupilsArchdeacon Cambridge's Church of England Primary School · A · 440 pupilsSt Edmund's Catholic Primary School · A · 442 pupilsBarnes Primary School · A+ · 470 pupilsHampton Junior School · A · 474 pupilsThe Vineyard School · A · 516 pupilsEast Sheen Primary School · A · 593 pupilsSheen Mount Primary School · A · 598 pupilsSt Mary's Church of England Primary School · A · 619 pupilsSt Mary's and St Peter's Church of England Primary School · A+ · 621 pupilsChase Bridge Primary School · A · 656 pupilsSt James's Catholic Primary School · A+ · 669 pupilsCollis Primary School · A+ · 704 pupilsThe Richmond upon Thames School · A− · 760 pupilsTwickenham School · B− · 774 pupilsHampton High · B− · 847 pupilsLift Richmond Park · A− · 1,046 pupilsTuring House School · A · 1,047 pupilsChrist's Church of England Comprehensive Secondary School · A · 1,050 pupilsSt Richard Reynolds Catholic High School · A+ · 1,175 pupilsOrleans Park School · A+ · 1,403 pupilsTeddington School · A · 1,405 pupilsWaldegrave School · A · 1,470 pupilsGrey Court School · A · 1,650 pupils© OpenStreetMap contributors
PrimarySecondarySpecial, nursery, 16–19Size: pupilsABCDNo letter

Most schools give places by distance once siblings are in, so the schools nearest a home matter more than any league table.

Results and intake

Which schools do better than their intake suggests

Schools with more pupils on free school meals tend to get lower results. The dashed line is the typical school in England for each level of free school meals; the band holds the middle two-thirds. A dot above the band is doing better than schools like it.

Primaries: KS2 reading, writing and maths against free school meals40%50%60%70%80%90%100%0%10%20%30%40%50%Pupils on free school meals →typical school in EnglandArchdeacon Cambridge's Church of England Primary School: 81% with 4% on free school meals (a typical school with that intake: 67%)Barnes Primary School: 94% with 2% on free school meals (a typical school with that intake: 68%)Bishop Perrin Church of England Primary School: 74% with 12% on free school meals (a typical school with that intake: 65%)Buckingham Primary School: 56% with 41% on free school meals (a typical school with that intake: 57%)Chase Bridge Primary School: 82% with 13% on free school meals (a typical school with that intake: 65%)Collis Primary School: 83% with 8% on free school meals (a typical school with that intake: 67%)Darell Primary and Nursery School: 49% with 32% on free school meals (a typical school with that intake: 60%)Deer Park School: 93% with 6% on free school meals (a typical school with that intake: 67%)East Sheen Primary School: 81% with 18% on free school meals (a typical school with that intake: 64%)Hampton Hill Junior School: 72% with 17% on free school meals (a typical school with that intake: 64%)Hampton Junior School: 77% with 13% on free school meals (a typical school with that intake: 65%)Heathfield Junior School: 67% with 40% on free school meals (a typical school with that intake: 58%)Holy Trinity Church of England Primary School: 74% with 13% on free school meals (a typical school with that intake: 65%)Kew Riverside Primary School: 71% with 38% on free school meals (a typical school with that intake: 58%)Lowther Primary School: 80% with 26% on free school meals (a typical school with that intake: 61%)Marshgate Primary School: 87% with 9% on free school meals (a typical school with that intake: 66%)Meadlands Primary School: 86% with 15% on free school meals (a typical school with that intake: 65%)Nelson Primary School: 52% with 22% on free school meals (a typical school with that intake: 63%)Orleans Primary School: 74% with 7% on free school meals (a typical school with that intake: 67%)Sacred Heart Catholic Primary School: 67% with 20% on free school meals (a typical school with that intake: 63%)Sheen Mount Primary School: 82% with 3% on free school meals (a typical school with that intake: 68%)St Edmund's Catholic Primary School: 78% with 7% on free school meals (a typical school with that intake: 67%)St Elizabeth's Catholic Primary School: 78% with 4% on free school meals (a typical school with that intake: 68%)St James's Catholic Primary School: 86% with 3% on free school meals (a typical school with that intake: 68%)St John the Baptist Church of England Junior School: 67% with 15% on free school meals (a typical school with that intake: 64%)St Mary Magdalen's Catholic Primary School: 76% with 23% on free school meals (a typical school with that intake: 62%)St Mary's and St Peter's Church of England Primary School: 85% with 7% on free school meals (a typical school with that intake: 67%)St Mary's Church of England Primary School: 82% with 4% on free school meals (a typical school with that intake: 68%)St Mary's Hampton Church of England Primary: 68% with 21% on free school meals (a typical school with that intake: 63%)St Osmund's Catholic Primary School: 78% with 6% on free school meals (a typical school with that intake: 67%)St Richard Reynolds Catholic Primary School: 91% with 6% on free school meals (a typical school with that intake: 67%)St Richard's Church of England Primary School: 63% with 44% on free school meals (a typical school with that intake: 56%)St Stephen's C E Primary School: 81% with 7% on free school meals (a typical school with that intake: 67%)Stanley Primary School: 66% with 34% on free school meals (a typical school with that intake: 59%)The King's Church of England Primary School: 84% with 9% on free school meals (a typical school with that intake: 66%)The Russell Primary School: 76% with 17% on free school meals (a typical school with that intake: 64%)The Vineyard School: 80% with 5% on free school meals (a typical school with that intake: 67%)Thomson House School: 85% with 10% on free school meals (a typical school with that intake: 66%)Trafalgar Junior School: 72% with 20% on free school meals (a typical school with that intake: 63%)Twickenham Primary Academy: 64% with 15% on free school meals (a typical school with that intake: 65%)Deer ParkBarnesSt Richard ReynoldsMeadlands
Secondaries: Attainment 8 against free school meals404550556065700%10%20%30%40%Pupils on free school meals →typical school in EnglandChrist's Church of England Comprehensive Secondary School: 56 with 23% on free school meals (a typical school with that intake: 50)Grey Court School: 62 with 12% on free school meals (a typical school with that intake: 53)Hampton High: 46 with 35% on free school meals (a typical school with that intake: 46)Lift Richmond Park: 52 with 32% on free school meals (a typical school with that intake: 47)Orleans Park School: 66 with 9% on free school meals (a typical school with that intake: 55)St Richard Reynolds Catholic High School: 64 with 9% on free school meals (a typical school with that intake: 55)Teddington School: 56 with 19% on free school meals (a typical school with that intake: 51)The Richmond upon Thames School: 53 with 21% on free school meals (a typical school with that intake: 50)Turing House School: 57 with 16% on free school meals (a typical school with that intake: 52)Twickenham School: 49 with 35% on free school meals (a typical school with that intake: 45)Waldegrave School: 65 with 10% on free school meals (a typical school with that intake: 54)Orleans ParkWaldegraveSt Richard ReynoldsGrey Court

The share of pupils on free school meals runs from 2% at Barnes Primary School to 44% at St Richard's Church of England Primary School. Against schools with the same intake, Deer Park School does best: 93% with 6% on free school meals, where a typical school would reach 67%. 36 of 40 primaries and 11 of 11 secondaries are above the line.

Show as a table
SchoolFree school mealsResultTypical for that intakeDifference
Deer Park SchoolKS2 %6%93%67%+26
Barnes Primary SchoolKS2 %2%94%68%+26
St Richard Reynolds Catholic Primary SchoolKS2 %6%91%67%+24
Meadlands Primary SchoolKS2 %15%86%65%+21
Marshgate Primary SchoolKS2 %9%87%66%+21
Thomson House SchoolKS2 %10%85%66%+19
Lowther Primary SchoolKS2 %26%80%61%+19
St Mary's and St Peter's Church of England Primary SchoolKS2 %7%85%67%+18
St James's Catholic Primary SchoolKS2 %3%86%68%+18
The King's Church of England Primary SchoolKS2 %9%84%66%+18
East Sheen Primary SchoolKS2 %18%81%64%+17
Chase Bridge Primary SchoolKS2 %13%82%65%+17
Collis Primary SchoolKS2 %8%83%67%+16
St Mary's Church of England Primary SchoolKS2 %4%82%68%+14
Sheen Mount Primary SchoolKS2 %3%82%68%+14
St Stephen's C E Primary SchoolKS2 %7%81%67%+14
St Mary Magdalen's Catholic Primary SchoolKS2 %23%76%62%+14
Archdeacon Cambridge's Church of England Primary SchoolKS2 %4%81%67%+14
Kew Riverside Primary SchoolKS2 %38%71%58%+13
The Vineyard SchoolKS2 %5%80%67%+13
The Russell Primary SchoolKS2 %17%76%64%+12
Hampton Junior SchoolKS2 %13%77%65%+12
Orleans Park SchoolAttainment 89%6655+12
St Edmund's Catholic Primary SchoolKS2 %7%78%67%+11
St Osmund's Catholic Primary SchoolKS2 %6%78%67%+11
St Elizabeth's Catholic Primary SchoolKS2 %4%78%68%+10
Waldegrave SchoolAttainment 810%6554+10
Heathfield Junior SchoolKS2 %40%67%58%+9
St Richard Reynolds Catholic High SchoolAttainment 89%6455+9
Holy Trinity Church of England Primary SchoolKS2 %13%74%65%+9
Trafalgar Junior SchoolKS2 %20%72%63%+9
Bishop Perrin Church of England Primary SchoolKS2 %12%74%65%+9
Grey Court SchoolAttainment 812%6253+8
Hampton Hill Junior SchoolKS2 %17%72%64%+8
Orleans Primary SchoolKS2 %7%74%67%+7
St Richard's Church of England Primary SchoolKS2 %44%63%56%+7
Stanley Primary SchoolKS2 %34%66%59%+7
Christ's Church of England Comprehensive Secondary SchoolAttainment 823%5650+7
St Mary's Hampton Church of England PrimaryKS2 %21%68%63%+5
Lift Richmond ParkAttainment 832%5247+5
Turing House SchoolAttainment 816%5752+5
Teddington SchoolAttainment 819%5651+5
Sacred Heart Catholic Primary SchoolKS2 %20%67%63%+4
Twickenham SchoolAttainment 835%4945+3
The Richmond upon Thames SchoolAttainment 821%5350+3
St John the Baptist Church of England Junior SchoolKS2 %15%67%64%+3
Hampton HighAttainment 835%4646+0
Twickenham Primary AcademyKS2 %15%64%65%−1
Buckingham Primary SchoolKS2 %41%56%57%−1
Nelson Primary SchoolKS2 %22%52%63%−11
Darell Primary and Nursery SchoolKS2 %32%49%60%−11

Free school meals: pupils eligible now, DfE January 2026 census. The typical-school line is a straight-line fit across every graded school in England. It describes; it doesn’t grade: the School Grade uses results alone.

Getting a place

How school places work in Richmond upon Thames

Richmond upon Thames Council handles applications for every state school in Richmond upon Thames, academies included. You apply to the council where you live, even for a school in another area.

Secondary (starting at 11)Apply by 31 October of Year 6. Offers on 1 March.
Primary (starting in Reception)Apply by 15 January before the September your child starts. Offers on 16 April.
Moving mid-yearApply to the council for an in-year place; it tells you which schools have room.

When a school is full

Every school publishes its admissions rules. Children in care come first, then, at most schools, brothers and sisters of current pupils, then those who live nearest. 19 of Richmond upon Thames’s 56 mainstream schools have a religious character; some of them give priority by church attendance, so check each school’s rules. Infant classes are limited to 30 by law. If you’re refused a place, you can appeal to an independent panel.

Useful: Apply for a primary place (GOV.UK) · Apply for a secondary place (GOV.UK) · How admissions criteria work

How full each school is

Pupils on roll as a share of the school’s official capacity. The black tick is 100%; 8 schools are at or over it.

Grey Court118%
Waldegrave118%
Christ's113%
St Richard Reynolds107%
Meadlands incl. nursery105%
Chase Bridge incl. nursery104%
Orleans Park103%
St Richard Reynolds100%
Turing House100%
Deer Park99%
Show all 55 schools
St Stephen's C E99%
Hampton Junior99%
St Mary's and St Peter's99%
St Mary's98%
Barnes incl. nursery98%
Teddington98%
Bishop Perrin97%
St James's incl. nursery97%
The Richmond upon Thames97%
Collis incl. nursery96%
Lift Richmond Park95%
Sheen Mount95%
The King's95%
East Sheen94%
Hampton High94%
Hampton Infant incl. nursery94%
Orleans incl. nursery94%
St Edmund's incl. nursery94%
Archdeacon Cambridge's incl. nursery93%
Marshgate93%
Heathfield Junior93%
Trafalgar Junior91%
Twickenham90%
Carlisle Infant88%
St John the Baptist88%
The Russell incl. nursery88%
Thomson House87%
Hampton Hill Junior84%
Stanley incl. nursery83%
Heathfield Infant incl. nursery82%
The Vineyard82%
St Elizabeth's79%
St Mary's Hampton77%
Trafalgar Infant74%
St Mary Magdalen's72%
Hampton Wick Infant incl. nursery71%
Sacred Heart incl. nursery67%
Holy Trinity incl. nursery65%
St Richard's incl. nursery65%
St Osmund's62%
Buckingham incl. nursery60%
Lowther incl. nursery58%
Nelson incl. nursery55%
Darell incl. nursery46%
Kew Riverside40%

DfE register of schools (GIAS), January 2026 census. Capacity often excludes a nursery class, so a school with a nursery can show over 100%.

The schools

60 state schools in Richmond upon Thames

Each school’s own letter compares its results with every state school in England of the same phase: Key Stage 2 for primaries, GCSEs for secondaries. Open a school for its results, how its letter is worked out, Ofsted and a map.

Letters of Richmond upon Thames’s schoolsA 39B 9C 3D 09 without a letter
Primary schools45 · best KS2 results first
Barnes Primary School
Primary · ages 3–11 · Community
A+
94% met the KS2 standard (3 years)
470 pupilsOfsted: Outstanding 2022
Deer Park School
Primary · ages 4–11 · Free school
A+
93% met the KS2 standard (3 years)
417 pupilsOfsted: Outstanding 2024
St Richard Reynolds Catholic Primary School
Primary · ages 4–11 · Academy · Roman Catholic
A+
91% met the KS2 standard (3 years)
210 pupilsOfsted: Outstanding 2024
Marshgate Primary School
Primary · ages 4–11 · Community
A+
87% met the KS2 standard (3 years)
389 pupilsOfsted: Inspected 2025
St James's Catholic Primary School
Primary · ages 3–11 · Voluntary aided · Roman Catholic
A+
86% met the KS2 standard (3 years)
669 pupilsOfsted: Inspected 2024
Meadlands Primary School
Primary · ages 3–11 · Community
A+
86% met the KS2 standard (3 years)
221 pupilsOfsted: report card 2026
St Mary's and St Peter's Church of England Primary School
Primary · ages 4–11 · Voluntary aided · Church of England
A+
85% met the KS2 standard (3 years)
621 pupilsOfsted: Outstanding 2022
The King's Church of England Primary School
Primary · ages 4–11 · Voluntary aided · Church of England
A+
84% met the KS2 standard (3 years)
397 pupilsOfsted: Good 2024
Thomson House School
Primary · ages 4–11 · Free school
A+
85% met the KS2 standard (3 years)
366 pupilsOfsted: Inspected 2025
Collis Primary School
Primary · ages 3–11 · Community
A+
83% met the KS2 standard (3 years)
704 pupilsOfsted: Inspected 2025
Chase Bridge Primary School
Primary · ages 3–11 · Community
A
82% met the KS2 standard (3 years)
656 pupilsOfsted: Inspected 2025
St Mary's Church of England Primary School
Primary · ages 4–11 · Voluntary aided · Church of England
A
82% met the KS2 standard (3 years)
619 pupilsOfsted: Outstanding 2023
Sheen Mount Primary School
Primary · ages 4–11 · Community
A
82% met the KS2 standard (3 years)
598 pupilsOfsted: report card 2026
East Sheen Primary School
Primary · ages 4–11 · Community
A
81% met the KS2 standard (3 years)
593 pupilsOfsted: Outstanding 2023
Archdeacon Cambridge's Church of England Primary School
Primary · ages 3–11 · Voluntary aided · Church of England
A
81% met the KS2 standard (3 years)
440 pupilsOfsted: Good 2023
St Stephen's C E Primary School
Primary · ages 4–11 · Voluntary aided · Church of England
A
81% met the KS2 standard (3 years)
417 pupilsOfsted: Good 2024
The Vineyard School
Primary · ages 4–11 · Community
A
80% met the KS2 standard (3 years)
516 pupilsOfsted: Good 2023
Lowther Primary School
Primary · ages 3–11 · Community
A
80% met the KS2 standard (3 years)
244 pupilsOfsted: Good 2023
St Edmund's Catholic Primary School
Primary · ages 3–11 · Voluntary aided · Roman Catholic
A
78% met the KS2 standard (3 years)
442 pupilsOfsted: Good 2022
St Elizabeth's Catholic Primary School
Primary · ages 4–11 · Academy · Roman Catholic
A
78% met the KS2 standard (3 years)
212 pupilsOfsted: Outstanding 2023
St Osmund's Catholic Primary School
Primary · ages 4–11 · Academy · Roman Catholic
A
78% met the KS2 standard (3 years)
167 pupils
Hampton Junior School
Primary · ages 7–11 · Community
A
77% met the KS2 standard (3 years)
474 pupilsOfsted: Outstanding 2024
The Russell Primary School
Primary · ages 3–11 · Community
A
76% met the KS2 standard (3 years)
207 pupilsOfsted: Good 2023
St Mary Magdalen's Catholic Primary School
Primary · ages 4–11 · Voluntary aided · Roman Catholic
A
76% met the KS2 standard (3 years)
152 pupilsOfsted: Good 2024
Show all 45 primary schools
Orleans Primary School
Primary · ages 3–11 · Community
A−
74% met the KS2 standard (3 years)
429 pupilsOfsted: Good 2024
Holy Trinity Church of England Primary School
Primary · ages 3–11 · Voluntary aided · Church of England
A−
74% met the KS2 standard (3 years)
309 pupilsOfsted: Inspected 2025
Bishop Perrin Church of England Primary School
Primary · ages 4–11 · Voluntary aided · Church of England
A−
74% met the KS2 standard (3 years)
204 pupilsOfsted: Outstanding 2024
Hampton Hill Junior School
Primary · ages 7–11 · Community
A−
72% met the KS2 standard (3 years)
306 pupilsOfsted: Good 2023
Trafalgar Junior School
Primary · ages 7–11 · Community
A−
72% met the KS2 standard (3 years)
274 pupilsOfsted: Good 2023
Kew Riverside Primary School
Primary · ages 4–11 · Community
A−
71% met the KS2 standard (3 years)
84 pupilsOfsted: report card 2026
St Mary's Hampton Church of England Primary
Primary · ages 4–11 · Free school · Church of England
B+
68% met the KS2 standard (3 years)
161 pupilsOfsted: Inspected 2024
Heathfield Junior School
Primary · ages 7–11 · Community
B
67% met the KS2 standard (3 years)
370 pupilsOfsted: Good 2024
St John the Baptist Church of England Junior School
Primary · ages 7–11 · Voluntary aided · Church of England
B
67% met the KS2 standard (3 years)
212 pupilsOfsted: Good 2024
Sacred Heart Catholic Primary School
Primary · ages 3–11 · Voluntary aided · Catholic
B
67% met the KS2 standard (3 years)
160 pupilsOfsted: Good 2023
Stanley Primary School
Primary · ages 3–11 · Community
B
66% met the KS2 standard (3 years)
385 pupilsOfsted: Good 2024
Twickenham Primary Academy
Primary · ages 4–11 · Free school
B−
64% met the KS2 standard (3 years)
380 pupilsOfsted: Inspected 2024
St Richard's Church of England Primary School
Primary · ages 3–11 · Voluntary aided · Church of England
B−
63% met the KS2 standard (3 years)
153 pupilsOfsted: Good 2023
Buckingham Primary School
Primary · ages 3–11 · Community
C
56% met the KS2 standard (3 years)
377 pupilsOfsted: Inspected 2024
Nelson Primary School
Primary · ages 3–11 · Academy
C−
52% met the KS2 standard (3 years)
227 pupilsOfsted: Good 2023
Darell Primary and Nursery School
Primary · ages 3–11 · Community
C−
49% met the KS2 standard (3 years)
192 pupilsOfsted: Good 2023
Hampton Infant School and Nursery
Primary · ages 3–7 · Community
No letter
372 pupilsOfsted: Outstanding 2023
Heathfield Infant School
Primary · ages 3–7 · Community
No letter
286 pupilsOfsted: Inspected 2025
Carlisle Infant School
Primary · ages 4–7 · Community
No letter
212 pupilsOfsted: Good 2023
Hampton Wick Infant and Nursery School
Primary · ages 3–7 · Community
No letter
165 pupilsOfsted: Outstanding 2023
Trafalgar Infant School
Primary · ages 5–7 · Community
No letter
133 pupilsOfsted: Good 2023
Secondary schools11 · best GCSE results first
Orleans Park School
Secondary · ages 11–18 · Academy
A+
66.4 Attainment 8 · 79% grade 5+ E&M
1,403 pupilsOfsted: Outstanding 2023
St Richard Reynolds Catholic High School
Secondary · ages 11–18 · Academy · Roman Catholic
A+
63.9 Attainment 8 · 84% grade 5+ E&M
1,175 pupilsOfsted: Outstanding 2024
Grey Court School
Secondary · ages 11–18 · Academy
A
61.7 Attainment 8 · 78% grade 5+ E&M
1,650 pupilsOfsted: Outstanding 2024
Waldegrave School
Secondary · ages 11–18 · Academy
A
64.5 Attainment 8 · 76% grade 5+ E&M
1,470 pupilsOfsted: Inspected 2024
Turing House School
Secondary · ages 11–19 · Free school
A
56.8 Attainment 8 · 71% grade 5+ E&M
1,047 pupilsOfsted: Inspected 2024
Christ's Church of England Comprehensive Secondary School
Secondary · ages 11–19 · Voluntary aided · Church of England
A
56.4 Attainment 8 · 67% grade 5+ E&M
1,050 pupilsOfsted: report card 2026
Teddington School
Secondary · ages 11–18 · Academy
A
55.8 Attainment 8 · 62% grade 5+ E&M
1,405 pupilsOfsted: report card 2026
The Richmond upon Thames School
Secondary · ages 11–16 · Free school
A−
52.9 Attainment 8 · 60% grade 5+ E&M
760 pupilsOfsted: Inspected 2025
Lift Richmond Park
Secondary · ages 11–18 · Academy
A−
51.8 Attainment 8 · 58% grade 5+ E&M
1,046 pupilsOfsted: Good 2022
Twickenham School
Secondary · ages 11–16 · Academy
B−
48.9 Attainment 8 · 39% grade 5+ E&M
774 pupilsOfsted: report card 2025
Hampton High
Secondary · ages 11–18 · Academy
B−
46 Attainment 8 · 43% grade 5+ E&M
847 pupilsOfsted: Inspected 2024

Key result: Attainment 8 and grade 5+ English and maths (GCSEs, 2025/26 provisional) for secondaries; the share meeting the expected standard in reading, writing and maths (KS2, DfE’s three-year average) for primaries. Pupils: the January 2026 school census. No letter: an infant or first school (no KS2 tests), a new school, a small cohort DfE suppresses, or a special school, nursery or college. Independent schools aren’t included.

Ofsted

Ofsted report cards

Each school’s latest inspection; report cards replace one-word judgements as schools are re-inspected.

Outstanding 10Good 12Report card 6Ungraded inspection only 31No published grade 1

Ofsted stopped giving one-word judgements in 2024. Until a school is re-inspected, its last overall judgement is its most recent single grade; a school judged years ago may have changed a lot since.

Since November 2025 Ofsted gives each area of a school one of five grades (exceptional, strong standard, expected standard, needs attention, urgent improvement) and says whether safeguarding is met, instead of one overall word. 6 of Richmond upon Thames’s 60 state schools have a report card so far; the others show their last inspection under the old framework. Ofsted is never part of the School Grade.

SchoolSafeguardingAchievementCurriculum and teachingInclusionAttendance and behaviourPersonal development and well-beingLeadership and governanceEarly yearsSixth form
Kew Riverside Primary SchoolJuly 2026MetExpected standardExpected standardStrong standardNeeds attentionStrong standardExpected standardStrong standard—
Sheen Mount Primary SchoolJuly 2026MetStrong standardStrong standardStrong standardStrong standardStrong standardStrong standardStrong standard—
Meadlands Primary SchoolApril 2026MetStrong standardExpected standardExpected standardExpected standardStrong standardExpected standardExpected standard—
Teddington SchoolApril 2026MetStrong standardStrong standardStrong standardExpected standardStrong standardStrong standard—Strong standard
Christ's Church of England Comprehensive Secondary SchoolFebruary 2026MetStrong standardStrong standardStrong standardExpected standardStrong standardStrong standard—Strong standard
Twickenham SchoolDecember 2025MetExpected standardExpected standardStrong standardExpected standardExpected standardStrong standard——
Who runs them

15 academy trusts and the council

Academies are state schools run by a trust rather than the council: the trust employs the staff and can set its own curriculum and term dates. Admissions still go through the council.

Run bySchoolsPupilsTheir letters
Bourne Education TrustTeddington, Hampton High, Twickenham33,026AB−B−
Helix Learning TrustClarendon, Strathmore, Capella House3350—
Ascension Catholic Academy TrustSt Richard Reynolds, St Richard Reynolds21,385A+A+
Christ the Redeemer Catholic Education TrustSt Elizabeth's, St Osmund's2379AA
Every Child, Every Day Academy TrustGrey Court11,650A
Waldegrave TrustWaldegrave11,470A
Orleans Park SchoolOrleans Park11,403A+
Russell Education TrustTuring House11,047A
Lift SchoolsLift Richmond Park11,046A−
Richmond Upon Thames School TrustThe Richmond upon Thames1760A−
Bellevue Place Education TrustDeer Park1417A+
Omnia Learning TrustTwickenham1380B−
Wandle Learning TrustThomson House1366A+
Latchmere Academy TrustNelson1227C−
Instanter Learning TrustSt Mary's Hampton1161B+
Richmond upon Thames CouncilChrist's, Collis, St James's, Chase Bridge, St Mary's and St Peter's, St Mary's, Sheen Mount, East Sheen, The Vineyard, Hampton Junior, Barnes, St Edmund's, Archdeacon Cambridge's, Orleans, St Stephen's C E, The King's, Marshgate, Stanley, Buckingham, Hampton Infant, Heathfield Junior, Holy Trinity, Hampton Hill Junior, Heathfield Infant, Trafalgar Junior, Lowther, Meadlands, Carlisle Infant, St John the Baptist, The Russell, Bishop Perrin, Darell, Hampton Wick Infant, Sacred Heart, St Richard's, St Mary Magdalen's, Trafalgar Infant, Kew Riverside, Windham Nursery3914,585AA+A+AA+AAAAAA+AAA−AA+A+BCBA−A−A−AA+BAA−C−BB−AA−
After 16

Where Richmond upon Thames’s teenagers go at 16

In England young people stay in education or training until 18: a sixth form, a college, or an apprenticeship.

9 of Richmond upon Thames’s 11 state secondaries have sixth forms: Christ's, Grey Court, Hampton High, Lift Richmond Park, Orleans Park, St Richard Reynolds, Teddington, Turing House and Waldegrave. Richmond and Hillcroft Adult and Community College (Rhacc), a further-education college, is in the London borough.

Secondaries with a sixth form
9 of 11
state schools in Richmond upon Thames
Colleges within 12 miles
4
nearest: Richmond and Hillcroft Adult and Community College (Rhacc)
Grammar schools in Richmond upon Thames
0
no selective state secondaries
CollegeDistance
Richmond and Hillcroft Adult and Community College (Rhacc)Further-education college · TW9 2REin Richmond upon Thames
West Thames CollegeFurther-education college · TW7 4HS2 mi
South Thames Colleges GroupFurther-education college · KT1 2AQ3 mi
Ealing, Hammersmith and West London CollegeFurther-education college · W14 9BL5.5 mi
Special needs

Special schools and alternative provision in Richmond upon Thames

Richmond upon Thames has 3 special schools (Capella House, Clarendon and Strathmore: 350 pupils). A special-school place isn’t applied for like a mainstream one: for a child with an education, health and care plan (EHCP), Richmond upon Thames Council names the school in the plan, after asking the family’s preference. These schools have no letter, because their results don’t compare with mainstream schools’. Their cards ↑

Richmond upon Thames Council’s SEND Local Offer lists support beyond these schools.

Towns its size

1st of 39 English towns and cities of 135,000 to 260,000

Ranked by School Grade, best first: the towns and cities either side of Richmond upon Thames, and the top and bottom of the group.

#TownSchoolsKS2Attainment 8Grade 5+ E&M
1Richmond upon Thames LondonA+77%57.767%
2Hammersmith and Fulham LondonA+76%56.765%
3Sutton LondonA+73%59.267%
4Kensington and Chelsea LondonA+75%53.861%
5Kingston upon Thames LondonA+69%61.571%
…
39Portsmouth HampshireD54%40.835%
Neighbours

Richmond upon Thames and the places around it

Coloured by School Grade.

Hounslow: AKingston upon Thames: A+West Molesey: A+Sunbury-on-Thames: A−Ealing: AHammersmith and Fulham: A+Ashford Common: A−HounslowKingston upon ThamesWest MoleseySunbury-on-ThamesEalingHammersmith and FulhamAshford CommonRichmond upon Thames
TownSchoolsKS2Att. 8
Richmond upon Thames
60 schools
A+77%57.7
Hounslow
75 schools · 2.2 mi
A69%51.6
Kingston upon Thames
50 schools · 4 mi
A+69%61.5
West Molesey
13 schools · uses schools within 3 km · 4.3 mi
A+77%53.7
Sunbury-on-Thames
9 schools · 4.6 mi
A−63%56.2
Ealing
94 schools · 4.9 mi
A70%53.1
Hammersmith and Fulham
58 schools · 5.3 mi
A+76%56.7
Ashford Common
1 school · uses schools within 3 km · 5.5 mi
A−65%50.7

Richmond upon Thames’s schools are graded at least as well as any neighbour’s. Small places often use the schools within 3 km, so neighbours can share schools.

How to read these numbers

What this data can and can’t tell you

  • Expected standard at Key Stage 2. The share of 11-year-olds who reach the expected standard in reading, writing and maths together, in tests and teacher assessment at the end of primary school. We use DfE’s three-year average (2023–2025) to steady small schools.
  • Higher standard. The share working at greater depth in all three. In Richmond upon Thames: 21% (England’s average school: 8%).
  • Attainment 8. A pupil’s GCSE grades across eight subjects, with English and maths counted twice, added up. 50 is roughly a grade 5 in every subject.
  • Grade 5+ in English and maths. A strong pass in both. Grade 4 is a standard pass.
  • Provisional. 2025/26 GCSE figures are DfE’s first release; revised figures follow in February, usually within a point.
  • Progress 8. Not shown: there is none for 2025/26, because these pupils sat no KS2 tests in 2020 (Covid).
  • Free school meals. Pupils eligible for free school meals now, from the January census: the usual measure of how many pupils come from low-income homes.
  • Independent schools. Not included: they publish no results comparable with state schools’.

Questions about schools in Richmond upon Thames

Are schools in Richmond upon Thames good?

Richmond upon Thames’s state schools earn an A+ against schools across England: primary results beat 97% of towns in England; secondary results beat 97% of towns in England, on Department for Education Key Stage 2 and GCSE results. School places are handled by Richmond upon Thames council.

What is the best secondary school in Richmond upon Thames?

On 2025/26 GCSE results, Orleans Park School: Attainment 8 of 66.4 and 79% with grade 5+ in English and maths, against 47.3 at the average school in England. Results are one measure; distance decides most places.

What is the best primary school in Richmond upon Thames?

On Key Stage 2 results over 2023–25, Barnes Primary School: 94% of pupils meet the expected standard in reading, writing and maths, against 62% at the average school in England.

Do Richmond upon Thames secondary schools have sixth forms?

9 of 11 do.

How do I apply for a school place in Richmond upon Thames?

Through Richmond upon Thames Council, for every state school including academies. Secondary applications close on 31 October (offers 1 March); primary on 15 January (offers 16 April).

How many schools in Richmond upon Thames are full?

8 of 55 mainstream schools have at least as many pupils as places, on DfE’s January 2026 census. A full school still admits by its rules, usually distance after siblings.

How many state schools are in Richmond upon Thames?

60 open state-funded schools are located in Richmond upon Thames’s built-up area: 45 primary, 11 secondary and 4 other (special schools, alternative provision, nurseries and 16–19). Independent schools aren’t included.

Sources: DfE Get Information about Schools (16 October 2026), Key Stage 2 performance tables (2023–2025, three-year average) and Key Stage 4 (2025/26, provisional); Ofsted state-funded school inspections as at 30 September 2026 · DfE Get Information about Schools (16 October 2026), further-education and sixth-form colleges · TownRatings grades: our own summary of the data, ranked against UK towns only. All under the Open Government Licence v3.0.
Contains public sector information licensed under the Open Government Licence v3.0. Contains HM Land Registry data © Crown copyright and database right 2026. Contains OS data © Crown copyright and database right 2026 (ONS boundaries). Northern Ireland: Source: NISRA; contains Land & Property Services data and Ordnance Survey of Northern Ireland information, © Crown copyright, licensed under the Open Government Licence v3.0. Scotland: contains National Records of Scotland data, Registers of Scotland data and SEPA data, © Crown copyright / © SEPA 2025, licensed under the Open Government Licence v3.0.