Guest, Sign inJoin
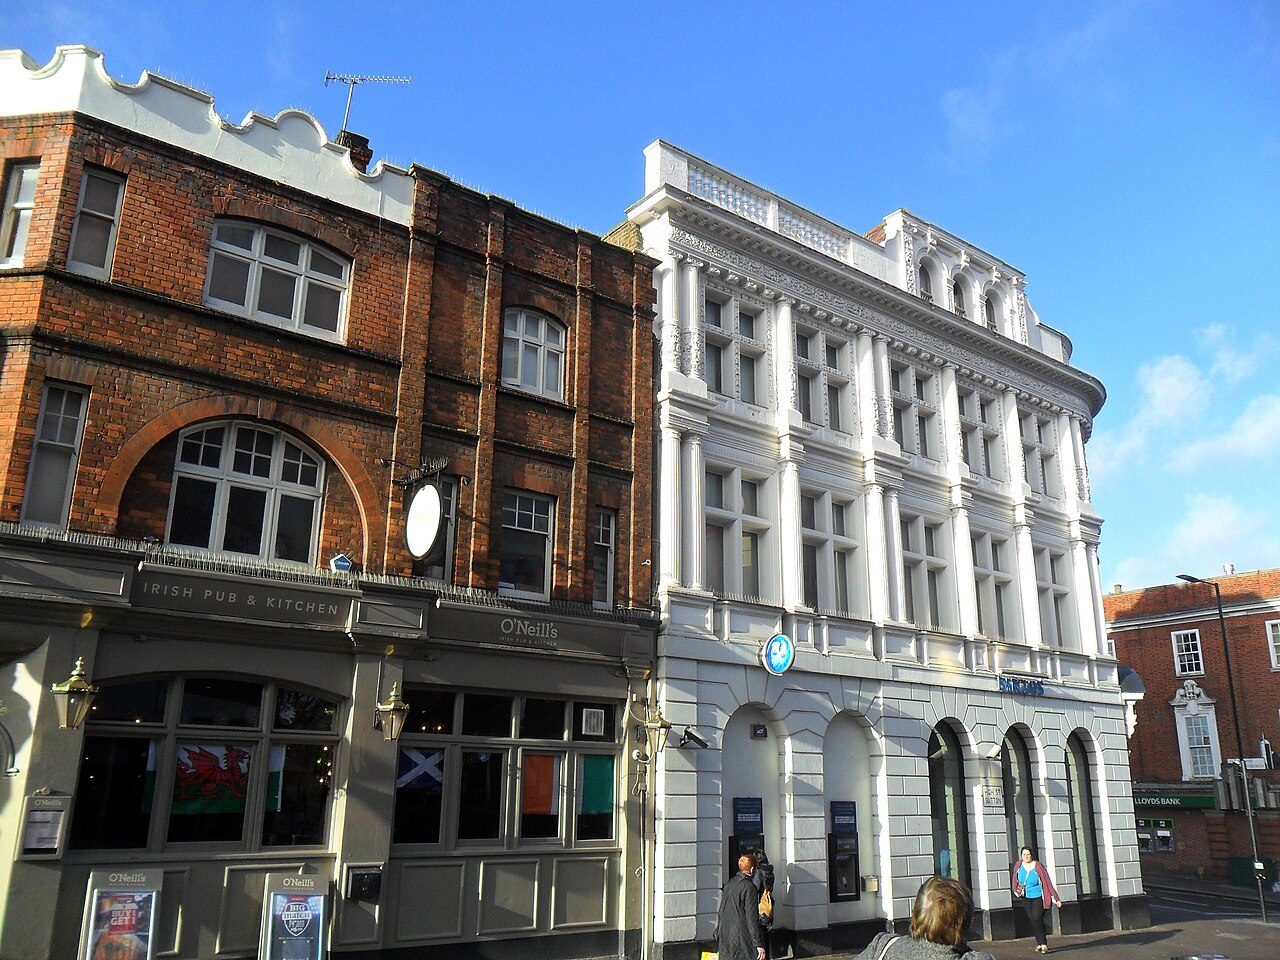
Sutton, Surrey London Sutton High Street -Photo: A P Monblat · CC BY-SA 3.0
A+School Grade
Schools in Sutton · DfE, Ofsted

Sutton’s state schools are in the top tenth: better results than 97% of towns in England

Across their best eight GCSEs, pupils in Sutton score 59.2 on Attainment 8, above both London’s towns (51.7) and towns in England (45.9). 63 state-funded schools are located in Sutton’s built-up area. Sutton grades A+ for schools, on Department for Education Key Stage 2 and GCSE results: #3 of 33 in London. Ofsted is shown, not graded.

State schools
63
42 primary, 14 secondary
Reading, writing & maths
73%
meet the expected standard at 11 · 2023–25
England’s schools: 62%
Attainment 8
59.2
GCSE average across 8 subjects · 2025/26
England’s schools: 47.3
Grade 5+ English & maths
67%
a strong pass in both · 2025/26
England’s schools: 47%

Town figures are pupil-weighted across the schools the grade uses; England’s are the average school.

What stands out · In brief

What stands out about Sutton’s schools

Strong at both ages

Sutton’s secondary results beat 97% of English towns; its primary results beat 94%. 73% of the London borough’s 11-year-olds meet the expected standard in reading, writing and maths, against 62% at the average school in England and 71% across Sutton. The spread between primaries is wide: 89% at Cuddington Croft Primary School and Nursery, 35% at Wallington Primary Academy. Every school’s result ↓

Popular schools are full

25 of 56 mainstream schools have at least as many pupils as their official capacity, including Carshalton Boys Sports College, Carshalton High School for Girls, Cheam High, Glenthorne High, Greenshaw High, Oaks Park High, Sutton Grammar, Wallington County Grammar, Wallington High School for Girls and Wilson's among the secondaries. A full school gives places by its admissions rules, usually by distance after siblings. Getting a place ↓

Grammar schools in town

Sutton Grammar School, Wallington County Grammar School, Wallington High School for Girls and Wilson's School admit pupils by a test at 11. Their results count in Sutton’s School Grade, as they are state schools many local children attend. After 16 ↓

St Elphege's beats its intake

Schools with more pupils on free school meals usually get lower results. At St Elphege's RC Junior School, 22% of pupils are on free school meals and 87% meet the expected standard; a typical school in England with that intake reaches 63%. Results and intake ↓

Written from the Department for Education and Ofsted data on this page.

School Grade

Sutton grades A+ for schools

Against every town in England with results; Wales publishes none.

Primary: reading, writing and maths at 11 (73% meet the standard)Better than 94% of towns in England
Secondary: Attainment 8 and grade 5+ English and maths (59.2 and 67%)Better than 97% of towns in England
Each of Sutton’s 35 primaries: % meeting the expected standard in reading, writing and maths (2023–25)30%40%50%60%70%80%90%England 62%Sutton 71%Wallington Primary Academy: 35% · D−Tweeddale Primary School: 46% · DGreen Wrythe Primary School: 52% · C−Foresters Primary School: 53% · C−Rushy Meadow Primary Academy: 54% · CDevonshire Primary School: 60% · C+Green Lane Primary and Nursery School: 63% · B−Bandon Hill Primary School: 64% · B−Culvers House Primary School: 64% · B−High View Primary School: 64% · B−Wood Field Primary School: 66% · BAvenue Primary Academy: 68% · B+Dorchester Primary School: 68% · B+Hackbridge Primary School: 68% · B+Abbey Primary School: 69% · B+Holy Trinity CofE Junior School: 70% · B+All Saints Benhilton CofE Primary School: 71% · A−Harris Junior Academy Carshalton: 71% · A−St Dunstan's Cheam CofE Primary School: 73% · A−All Saints Carshalton Church of England Primary School: 75% · A−Stanley Park Junior School: 75% · A−Muschamp Primary School and Language Opportunity Base: 76% · ASt Mary's RC Junior School: 76% · ABarrow Hedges Primary School: 78% · ABrookfield Primary Academy: 81% · ACheam Park Farm Primary Academy: 81% · ARobin Hood Junior School: 81% · ASt Cecilia's Catholic Primary School: 81% · ABeddington Park Academy: 82% · AManor Park Primary Academy: 85% · A+Cheam Common Junior Academy: 86% · A+Cheam Fields Primary Academy: 86% · A+St Elphege's RC Junior School: 87% · A+Westbourne Primary School: 87% · A+Cuddington Croft Primary School and Nursery: 89% · A+
Each of Sutton’s 14 secondaries: Attainment 8 (2025/26)354045505560657075808590England 47Sutton 62Oaks Park High School: 39 · DCarshalton Boys Sports College: 46 · BOverton Grange School: 47 · B−The John Fisher School: 51 · A−Carshalton High School for Girls: 52 · A−Cheam High School: 53 · A−St Philomena's Catholic High School for Girls: 54 · A−Greenshaw High School: 57 · AHarris Academy Sutton: 59 · AGlenthorne High School: 64 · AWallington High School for Girls: 80 · A+Wallington County Grammar School: 82 · A+Sutton Grammar School: 83 · A+Wilson's School: 87 · A+
England’s average schoolSutton’s average school

The primary figure: 35 primaries in the town, 8,188 pupils in results over three years. The secondary figure: 14 secondaries in the town, 3,145 pupils in results. Mainstream state schools only (grammar schools included); special schools, alternative provision, nurseries and 16–19 colleges are listed below but not graded. Each school’s results are compared with every school in England, then weighted by its pupils.

Map

Where Sutton’s 63 state schools are

Each school at its address, coloured by its own letter and sized by pupils. Open a school for its own page. The dashed shape is Sutton’s built-up area.

Sutton Tuition and Reintegration Service · no letter · 1 pupilsThe Limes College · no letter · 61 pupilsSpencer Nursery School · no letter · 65 pupilsWandle Valley Academy · no letter · 89 pupilsThomas Wall Nursery School · no letter · 98 pupilsThe Link School · no letter · 167 pupilsCarew Academy · no letter · 272 pupilsForesters Primary School · C−Wallington Primary Academy · D− · 155 pupilsRobin Hood Infants' School · no letter · 239 pupilsGreen Wrythe Primary School · C− · 268 pupilsBeddington Infants' School · no letter · 277 pupilsSt Mary's RC Infants School · no letter · 284 pupilsStanley Park Infants School · no letter · 286 pupilsSt Elphege's RC Infants' School · no letter · 322 pupilsHoly Trinity CofE Junior School · B+ · 324 pupilsVictor Seymour Infants' School · no letter · 326 pupilsSt Dunstan's Cheam CofE Primary School · A− · 349 pupilsBeddington Park Academy · A · 350 pupilsHarris Junior Academy Carshalton · A− · 358 pupilsRobin Hood Junior School · A · 359 pupilsSt Mary's RC Junior School · A · 361 pupilsStanley Park Junior School · A− · 368 pupilsTweeddale Primary School · D · 376 pupilsSt Elphege's RC Junior School · A+ · 382 pupilsRushy Meadow Primary Academy · C · 388 pupilsCulvers House Primary School · B− · 407 pupilsGreen Lane Primary and Nursery School · B− · 407 pupilsCheam Common Infants' Academy · no letter · 410 pupilsAll Saints Carshalton Church of England Primary School · A− · 432 pupilsHigh View Primary School · B− · 438 pupilsBandon Hill Primary School · B− · 439 pupilsBrookfield Primary Academy · A · 450 pupilsAll Saints Benhilton CofE Primary School · A− · 462 pupilsSt Cecilia's Catholic Primary School · A · 465 pupilsAbbey Primary School · B+ · 468 pupilsCheam Fields Primary Academy · A+ · 471 pupilsCuddington Croft Primary School and Nursery · A+ · 472 pupilsDorchester Primary School · B+ · 472 pupilsCheam Common Junior Academy · A+ · 512 pupilsMuschamp Primary School and Language Opportunity Base · A · 574 pupilsWood Field Primary School · B · 604 pupilsWestbourne Primary School · A+ · 656 pupilsDevonshire Primary School · C+ · 678 pupilsBarrow Hedges Primary School · A · 692 pupilsManor Park Primary Academy · A+ · 710 pupilsHackbridge Primary School · B+ · 809 pupilsCheam Park Farm Primary Academy · A · 916 pupilsAvenue Primary Academy · B+ · 1,057 pupilsSutton Grammar School · A+ · 1,061 pupilsOverton Grange School · B− · 1,092 pupilsThe John Fisher School · A− · 1,116 pupilsWallington County Grammar School · A+ · 1,119 pupilsHarris Academy Sutton · A · 1,294 pupilsWilson's School · A+ · 1,327 pupilsCarshalton High School for Girls · A− · 1,394 pupilsOaks Park High School · D · 1,407 pupilsSt Philomena's Catholic High School for Girls · A− · 1,425 pupilsCarshalton Boys Sports College · B · 1,539 pupilsWallington High School for Girls · A+ · 1,548 pupilsGlenthorne High School · A · 1,754 pupilsGreenshaw High School · A · 1,977 pupilsCheam High School · A− · 2,119 pupils© OpenStreetMap contributors
PrimarySecondarySpecial, nursery, 16–19Size: pupilsABCDNo letter

Most schools give places by distance once siblings are in, so the schools nearest a home matter more than any league table.

Results and intake

Which schools do better than their intake suggests

Schools with more pupils on free school meals tend to get lower results. The dashed line is the typical school in England for each level of free school meals; the band holds the middle two-thirds. A dot above the band is doing better than schools like it.

Primaries: KS2 reading, writing and maths against free school meals30%40%50%60%70%80%90%100%0%10%20%30%40%50%60%Pupils on free school meals →typical school in EnglandAbbey Primary School: 69% with 22% on free school meals (a typical school with that intake: 63%)All Saints Benhilton CofE Primary School: 71% with 12% on free school meals (a typical school with that intake: 65%)All Saints Carshalton Church of England Primary School: 75% with 6% on free school meals (a typical school with that intake: 67%)Avenue Primary Academy: 68% with 13% on free school meals (a typical school with that intake: 65%)Bandon Hill Primary School: 64% with 19% on free school meals (a typical school with that intake: 63%)Barrow Hedges Primary School: 78% with 7% on free school meals (a typical school with that intake: 67%)Beddington Park Academy: 82% with 31% on free school meals (a typical school with that intake: 60%)Brookfield Primary Academy: 81% with 14% on free school meals (a typical school with that intake: 65%)Cheam Common Junior Academy: 86% with 8% on free school meals (a typical school with that intake: 66%)Cheam Fields Primary Academy: 86% with 6% on free school meals (a typical school with that intake: 67%)Cheam Park Farm Primary Academy: 81% with 6% on free school meals (a typical school with that intake: 67%)Cuddington Croft Primary School and Nursery: 89% with 2% on free school meals (a typical school with that intake: 68%)Culvers House Primary School: 64% with 28% on free school meals (a typical school with that intake: 61%)Devonshire Primary School: 60% with 27% on free school meals (a typical school with that intake: 61%)Dorchester Primary School: 68% with 18% on free school meals (a typical school with that intake: 64%)Green Lane Primary and Nursery School: 63% with 12% on free school meals (a typical school with that intake: 65%)Green Wrythe Primary School: 52% with 40% on free school meals (a typical school with that intake: 57%)Hackbridge Primary School: 68% with 22% on free school meals (a typical school with that intake: 63%)Harris Junior Academy Carshalton: 71% with 20% on free school meals (a typical school with that intake: 63%)High View Primary School: 64% with 12% on free school meals (a typical school with that intake: 65%)Holy Trinity CofE Junior School: 70% with 23% on free school meals (a typical school with that intake: 62%)Manor Park Primary Academy: 85% with 17% on free school meals (a typical school with that intake: 64%)Muschamp Primary School and Language Opportunity Base: 76% with 32% on free school meals (a typical school with that intake: 60%)Robin Hood Junior School: 81% with 20% on free school meals (a typical school with that intake: 63%)Rushy Meadow Primary Academy: 54% with 33% on free school meals (a typical school with that intake: 60%)St Cecilia's Catholic Primary School: 81% with 4% on free school meals (a typical school with that intake: 67%)St Dunstan's Cheam CofE Primary School: 73% with 11% on free school meals (a typical school with that intake: 66%)St Elphege's RC Junior School: 87% with 22% on free school meals (a typical school with that intake: 63%)St Mary's RC Junior School: 76% with 6% on free school meals (a typical school with that intake: 67%)Stanley Park Junior School: 75% with 10% on free school meals (a typical school with that intake: 66%)Tweeddale Primary School: 46% with 44% on free school meals (a typical school with that intake: 56%)Wallington Primary Academy: 35% with 55% on free school meals (a typical school with that intake: 53%)Westbourne Primary School: 87% with 13% on free school meals (a typical school with that intake: 65%)Wood Field Primary School: 66% with 24% on free school meals (a typical school with that intake: 62%)St Elphege'sWestbourneBeddington ParkManor Park
Secondaries: Attainment 8 against free school meals3540455055606570758085900%10%20%30%40%Pupils on free school meals →typical school in EnglandCarshalton Boys Sports College: 46 with 31% on free school meals (a typical school with that intake: 47)Carshalton High School for Girls: 52 with 27% on free school meals (a typical school with that intake: 48)Cheam High School: 53 with 17% on free school meals (a typical school with that intake: 52)Glenthorne High School: 64 with 14% on free school meals (a typical school with that intake: 53)Greenshaw High School: 57 with 29% on free school meals (a typical school with that intake: 48)Harris Academy Sutton: 59 with 12% on free school meals (a typical school with that intake: 54)Oaks Park High School: 39 with 28% on free school meals (a typical school with that intake: 48)Overton Grange School: 47 with 31% on free school meals (a typical school with that intake: 47)St Philomena's Catholic High School for Girls: 54 with 17% on free school meals (a typical school with that intake: 52)Sutton Grammar School: 83 with 1% on free school meals (a typical school with that intake: 57)The John Fisher School: 51 with 16% on free school meals (a typical school with that intake: 52)Wallington County Grammar School: 82 with 7% on free school meals (a typical school with that intake: 55)Wallington High School for Girls: 80 with 13% on free school meals (a typical school with that intake: 53)Wilson's School: 87 with 6% on free school meals (a typical school with that intake: 56)Wilson'sWallington High School for GirlsWallington County GrammarSutton Grammar

The share of pupils on free school meals runs from 1% at Sutton Grammar School to 55% at Wallington Primary Academy. Against schools with the same intake, Wilson's School does best: 87 with 6% on free school meals, where a typical school would reach 56. 27 of 34 primaries and 11 of 14 secondaries are above the line.

Show as a table
SchoolFree school mealsResultTypical for that intakeDifference
Wilson's SchoolAttainment 86%8756+31
Wallington High School for GirlsAttainment 813%8053+27
Wallington County Grammar SchoolAttainment 87%8255+27
Sutton Grammar SchoolAttainment 81%8357+25
St Elphege's RC Junior SchoolKS2 %22%87%63%+24
Westbourne Primary SchoolKS2 %13%87%65%+22
Beddington Park AcademyKS2 %31%82%60%+22
Manor Park Primary AcademyKS2 %17%85%64%+21
Cuddington Croft Primary School and NurseryKS2 %2%89%68%+21
Cheam Common Junior AcademyKS2 %8%86%66%+20
Cheam Fields Primary AcademyKS2 %6%86%67%+19
Robin Hood Junior SchoolKS2 %20%81%63%+18
Muschamp Primary School and Language Opportunity BaseKS2 %32%76%60%+16
Brookfield Primary AcademyKS2 %14%81%65%+16
Cheam Park Farm Primary AcademyKS2 %6%81%67%+14
St Cecilia's Catholic Primary SchoolKS2 %4%81%67%+14
Barrow Hedges Primary SchoolKS2 %7%78%67%+11
Glenthorne High SchoolAttainment 814%6453+11
St Mary's RC Junior SchoolKS2 %6%76%67%+9
Stanley Park Junior SchoolKS2 %10%75%66%+9
Greenshaw High SchoolAttainment 829%5748+9
All Saints Carshalton Church of England Primary SchoolKS2 %6%75%67%+8
Harris Junior Academy CarshaltonKS2 %20%71%63%+8
Holy Trinity CofE Junior SchoolKS2 %23%70%62%+8
St Dunstan's Cheam CofE Primary SchoolKS2 %11%73%66%+7
Abbey Primary SchoolKS2 %22%69%63%+6
All Saints Benhilton CofE Primary SchoolKS2 %12%71%65%+6
Hackbridge Primary SchoolKS2 %22%68%63%+5
Harris Academy SuttonAttainment 812%5954+5
Dorchester Primary SchoolKS2 %18%68%64%+4
Wood Field Primary SchoolKS2 %24%66%62%+4
Carshalton High School for GirlsAttainment 827%5248+3
Culvers House Primary SchoolKS2 %28%64%61%+3
Avenue Primary AcademyKS2 %13%68%65%+3
St Philomena's Catholic High School for GirlsAttainment 817%5452+2
Cheam High SchoolAttainment 817%5352+1
Bandon Hill Primary SchoolKS2 %19%64%63%+1
Overton Grange SchoolAttainment 831%4747+0
Carshalton Boys Sports CollegeAttainment 831%4647−1
Devonshire Primary SchoolKS2 %27%60%61%−1
High View Primary SchoolKS2 %12%64%65%−1
The John Fisher SchoolAttainment 816%5152−1
Green Lane Primary and Nursery SchoolKS2 %12%63%65%−2
Green Wrythe Primary SchoolKS2 %40%52%57%−5
Rushy Meadow Primary AcademyKS2 %33%54%60%−6
Oaks Park High SchoolAttainment 828%3948−9
Tweeddale Primary SchoolKS2 %44%46%56%−10
Wallington Primary AcademyKS2 %55%35%53%−18

Free school meals: pupils eligible now, DfE January 2026 census. The typical-school line is a straight-line fit across every graded school in England. It describes; it doesn’t grade: the School Grade uses results alone.

Getting a place

How school places work in Sutton

Sutton Council handles applications for every state school in Sutton, academies included. You apply to the council where you live, even for a school in another area.

Secondary (starting at 11)Apply by 31 October of Year 6. Offers on 1 March.
Primary (starting in Reception)Apply by 15 January before the September your child starts. Offers on 16 April.
Moving mid-yearApply to the council for an in-year place; it tells you which schools have room.

When a school is full

Every school publishes its admissions rules. Children in care come first, then, at most schools, brothers and sisters of current pupils, then those who live nearest. 12 of Sutton’s 56 mainstream schools have a religious character; some of them give priority by church attendance, so check each school’s rules. Infant classes are limited to 30 by law. If you’re refused a place, you can appeal to an independent panel.

Useful: Apply for a primary place (GOV.UK) · Apply for a secondary place (GOV.UK) · How admissions criteria work

How full each school is

Pupils on roll as a share of the school’s official capacity. The black tick is 100%; 25 schools are at or over it.

Cheam Common Junior155%
Carshalton Boys Sports College129%
Sutton Grammar126%
Avenue incl. nursery121%
Carshalton High School for Girls116%
Cheam Fields incl. nursery115%
Glenthorne High113%
Cuddington Croft incl. nursery112%
St Cecilia's incl. nursery112%
Devonshire incl. nursery108%
Show all 55 schools
Brookfield incl. nursery107%
Cheam High107%
Wallington High School for Girls106%
Bandon Hill incl. nursery105%
Westbourne incl. nursery104%
Manor Park incl. nursery104%
Cheam Park Farm103%
Stanley Park Junior102%
Wallington County Grammar102%
Abbey incl. nursery101%
Barrow Hedges incl. nursery101%
Greenshaw High100%
St Mary's100%
Oaks Park High100%
Wilson's100%
Harris Academy Sutton100%
Robin Hood Junior100%
St Elphege's99%
Harris Junior Academy Carshalton99%
All Saints Benhilton incl. nursery99%
High View incl. nursery99%
All Saints Carshalton incl. nursery97%
Stanley Park Infants incl. nursery97%
Cheam Common Infants' incl. nursery96%
Green Wrythe incl. nursery95%
The John Fisher94%
Victor Seymour Infants' incl. nursery92%
St Philomena's92%
Culvers House incl. nursery91%
Muschamp School and Language Opportunity Base incl. nursery91%
Hackbridge incl. nursery91%
Holy Trinity90%
Green Lane incl. nursery90%
Beddington Infants' incl. nursery89%
Robin Hood Infants'89%
St Mary's incl. nursery88%
St Elphege's incl. nursery84%
Beddington Park83%
St Dunstan's Cheam incl. nursery83%
Rushy Meadow incl. nursery82%
Overton Grange82%
Tweeddale incl. nursery80%
Wood Field72%
Dorchester incl. nursery69%
Wallington incl. nursery35%

DfE register of schools (GIAS), January 2026 census. Capacity often excludes a nursery class, so a school with a nursery can show over 100%.

The schools

63 state schools in Sutton

Each school’s own letter compares its results with every state school in England of the same phase: Key Stage 2 for primaries, GCSEs for secondaries. Open a school for its results, how its letter is worked out, Ofsted and a map.

Letters of Sutton’s schoolsA 30B 12C 4D 314 without a letter
Primary schools42 · best KS2 results first
Westbourne Primary School
Primary · ages 3–11 · Academy
A+
87% met the KS2 standard (3 years)
656 pupilsOfsted: Good 2023
Cuddington Croft Primary School and Nursery
Primary · ages 3–11 · Academy
A+
89% met the KS2 standard (3 years)
472 pupilsOfsted: Good 2022
St Elphege's RC Junior School
Primary · ages 7–11 · Academy · Roman Catholic
A+
87% met the KS2 standard (3 years)
382 pupilsOfsted: Outstanding 2021
Cheam Common Junior Academy
Primary · ages 7–11 · Academy
A+
86% met the KS2 standard (3 years)
512 pupilsOfsted: Good 2024
Cheam Fields Primary Academy
Primary · ages 3–11 · Academy
A+
86% met the KS2 standard (3 years)
471 pupilsOfsted: Inspected 2024
Manor Park Primary Academy
Primary · ages 2–11 · Academy
A+
85% met the KS2 standard (3 years)
710 pupilsOfsted: Inspected 2025
Beddington Park Academy
Primary · ages 4–11 · Academy
A
82% met the KS2 standard (3 years)
350 pupilsOfsted: Outstanding 2023
Cheam Park Farm Primary Academy
Primary · ages 4–11 · Academy
A
81% met the KS2 standard (3 years)
916 pupilsOfsted: Inspected 2025
St Cecilia's Catholic Primary School
Primary · ages 3–11 · Academy · Roman Catholic
A
81% met the KS2 standard (3 years)
465 pupilsOfsted: Outstanding 2023
Brookfield Primary Academy
Primary · ages 2–11 · Academy
A
81% met the KS2 standard (3 years)
450 pupilsOfsted: Inspected 2024
Robin Hood Junior School
Primary · ages 7–11 · Community
A
81% met the KS2 standard (3 years)
359 pupilsOfsted: Good 2022
Barrow Hedges Primary School
Primary · ages 3–11 · Academy
A
78% met the KS2 standard (3 years)
692 pupilsOfsted: Outstanding 2023
Muschamp Primary School and Language Opportunity Base
Primary · ages 3–11 · Foundation
A
76% met the KS2 standard (3 years)
574 pupilsOfsted: report card 2026
St Mary's RC Junior School
Primary · ages 7–11 · Voluntary aided · Roman Catholic
A
76% met the KS2 standard (3 years)
361 pupilsOfsted: Inspected 2025
All Saints Carshalton Church of England Primary School
Primary · ages 3–11 · Academy · Church of England
A−
75% met the KS2 standard (3 years)
432 pupilsOfsted: Inspected 2024
Stanley Park Junior School
Primary · ages 7–11 · Foundation
A−
75% met the KS2 standard (3 years)
368 pupilsOfsted: Good 2023
St Dunstan's Cheam CofE Primary School
Primary · ages 3–11 · Voluntary aided · Church of England
A−
73% met the KS2 standard (3 years)
349 pupilsOfsted: Good 2023
All Saints Benhilton CofE Primary School
Primary · ages 3–11 · Voluntary aided · Church of England
A−
71% met the KS2 standard (3 years)
462 pupilsOfsted: Inspected 2025
Harris Junior Academy Carshalton
Primary · ages 7–11 · Academy
A−
71% met the KS2 standard (3 years)
358 pupilsOfsted: Inspected 2024
Holy Trinity CofE Junior School
Primary · ages 7–11 · Voluntary aided · Church of England
B+
70% met the KS2 standard (3 years)
324 pupilsOfsted: Good 2023
Abbey Primary School
Primary · ages 2–11 · Academy
B+
69% met the KS2 standard (3 years)
468 pupilsOfsted: Good 2023
Avenue Primary Academy
Primary · ages 3–11 · Academy
B+
68% met the KS2 standard (3 years)
1,057 pupilsOfsted: Outstanding 2024
Hackbridge Primary School
Primary · ages 3–11 · Community
B+
68% met the KS2 standard (3 years)
809 pupilsOfsted: Good 2024
Dorchester Primary School
Primary · ages 3–11 · Foundation
B+
68% met the KS2 standard (3 years)
472 pupilsOfsted: Good 2023
Show all 42 primary schools
Wood Field Primary School
Primary · ages 4–11 · Academy
B
66% met the KS2 standard (3 years)
604 pupilsOfsted: Inspected 2025
Bandon Hill Primary School
Primary · ages 3–11 · Academy
B−
64% met the KS2 standard (3 years)
439 pupilsOfsted: Good 2024
High View Primary School
Primary · ages 3–11 · Foundation
B−
64% met the KS2 standard (3 years)
438 pupilsOfsted: report card 2026
Culvers House Primary School
Primary · ages 3–11 · Foundation
B−
64% met the KS2 standard (3 years)
407 pupilsOfsted: Good 2023
Green Lane Primary and Nursery School
Primary · ages 3–11 · Academy
B−
63% met the KS2 standard (3 years)
407 pupilsOfsted: Good 2023
Devonshire Primary School
Primary · ages 3–11 · Community
C+
60% met the KS2 standard (3 years)
678 pupilsOfsted: Inspected 2025
Rushy Meadow Primary Academy
Primary · ages 3–11 · Academy
C
54% met the KS2 standard (3 years)
388 pupilsOfsted: Inspected 2025
Foresters Primary School
Primary · ages 3–11 · Academy
C−
53% met the KS2 standard (3 years)
Ofsted: Good 2023
Green Wrythe Primary School
Primary · ages 3–11 · Academy
C−
52% met the KS2 standard (3 years)
268 pupilsOfsted: Good 2023
Tweeddale Primary School
Primary · ages 3–11 · Academy
D
46% met the KS2 standard (3 years)
376 pupilsOfsted: Good 2024
Wallington Primary Academy
Primary · ages 3–11 · Academy
D−
35% met the KS2 standard (3 years)
155 pupilsOfsted: report card 2026
Cheam Common Infants' Academy
Primary · ages 3–7 · Academy
No letter
410 pupilsOfsted: report card 2026
Victor Seymour Infants' School
Primary · ages 3–7 · Academy
No letter
326 pupilsOfsted: Inspected 2025
St Elphege's RC Infants' School
Primary · ages 3–7 · Academy · Roman Catholic
No letter
322 pupilsOfsted: Outstanding 2024
Stanley Park Infants School
Primary · ages 3–7 · Academy
No letter
286 pupilsOfsted: Good 2022
St Mary's RC Infants School
Primary · ages 3–7 · Voluntary aided · Roman Catholic
No letter
284 pupilsOfsted: Good 2023
Beddington Infants' School
Primary · ages 2–7 · Foundation
No letter
277 pupilsOfsted: Good 2023
Robin Hood Infants' School
Primary · ages 5–7 · Community
No letter
239 pupilsOfsted: report card 2026
Secondary schools14 · best GCSE results first
Wallington High School for Girls
Secondary · ages 11–18 · Academy · grammar, girls
A+
80.3 Attainment 8 · 100% grade 5+ E&M
1,548 pupilsOfsted: Inspected 2025
Wilson's School
Secondary · ages 11–18 · Academy · grammar, Church of England, boys
A+
86.8 Attainment 8 · 100% grade 5+ E&M
1,327 pupilsOfsted: Outstanding 2022
Wallington County Grammar School
Secondary · ages 11–18 · Academy · grammar, boys
A+
82 Attainment 8 · 99% grade 5+ E&M
1,119 pupilsOfsted: Outstanding 2022
Sutton Grammar School
Secondary · ages 11–18 · Academy · grammar, boys
A+
82.6 Attainment 8 · 100% grade 5+ E&M
1,061 pupilsOfsted: Good 2022
Glenthorne High School
Secondary · ages 11–18 · Academy
A
63.6 Attainment 8 · 80% grade 5+ E&M
1,754 pupilsOfsted: report card 2026
Harris Academy Sutton
Secondary · ages 11–19 · Free school
A
58.7 Attainment 8 · 69% grade 5+ E&M
1,294 pupilsOfsted: Outstanding 2023
Greenshaw High School
Secondary · ages 11–18 · Academy
A
56.5 Attainment 8 · 68% grade 5+ E&M
1,977 pupilsOfsted: Inspected 2024
Cheam High School
Secondary · ages 11–18 · Academy
A−
53.1 Attainment 8 · 61% grade 5+ E&M
2,119 pupilsOfsted: Inspected 2025
St Philomena's Catholic High School for Girls
Secondary · ages 11–18 · Voluntary aided · Roman Catholic, girls
A−
54.4 Attainment 8 · 58% grade 5+ E&M
1,425 pupilsOfsted: Good 2022
The John Fisher School
Secondary · ages 11–18 · Voluntary aided · Roman Catholic, boys
A−
50.8 Attainment 8 · 59% grade 5+ E&M
1,116 pupilsOfsted: Good 2023
Carshalton High School for Girls
Secondary · ages 11–18 · Academy · girls
A−
51.7 Attainment 8 · 56% grade 5+ E&M
1,394 pupilsOfsted: Good 2023
Carshalton Boys Sports College
Secondary · ages 11–19 · Academy · boys
B
46.1 Attainment 8 · 50% grade 5+ E&M
1,539 pupilsOfsted: Good 2022
Overton Grange School
Secondary · ages 11–18 · Academy
B−
47.3 Attainment 8 · 45% grade 5+ E&M
1,092 pupilsOfsted: Inspected 2024
Oaks Park High School
Secondary · ages 11–18 · Academy
D
39 Attainment 8 · 29% grade 5+ E&M
1,407 pupilsOfsted: Good 2023
Village schools near Sutton1 · outside any built-up area; Sutton is the nearest town

Key result: Attainment 8 and grade 5+ English and maths (GCSEs, 2025/26 provisional) for secondaries; the share meeting the expected standard in reading, writing and maths (KS2, DfE’s three-year average) for primaries. Pupils: the January 2026 school census. No letter: an infant or first school (no KS2 tests), a new school, a small cohort DfE suppresses, or a special school, nursery or college. Independent schools aren’t included.

Ofsted

Ofsted report cards

Each school’s latest inspection; report cards replace one-word judgements as schools are re-inspected.

Outstanding 9Good 16Report card 6Ungraded inspection only 32

Ofsted stopped giving one-word judgements in 2024. Until a school is re-inspected, its last overall judgement is its most recent single grade; a school judged years ago may have changed a lot since.

Since November 2025 Ofsted gives each area of a school one of five grades (exceptional, strong standard, expected standard, needs attention, urgent improvement) and says whether safeguarding is met, instead of one overall word. 6 of Sutton’s 63 state schools have a report card so far; the others show their last inspection under the old framework. Ofsted is never part of the School Grade.

SchoolSafeguardingAchievementCurriculum and teachingInclusionAttendance and behaviourPersonal development and well-beingLeadership and governanceEarly yearsSixth form
Cheam Common Infants' AcademyMay 2026MetStrong standardStrong standardStrong standardStrong standardExceptionalStrong standardStrong standard—
Robin Hood Infants' SchoolMay 2026MetExpected standardExpected standardExpected standardExpected standardExpected standardExpected standardExpected standard—
Wallington Primary AcademyApril 2026MetNeeds attentionExpected standardExpected standardNeeds attentionExpected standardExpected standardExpected standard—
High View Primary SchoolFebruary 2026MetExpected standardExpected standardStrong standardExpected standardStrong standardExpected standardStrong standard—
Muschamp Primary School and Language Opportunity BaseFebruary 2026MetExpected standardExpected standardExpected standardExpected standardExpected standardExpected standardExpected standard—
Glenthorne High SchoolJanuary 2026MetStrong standardStrong standardExceptionalStrong standardExceptionalStrong standard—Strong standard
Who runs them

20 academy trusts and the council

Academies are state schools run by a trust rather than the council: the trust employs the staff and can set its own curriculum and term dates. Admissions still go through the council.

Run bySchoolsPupilsTheir letters
Greenshaw Learning TrustGreenshaw High, Wallington County Grammar, Wood Field, Bandon Hill, Tweeddale, Victor Seymour Infants', Green Wrythe75,109AA+BB−DC−
Leo Academy TrustCheam Park Farm, Manor Park, Cheam Common Junior, Cheam Fields, Brookfield, Cheam Common Infants', Foresters73,469AA+A+A+AC−
Cirrus Primary Academy TrustAvenue, Barrow Hedges, Rushy Meadow, Stanley Park Infants, Wallington52,578B+ACD−
Sutton Education TrustMuschamp School and Language Opportunity Base, Dorchester, High View, Culvers House, Beddington Infants'52,168AB+B−B−
Sancta Familia Catholic Academy TrustSt Cecilia's, St Elphege's, St Elphege's31,169AA+
Cheam Academies NetworkCheam High, Oaks Park High23,526A−D
Girls' Learning TrustWallington High School for Girls, Carshalton High School for Girls22,942A+A−
Willow Learning TrustGlenthorne High, Abbey22,222AB+
Harris FederationHarris Academy Sutton, Harris Junior Academy Carshalton21,652AA−
Orchard Hill College Academy TrustCarew, The Link2439—
Alternative Learning TrustWandle Valley, The Limes College2150—
Carshalton Boys Sports CollegeCarshalton Boys Sports College11,539B
Wilson's SchoolWilson's11,327A+
Overton Grange SchoolOverton Grange11,092B−
Sutton Grammar School TrustSutton Grammar11,061A+
Westbourne Academy TrustWestbourne1656A+
Glf SchoolsCuddington Croft1472A+
Sdbe Multi-Academy TrustAll Saints Carshalton1432A−
Helix Learning TrustGreen Lane1407B−
Step Academy TrustBeddington Park1350A
Sutton CouncilSt Philomena's, The John Fisher, Hackbridge, Devonshire, All Saints Benhilton, Stanley Park Junior, St Mary's, Robin Hood Junior, St Dunstan's Cheam, Holy Trinity, St Mary's, Robin Hood Infants', Thomas Wall Nursery, Spencer Nursery, Sutton Tuition and Reintegration Service156,938A−A−B+C+A−A−AAA−B+
After 16

Where Sutton’s teenagers go at 16

In England young people stay in education or training until 18: a sixth form, a college, or an apprenticeship.

Every state secondary in Sutton has its own sixth form. The nearest college is North East Surrey College of Technology, a further-education college 3.1 miles away.

Secondaries with a sixth form
14 of 14
state schools in Sutton
Colleges within 12 miles
4
nearest: North East Surrey College of Technology
Grammar schools in Sutton
5
selective state secondaries
CollegeDistance
North East Surrey College of TechnologyFurther-education college · KT17 3DS3.1 mi
Croydon CollegeFurther-education college · CR9 1DX3.8 mi
South Thames Colleges GroupFurther-education college · KT1 2AQ5.9 mi
St Francis Xavier Sixth Form CollegeFurther-education college · SW12 8EN6.1 mi
Special needs

Special schools and alternative provision in Sutton

Sutton has 3 special schools (Carew, The Link and Wandle Valley: 528 pupils) and 2 alternative provision schools, for pupils who can’t attend mainstream school for a time. A special-school place isn’t applied for like a mainstream one: for a child with an education, health and care plan (EHCP), Sutton Council names the school in the plan, after asking the family’s preference. These schools have no letter, because their results don’t compare with mainstream schools’. Their cards ↑

Sutton Council’s SEND Local Offer lists support beyond these schools.

Towns its size

3rd of 43 English towns and cities of 146,000 to 282,000

Ranked by School Grade, best first: the towns and cities either side of Sutton, and the top and bottom of the group.

#TownSchoolsKS2Attainment 8Grade 5+ E&M
1Richmond upon Thames LondonA+77%57.767%
2Hammersmith and Fulham LondonA+76%56.765%
3Sutton LondonA+73%59.267%
4Kingston upon Thames LondonA+69%61.571%
5Hackney LondonA75%53.258%
6Westminster LondonA72%53.359%
7Slough BerkshireA69%55.262%
…
43Portsmouth HampshireD54%40.835%
Neighbours

Sutton and the places around it

Coloured by School Grade.

Worcester Park and Stoneleigh: AMerton: ABanstead: A−Ewell: B+Chipstead and Woodmansterne: ACroydon: B+Epsom: AWorcester Park and StoneleighMertonBansteadEwellChipstead and WoodmansterneCroydonEpsomSutton
TownSchoolsKS2Att. 8
Sutton
63 schools
A+73%59.2
Worcester Park and Stoneleigh
6 schools · uses schools within 3 km · 2.9 mi
A69%55
Merton
56 schools · 3 mi
A68%54
Banstead
4 schools · uses schools within 3 km · 3.1 mi
A−65%52.3
Ewell
8 schools · 3.5 mi
B+57%60
Chipstead and Woodmansterne
0 schools · uses schools within 3 km · 3.7 mi
A69%52.6
Croydon
126 schools · 4.1 mi
B+67%46.5
Epsom
10 schools · 4.3 mi
A70%56.5

Sutton’s schools are graded at least as well as any neighbour’s. Small places often use the schools within 3 km, so neighbours can share schools.

How to read these numbers

What this data can and can’t tell you

  • Expected standard at Key Stage 2. The share of 11-year-olds who reach the expected standard in reading, writing and maths together, in tests and teacher assessment at the end of primary school. We use DfE’s three-year average (2023–2025) to steady small schools.
  • Higher standard. The share working at greater depth in all three. In Sutton: 20% (England’s average school: 8%).
  • Attainment 8. A pupil’s GCSE grades across eight subjects, with English and maths counted twice, added up. 50 is roughly a grade 5 in every subject.
  • Grade 5+ in English and maths. A strong pass in both. Grade 4 is a standard pass.
  • Provisional. 2025/26 GCSE figures are DfE’s first release; revised figures follow in February, usually within a point.
  • Progress 8. Not shown: there is none for 2025/26, because these pupils sat no KS2 tests in 2020 (Covid).
  • Free school meals. Pupils eligible for free school meals now, from the January census: the usual measure of how many pupils come from low-income homes.
  • Independent schools. Not included: they publish no results comparable with state schools’.

Questions about schools in Sutton

Are schools in Sutton good?

Sutton’s state schools earn an A+ against schools across England: primary results beat 94% of towns in England; secondary results beat 97% of towns in England, on Department for Education Key Stage 2 and GCSE results. School places are handled by Sutton council.

What is the best secondary school in Sutton?

On 2025/26 GCSE results, Wilson's School: Attainment 8 of 86.8 and 100% with grade 5+ in English and maths, against 47.3 at the average school in England. Results are one measure; distance decides most places.

What is the best primary school in Sutton?

On Key Stage 2 results over 2023–25, Cuddington Croft Primary School and Nursery: 89% of pupils meet the expected standard in reading, writing and maths, against 62% at the average school in England.

Do Sutton secondary schools have sixth forms?

Yes, all 14 do.

How do I apply for a school place in Sutton?

Through Sutton Council, for every state school including academies. Secondary applications close on 31 October (offers 1 March); primary on 15 January (offers 16 April).

How many schools in Sutton are full?

25 of 55 mainstream schools have at least as many pupils as places, on DfE’s January 2026 census. A full school still admits by its rules, usually distance after siblings.

How many state schools are in Sutton?

63 open state-funded schools are located in Sutton’s built-up area: 42 primary, 14 secondary and 7 other (special schools, alternative provision, nurseries and 16–19). Independent schools aren’t included.

Sources: DfE Get Information about Schools (16 October 2026), Key Stage 2 performance tables (2023–2025, three-year average) and Key Stage 4 (2025/26, provisional); Ofsted state-funded school inspections as at 30 September 2026 · DfE Get Information about Schools (16 October 2026), further-education and sixth-form colleges · TownRatings grades: our own summary of the data, ranked against UK towns only. All under the Open Government Licence v3.0.
Contains public sector information licensed under the Open Government Licence v3.0. Contains HM Land Registry data © Crown copyright and database right 2026. Contains OS data © Crown copyright and database right 2026 (ONS boundaries). Northern Ireland: Source: NISRA; contains Land & Property Services data and Ordnance Survey of Northern Ireland information, © Crown copyright, licensed under the Open Government Licence v3.0. Scotland: contains National Records of Scotland data, Registers of Scotland data and SEPA data, © Crown copyright / © SEPA 2025, licensed under the Open Government Licence v3.0.