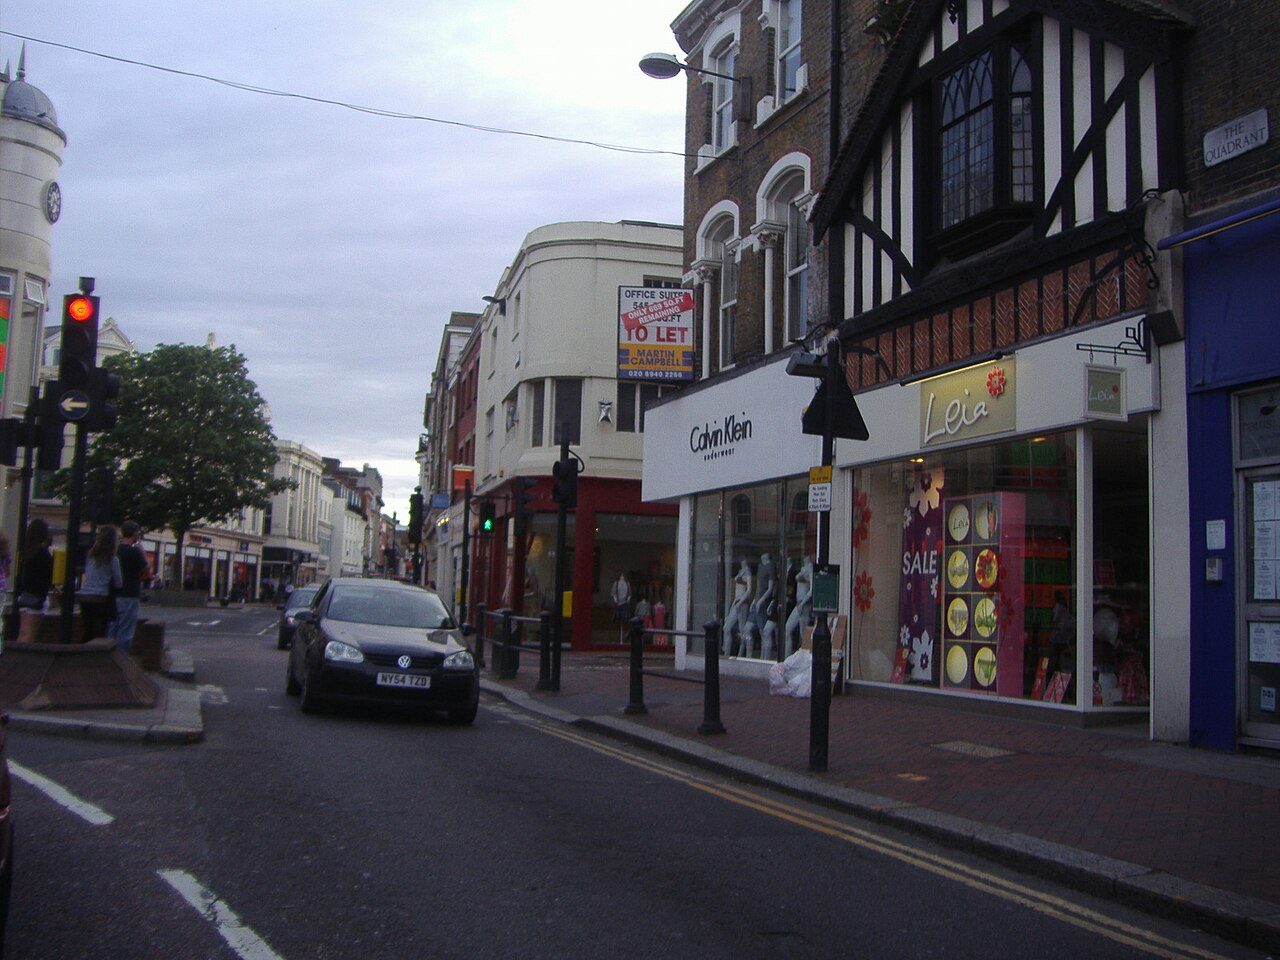
 Photo: David Howard · CC BY-SA 2.0
Life expectancy in Richmond upon Thames runs ahead of the figure across England: 82.2 for men and 86.6 for women
England as a whole stood at 79.1 and 83.0 over 2019 to 2023. Inside the borough, men’s life expectancy runs from 79.9 in Whitton to 84.3 in Richmond Central, 2.6 miles apart. Richmond upon Thames grades A for health: life expectancy, healthy life expectancy, early deaths, hospital admissions, child obesity and Census health, each adjusted for age; #2 of 33 in London.
What stands out about health in Richmond upon Thames
More A&E patients are seen within four hours than across England
Chelsea and Westminster Hospital NHS Foundation Trust, which runs the A&E at West Middlesex University Hospital, saw 73% of major-A&E patients within four hours in the 12 months to September 2026, against 61% across England: 13th of 117 trusts. 1.8% of patients admitted through its A&Es waited more than 12 hours from the decision to admit, against 13% in England. A&E ↓
A 4-year gap from one part of Richmond upon Thames to another
Men in Richmond Central can expect to live to 84.3, longer than the English average of 79.1. In Whitton, 2.6 miles away, the figure is 79.9, and Heathfield records 88 deaths under 75 for every 100 expected for its ages. For women the range is 83.9 in Nursery Lands & Hampton North to 90.4 in Twickenham Town. Neighbourhoods ↓
Patients rate Richmond upon Thames’ GP practices above England’s
In the 2026 GP Patient Survey, 83% of patients at Richmond upon Thames’ 27 practices called their overall experience good, against 77% across England, and 70% found it easy to get through by phone (57% in England). That is ahead of 66% of English towns. GP practices ↓
Fewer of Richmond upon Thames’ children are obese
12% of Year 6 children (aged 10 to 11) were measured as obese over the last three school years, against 22.3% across England; fewer than in 92% of UK towns. Health Grade ↓
NHS dentists are easier to get than in most of England
Of adults in the South West London area who tried to get an NHS dental appointment in the last two years, 87% succeeded, 4th highest of 36; across England it was 82%. Dentists ↓
Written from the OHID, NHS England and GP Patient Survey figures on this page. Life expectancy covers 2019 to 2023; neighbourhoods are ONS middle-layer areas of about 8,000 people.
Richmond upon Thames grades A for health
Healthier than 91% of UK towns, on age-adjusted measures.
What holds the grade back: emergency admissions and preventable deaths (better than 49% and 77% of UK towns). What lifts it: disability (94%) and women’s years in good health (93%). Among the 42 UK towns of 135,000 to 260,000 people, Richmond upon Thames’ Health Grade is the 1st highest.
Each measure is ranked against every UK town of 1,000 or more, the ranks are averaged, and the average is ranked again. Every measure allows for the town’s ages: life expectancy is worked out from the death rate at each age, so it doesn’t depend on how old the town’s residents are; deaths and admissions are counted against what England’s rates would give a town with these ages, and the Census answers against England and Wales’s rates by single year of age, so a seaside town of retired people isn’t marked down for being old.
Chelsea and Westminster Hospital saw 73% of major-A&E patients within four hours
Type 1 (major) A&E attendances seen, admitted or discharged within four hours of arrival, by month. NHS England publishes it by trust, not hospital: Chelsea and Westminster Hospital NHS Foundation Trust runs the A&E at West Middlesex University Hospital, the nearest to Richmond upon Thames (1.7 mi).
The share seen within four hours has held near 73% over 18 months. Long waits for a bed are rarer than at 79% of trusts: 613 patients in 12 months, 1.8% of emergency admissions through A&E. CQC’s latest ratings for West Middlesex University Hospital: urgent and emergency services good (2018), the hospital overall good (2020).
London trusts
Hospitals within 25 miles
| Distance | Hospital | CQC overall | Urgent & emergency |
|---|---|---|---|
| 1.7 mi | West Middlesex University Hospital A&E Isleworth · Chelsea and Westminster Hospital NHS Foundation Trust | Good2020 | Good2018 |
| 1.8 mi | Teddington Memorial Hospital Teddington · Kingston and Richmond NHS Foundation Trust | Not rated | — |
| 2.9 mi | Kingston Hospital A&E Kingston Upon Thames · Kingston and Richmond NHS Foundation Trust | Good2022 | Good2018 |
| 3.4 mi | Queen Mary's Hospital London · St George's University Hospitals NHS Foundation Trust | Requires improvement2025 | — |
| 4.2 mi | Molesey Community Hospital West Molesey · Epsom and St Helier University Hospitals NHS Trust | Good2017 | — |
| 4.8 mi | Ealing Hospital A&E Southall · London North West University Healthcare NHS Trust | Requires improvement2025 | Requires improvement2025 |
| 5.1 mi | Charing Cross Hospital A&E London · Imperial College Healthcare NHS Trust | Good2026 | Requires improvement2018 |
| 5.9 mi | Hammersmith Hospitals London · Imperial College Healthcare NHS Trust | Requires improvement2019 | — |
NHS acute hospitals registered with the Care Quality Commission (care directory, 01 October 2026). “A&E” marks a major (type 1) emergency department, open 24 hours and led by consultants, in NHS England’s Emergency Care Data Set; a hospital without the mark may still have a minor injury unit or urgent treatment centre. Ratings run Outstanding, Good, Requires improvement, Inadequate; the year is when each was published. Distances are straight lines from the town centre.
Men’s life expectancy across Richmond upon Thames runs from 79.9 to 84.3
Life expectancy at birth, 2019–23, in Richmond upon Thames’ 23 middle-layer neighbourhoods (about 8,000 people each). Circles are sized by residents and show men’s life expectancy.
The gap follows deprivation less closely inside Richmond upon Thames than across England. Heathfield has the most deaths under 75 for its ages (88 per 100 expected), against 51 in Richmond Central.
Show every measure as a table
| Neighbourhood | Men | Women | Deaths under 75 | Emergency admissions | Year 6 obese | Income-deprived |
|---|---|---|---|---|---|---|
| Richmond Central | 84.3 | 87.7 | 51 | 64 | 12% | 6.1% |
| Richmond Park, Sheen Gate & Petersham | 84.2 | 86.7 | 51 | 64 | 14% | 7.3% |
| Hampton Wick & Teddington East | 84.0 | 88.8 | 58 | 82 | 14% | 12% |
| North Barnes | 83.9 | 86.6 | 51 | 74 | 9.1% | 12% |
| Kew Gardens | 83.9 | 86.3 | 47 | 70 | 17% | 6.4% |
| Twickenham Marble Hill | 83.5 | 84.4 | 58 | 78 | 8.3% | 6.1% |
| East Sheen North | 83.1 | 87.1 | 59 | 71 | 6.9% | 7.7% |
| St Margarets | 82.6 | 86.0 | 54 | 74 | 12% | 6.1% |
| Hampton Village | 82.6 | 85.7 | 61 | 93 | 12% | 12% |
| Queen's Road | 82.5 | 87.2 | 51 | 82 | 6.9% | 12% |
| Strawberry Hill | 82.4 | 90.1 | 63 | 82 | 9.4% | 7.9% |
| Twickenham North | 82.3 | 87.3 | 68 | 87 | 13% | 8.5% |
| Mortlake & South Barnes | 82.3 | 87.0 | 70 | 72 | 12% | 14% |
| Twickenham West | 82.2 | 84.7 | 70 | 102 | 12% | 14% |
| Nursery Lands & Hampton North | 82.0 | 83.9 | 88 | 122 | 15% | 20% |
| Teddington Central | 81.5 | 84.5 | 64 | 86 | 8.1% | 11% |
| Hampton Hill | 81.2 | 85.0 | 64 | 96 | 14% | 10% |
| Teddington North | 80.8 | 87.1 | 65 | 81 | 11% | 9.6% |
| North Sheen | 80.8 | 88.9 | 67 | 91 | 12% | 16% |
| Ham | 80.5 | 86.0 | 74 | 92 | 13% | 20% |
| Twickenham Town | 80.4 | 90.4 | 58 | 86 | 8.3% | 8.7% |
| Heathfield | 80.1 | 85.2 | 88 | 120 | 24% | 26% |
| Whitton | 79.9 | 84.7 | 84 | 107 | 18% | 16% |
Deaths and admissions per 100 expected for each area’s ages (England = 100). Each figure has a range: Whitton’s men’s life expectancy is 79.9 with a 95% range of 78.0 to 81.7. Neighbourhoods are ONS middle-layer areas at least 30% inside Richmond upon Thames; names are the House of Commons Library’s.
83% of patients rate Richmond upon Thames’ 27 GP practices good
GP Patient Survey 2026 (NHS England, run by Ipsos), about 100 patients a practice, against 77% across England. 3rd of 39 English towns of 135,000 to 260,000, from the highest.
| Practice | Overall experience | Easy by phone | Wait about right | CQC |
|---|---|---|---|---|
| Dr Jezierski & Partners SW14 8LP · 14,070 adult patients | 95% good · range 83%–99% | 77% | 78% | Good2016 |
| Richmond Lock Surgery TW1 1PS · 5,998 adult patients | 93% good · range 88%–96% | 94% | 61% | Good2016 |
| Park Road Surgery TW11 0AU · 10,213 adult patients | 90% good · range 79%–95% | 75% | 85% | Good2016 |
| Cross Deep Surgery TW1 4QP · 9,516 adult patients | 89% good · range 75%–95% | 82% | 78% | Good2016 |
| The Paradise Road Practice TW9 1SA · 2,100 adult patients | 88% good · range 86%–89% | 88% | 81% | Good2026 |
| Twickenham Park Surgery - Johal TW1 2AR · 6,863 adult patients | 88% good · range 79%–93% | 93% | 90% | Good2017 |
| Broad Lane Surgery TW12 3AX · 5,580 adult patients | 87% good · range 81%–92% | 58% | 76% | Good2016 |
| Jubilee Surgery - Boohan TW2 6JL · 4,595 adult patients | 86% good · range 80%–91% | 82% | 60% | Good2018 |
| Hampton Medical Centre TW12 2PB · 9,259 adult patients | 85% good · range 75%–91% | 51% | 79% | Good2017 |
| Staines Road Surgery TW2 5AU · 2,930 adult patients | 85% good · range 82%–88% | 80% | 66% | Good2018 |
| Thameside Medical Practice - Childs & Partners TW11 8HU · 4,116 adult patients | 85% good · range 82%–88% | 66% | 81% | Good2017 |
| O'Flynn - Hampton Wick KT1 4DY · 7,528 adult patients | 85% good · range 76%–90% | 81% | 60% | Good2025 |
| Seymour House Surgery - Hudson TW9 1UU · 10,360 adult patients | 85% good · range 72%–92% | 70% | 86% | Good2020 |
| Dr Vishwambhar Sinha TW2 6JL · 2,864 adult patients | 84% good · range 79%–87% | 69% | 70% | Good2026 |
| Sheen Surgery SW14 8LP · 9,279 adult patients | 83% good · range 72%–91% | 67% | 66% | Good2016 |
| Hampton Hill Medical Centre TW12 1NY · 6,993 adult patients | 83% good · range 73%–90% | 45% | 66% | Good2020 |
| The Parkshot Medical Practice TW9 2RG · 11,769 adult patients | 82% good · range 69%–90% | 55% | 65% | Good2026 |
| The York Medical Practice TW1 3PA · 11,990 adult patients | 81% good · range 64%–91% | 89% | 56% | Good2017 |
| St Margaret's Medical Practice TW1 1NE · 10,461 adult patients | 81% good · range 53%–94% | 77% | 69% | Good2026 |
| Twickenham Park Medical Centre TW13 6HD · 2,804 adult patients | 80% good · range 76%–83% | 75% | 84% | Good2017 |
| The Acorn Group Practice - Jackson TW1 4EA · 6,313 adult patients | 79% good · range 70%–86% | 55% | 55% | Good2018 |
| The Vineyard Surgery TW10 6PP · 5,755 adult patients | 76% good · range 72%–81% | 69% | 59% | Good2017 |
| Glebe Road Surgery - Botting SW13 0DR · 8,226 adult patients | 76% good · range 64%–85% | 38% | 70% | Good2016 |
| Essex House Surgery - Flood SW13 0LW · 10,771 adult patients | 75% good · range 65%–83% | 73% | 51% | Good2017 |
| The Green Surgery TW2 5TU · 6,546 adult patients | 74% good · range 65%–82% | 70% | 55% | Good2026 |
| Dr Mojgan Fitzmaurice TW9 4BH · 4,875 adult patients | 68% good · range 60%–75% | 71% | 50% | Good2016 |
| Woodlawn Medical Centre - Kudra TW2 6EE · 4,043 adult patients | 67% good · range 60%–73% | 47% | 48% | Good2022 |
Dr Jezierski & Partners has the borough’s highest rating (95%). You can register with any practice whose area covers your address.
GP Patient Survey 2026: surveys sent January to March 2026; results weighted by NHS England. The range is the 95% confidence interval. Adult patients: the survey’s practice population aged 16 and over. A practice counts as in Richmond upon Thames when its main surgery is inside the built-up area; branch surgeries are part of their main practice. CQC ratings © Care Quality Commission.
87% of adults in the South West London area who tried got an NHS dental appointment
Adults who tried to get an NHS dental appointment for themselves in the last two years, and got one. GP Patient Survey 2026, by integrated care system (the NHS area that plans dentistry for Richmond upon Thames).
South West London has the 4th highest of England’s 36 health areas; across England 82% of those who tried got an appointment. Of South West London patients who did, 76% rated the experience good (England 74%). NHS practices taking new patients are listed on the NHS website’s Find a dentist; for urgent dental pain, call NHS 111.
The survey asks GP patients about dentistry, so results are published for health areas, not towns or practices.
Men’s life expectancy in Richmond upon Thames is 1.0 years above what its level of deprivation predicts
Across 1,996 English towns of 2,500 or more, men’s life expectancy tracks income deprivation closely (correlation −0.81). Each dot is a town.
12% of Richmond upon Thames’ residents are income-deprived, less than in most English towns. For that level, the line predicts 81.3 years for men; Richmond upon Thames’ is 82.2. For women it predicts 84.8, and Richmond upon Thames’ 86.6 is 1.8 years above.
Income deprivation: share of residents in low-income households, English Indices of Deprivation 2025, averaged over each town’s neighbourhoods. A town above or below the line isn’t necessarily doing better or worse on care: students, prisons and hostels inside a boundary all shift the figures.
Care in and near Richmond upon Thames
The nearest A&E, the practice patients rate highest, and where to go when it’s urgent but not an emergency. In an emergency, call 999.
More people in Richmond upon Thames call their health good than across London
Census 2021, all residents, as answered (not adjusted for age).
Richmond upon Thames’ residents are older than London’s (16% are 65 or over, against 12%), which accounts for much of the difference. Adjusted for age, 60 report bad health for every 100 expected, fewer than the national rate.
Show as a table
| Census 2021 | Richmond upon Thames | London | England |
|---|---|---|---|
| Good or very good health | 89% | 85% | 82% |
| Fair health | 8.4% | 10% | 13% |
| Bad or very bad health | 3% | 4.3% | 5.2% |
| Disabled under the Equality Act | 12% | 13% | 17% |
| Day-to-day activities limited a lot | 4.4% | 5.8% | 7.4% |
London and England: all residents of their built-up areas (towns and cities), from the same Census 2021 output areas.
Richmond upon Thames’ Health Grade is 1st of 42 UK towns of 135,000 to 260,000
Ordered by Health Grade: the top three, the towns either side of Richmond upon Thames, and others in London. Life expectancy for men / women; deaths under 75 per 100 expected.
| # | Town | People | Life expectancy | Deaths under 75 | Health |
|---|---|---|---|---|---|
| 1 | Richmond upon Thames London | 192,888 | 82.2 / 86.6 | 64 | A |
| 2 | Kensington and Chelsea London | 143,348 | 81.5 / 86.2 | 72 | B+ |
| 3 | Kingston upon Thames London | 166,333 | 81.1 / 85.3 | 77 | B+ |
| … | |||||
| 5 | Westminster London | 203,571 | 81.2 / 85.4 | 83 | B− |
| 6 | Merton London | 214,931 | 79.9 / 84.6 | 83 | B− |
| 7 | Sutton London | 208,858 | 80.2 / 84.3 | 88 | B− |
| … | |||||
| 42 | Blackpool Lancashire | 149,087 | 74.3 / 79.2 | 167 | D− |
Health letters rank against every UK town of 1,000 or more; the order here is context only. Welsh towns are graded on life expectancy, healthy life expectancy and the two Census measures: OHID’s early-death, admissions and child-obesity figures cover England.
Health in the places around Richmond upon Thames
Life expectancy for men / women, and the nearest A&E. Tap a town for its health page.
| Town | People | Life expectancy | Nearest A&E | Health |
|---|---|---|---|---|
| Richmond upon Thames | 192,888 | 82.2 / 86.6 | 1.7 mi | A |
| Hounslow | 286,591 | 79.5 / 83.9 | 1.6 mi | C |
| Kingston upon Thames | 166,333 | 81.1 / 85.3 | 1.3 mi | B+ |
| West Molesey | 47,144 | 82.5 / 86.3 | 3.1 mi | A |
| Sunbury-on-Thames | 21,476 | 80.6 / 84.2 | 5.5 mi | B |
| Ealing | 367,271 | 79.4 / 84.4 | 1.6 mi | C+ |
| Hammersmith and Fulham | 182,187 | 78.5 / 83.9 | 0.3 mi | C+ |
| Ashford Common | 8,333 | 79.9 / 85.1 | 4.9 mi | B |
Hammersmith and Fulham, 5.3 miles away, has men’s life expectancy of 78.5, 3.7 years shorter than Richmond upon Thames’.
What this data can and can’t tell you
- A&E figures are for the trust. NHS England publishes four-hour waits by trust, not hospital, so Chelsea and Westminster Hospital NHS Foundation Trust’s figures cover every major A&E it runs. They count type 1 (major) departments; minor injury units and urgent treatment centres are left out, which is why they sit below the all-types figure NHS England headlines (75% for England).
- The GP survey is a survey. About 100 patients answer for each practice, so a practice’s figure has a range (shown in the table); small differences between practices aren’t meaningful. The town figure weights each practice by its adult patients, some of whom live outside Richmond upon Thames.
- Adjusted for age. A ratio of 100 means as many deaths, admissions or reports of bad health as England’s rates (England and Wales’s for the Census) would give a town with these ages; 120 means a fifth more.
- Small areas, summed to the town. OHID publishes these figures for middle-layer areas of about 8,000 people; the town’s figure averages the areas it covers, weighted by how many of their residents live in it, so a village shares its area’s figure with the countryside around it.
- Different years. Life expectancy and deaths cover 2019 to 2023; emergency admissions 2016/17 to 2020/21 (the latest OHID publishes for small areas, including the pandemic dip); child obesity the three school years to 2024/25; A&E the 12 months to September 2026; the GP Patient Survey early 2026; CQC ratings were published on different dates, shown in each row.
- Distances are straight lines. Miles are measured from the town’s centre to each site; the road is longer. For an emergency, call 999; for urgent advice, call NHS 111.
Questions about health in Richmond upon Thames
How healthy is Richmond upon Thames?
Richmond upon Thames earns an A for health, healthier than 91% of UK towns on measures adjusted for age, and 1st of 42 UK towns of its size. Life expectancy is 82.2 for men and 86.6 for women (England 79.1 and 83.0), and there are 64 deaths under 75 for every 100 expected.
Which parts of Richmond upon Thames have the highest life expectancy?
For men, Richmond Central (84.3), Richmond Park, Sheen Gate & Petersham (84.2) and Hampton Wick & Teddington East (84.0); the shortest is Whitton (79.9). For women, Twickenham Town is highest (90.4) and Nursery Lands & Hampton North lowest (83.9). OHID figures for 2019 to 2023, by neighbourhood of about 8,000 people.
How long are A&E waits at West Middlesex University Hospital?
NHS England publishes waits for the trust, Chelsea and Westminster Hospital NHS Foundation Trust. In the 12 months to September 2026 it saw 73% of major-A&E patients within four hours, against 61% across England; in September 2026 the figure was 73%. In an emergency call 999; for urgent advice call NHS 111.
Can I get an NHS dentist in Richmond upon Thames?
It is easier than in most of England. In the 2026 GP Patient Survey, 87% of adults in the South West London area who tried to get an NHS dental appointment in the last two years got one, against 82% across England. Practices taking new NHS patients are listed on the NHS website’s Find a dentist service.
Which GP practice in Richmond upon Thames do patients rate highest?
In the 2026 GP Patient Survey, Dr Jezierski & Partners (95% good overall), Richmond Lock Surgery (93% good overall) and Park Road Surgery (90% good overall). Across all 27 Richmond upon Thames practices, 83% of patients rate their practice good, against 77% in England.
What is the life expectancy in Richmond upon Thames?
82.2 years for men and 86.6 for women, on OHID’s figures for 2019 to 2023. Men can expect 71.2 of those years and women 73.5 in good health.
CQC ratings © Care Quality Commission.
Sources: OHID Fingertips small-area indicators (life expectancy and deaths 2019–23, emergency admissions 2016/17–2020/21, NCMP 2022/23–2024/25); House of Commons Library MSOA names · ONS health state life expectancy for small areas (MSOAs), England and Wales, 2019 to 2023 (healthy life expectancy) · ONS Census 2021 general health and disability, adjusted for age · Care Quality Commission care directory and latest ratings, 01 October 2026 · NHS Organisation Data Service · GP Patient Survey 2026 (NHS England, run by Ipsos) · NHS England, A&E Attendances and Emergency Admissions (monthly, by trust) and Emergency Care Data Set activity by site, June–September 2026 (type 1 A&Es) · MHCLG English Indices of Deprivation 2025 · TownRatings grades: our own summary of the data, ranked against UK towns only. All under the Open Government Licence v3.0.
Contains public sector information licensed under the Open Government Licence v3.0. Contains HM Land Registry data © Crown copyright and database right 2026. Contains OS data © Crown copyright and database right 2026 (ONS boundaries). Northern Ireland: Source: NISRA; contains Land & Property Services data and Ordnance Survey of Northern Ireland information, © Crown copyright, licensed under the Open Government Licence v3.0. Scotland: contains National Records of Scotland data, Registers of Scotland data and SEPA data, © Crown copyright / © SEPA 2025, licensed under the Open Government Licence v3.0.