Guest, Sign inJoin
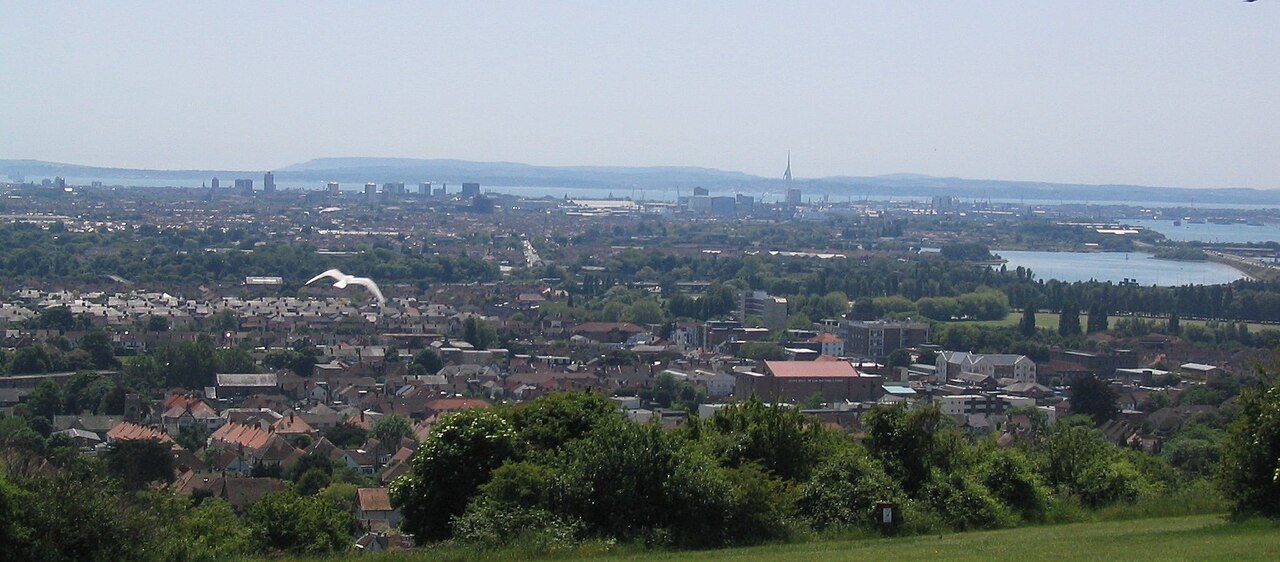
Portsmouth-from-PortsdownHillPhoto: AlanFord · Public domain
DSchool Grade
Schools in Portsmouth · DfE, Ofsted

Portsmouth’s state schools trail 89% of towns in England on results

Reading, writing and maths at the expected standard: 54% of primary pupils in Portsmouth, below both Hampshire’s towns (63%) and towns in England (62%). 67 state-funded schools are located in Portsmouth’s built-up area. Portsmouth grades D for schools, on Department for Education Key Stage 2 and GCSE results: #69 of 76 in Hampshire. Ofsted is shown, not graded.

State schools
67
50 primary, 11 secondary
Reading, writing & maths
54%
meet the expected standard at 11 · 2023–25
England’s schools: 62%
Attainment 8
40.8
GCSE average across 8 subjects · 2025/26
England’s schools: 47.3
Grade 5+ English & maths
35%
a strong pass in both · 2025/26
England’s schools: 47%

Town figures are pupil-weighted across the schools the grade uses; England’s are the average school.

What stands out · In brief

What stands out about Portsmouth’s schools

Below England at both ages

Portsmouth’s secondary results beat 15% of English towns; its primary results beat 17%. 54% of the city’s 11-year-olds meet the expected standard in reading, writing and maths, against 62% at the average school in England and 53% across Portsmouth. The spread between primaries is wide: 77% at St John's Cathedral Catholic Primary School, 34% at Portsdown Primary School. Every school’s result ↓

After 16 it’s college

None of the 11 state secondaries in Portsmouth keeps pupils past 16. Most others go to a further-education or sixth-form college, or a sixth form in another town. After 16 ↓

Ark Ayrton beats its intake

Schools with more pupils on free school meals usually get lower results. At Ark Ayrton Primary Academy, 63% of pupils are on free school meals and 72% meet the expected standard; a typical school in England with that intake reaches 51%. Results and intake ↓

Written from the Department for Education and Ofsted data on this page.

School Grade

Portsmouth grades D for schools

Against every town in England with results; Wales publishes none.

Primary: reading, writing and maths at 11 (54% meet the standard)Better than 17% of towns in England
Secondary: Attainment 8 and grade 5+ English and maths (40.8 and 35%)Better than 15% of towns in England
Each of Portsmouth’s 36 primaries: % meeting the expected standard in reading, writing and maths (2023–25)30%40%50%60%70%80%England 62%Portsmouth 53%Arundel Court Primary Academy and Nursery: 34% · D−Portsdown Primary School: 34% · D−The Flying Bull Academy: 36% · D−Beacon View Primary Academy: 38% · D−King's Academy College Park (Junior): 43% · DKing's Academy Northern Parade (Junior): 43% · DCopnor Primary School: 46% · DCottage Grove Primary School and Nursery: 46% · DStamshaw Junior School: 46% · DMilton Park Primary School: 47% · DMedina Primary School: 48% · C−Wimborne Primary School: 48% · C−The Victory Primary School: 49% · C−New Horizons Primary School: 50% · C−St George's Beneficial Church of England (Voluntary Controlled) Primary School: 53% · C−Highbury Primary School: 54% · CCourt Lane Junior Academy: 55% · CCraneswater Junior School: 55% · CFernhurst Junior School: 56% · CGatcombe Park Primary School: 56% · CWestover Primary School: 56% · CSolent Junior School: 57% · CNorthern Junior School: 58% · C+Penbridge Junior School: 58% · C+St Jude's CofE Primary School: 59% · C+Corpus Christi Catholic Primary School: 61% · B−Meon Junior School: 62% · B−Red Barn Community Primary School: 63% · B−Langstone Primary Academy: 66% · BArk Dickens Primary Academy: 67% · BSt Swithun's Catholic Primary School: 67% · BCastle Primary School: 69% · B+St Paul's Catholic Primary School: 69% · B+Wicor Primary School: 71% · A−Ark Ayrton Primary Academy: 72% · A−St John's Cathedral Catholic Primary School: 77% · A
Each of Portsmouth’s 11 secondaries: Attainment 8 (2025/26)30354045505560England 47Portsmouth 40Mayfield School: 31 · D−The Portsmouth Academy: 35 · DMiltoncross Academy: 36 · DCastle View Academy: 39 · C−Ark Charter Academy: 40 · C−Trafalgar School: 40 · DPortchester Community School: 41 · C−Admiral Lord Nelson School: 42 · C−Springfield School: 42 · CPriory School: 43 · C+St Edmund's Catholic School: 56 · A
England’s average schoolPortsmouth’s average school

The primary figure: 36 primaries in the town, 7,367 pupils in results over three years. The secondary figure: 11 secondaries in the town, 2,160 pupils in results. Mainstream state schools only (grammar schools included); special schools, alternative provision, nurseries and 16–19 colleges are listed below but not graded. Each school’s results are compared with every school in England, then weighted by its pupils.

Map

Where Portsmouth’s 67 state schools are

Each school at its address, coloured by its own letter and sized by pupils. Open a school for its own page. The dashed shape is Portsmouth’s built-up area.

The Wymering School · no letter · 77 pupilsRedwood Park Academy · no letter · 168 pupilsThe Harbour School · no letter · 169 pupilsMary Rose Academy · no letter · 201 pupilsCliffdale Primary Academy · no letter · 218 pupilsMoorings Way Infant School · no letter · 116 pupilsNorthern Infant School · no letter · 130 pupilsMeon Infant School · no letter · 133 pupilsBramble Infant School and Nursery · no letter · 162 pupilsSouthsea Infant School · no letter · 167 pupilsDevonshire Infant School · no letter · 171 pupilsCumberland Infant School · no letter · 172 pupilsGatcombe Park Primary School · C · 203 pupilsMedina Primary School · C− · 204 pupilsRed Barn Community Primary School · B− · 206 pupilsPenbridge Infant School · no letter · 207 pupilsNorthern Junior School · C+ · 211 pupilsWestover Primary School · C · 226 pupilsKing's Academy Northern Parade (Infant) · no letter · 231 pupilsManor Infant and Nursery School · no letter · 232 pupilsBeacon View Primary Academy · D− · 233 pupilsSt John's Cathedral Catholic Primary School · A · 237 pupilsStamshaw Infant Academy · no letter · 262 pupilsSolent Infant School · no letter · 269 pupilsSt Paul's Catholic Primary School · B+ · 272 pupilsSt George's Beneficial Church of England (Voluntary Controlled) Primary School · C− · 274 pupilsStamshaw Junior School · D · 289 pupilsKing's Academy College Park (Infant) · no letter · 304 pupilsCorpus Christi Catholic Primary School · B− · 312 pupilsMeon Junior School · B− · 336 pupilsCourt Lane Infant Academy · no letter · 346 pupilsFernhurst Junior School · C · 349 pupilsSt Swithun's Catholic Primary School · B · 351 pupilsKing's Academy Northern Parade (Junior) · D · 352 pupilsSolent Junior School · C · 359 pupilsThe Victory Primary School · C− · 365 pupilsMilton Park Primary School · D · 382 pupilsCastle Primary School · B+ · 384 pupilsHighbury Primary School · C · 391 pupilsPortsdown Primary School · D− · 398 pupilsSt Jude's CofE Primary School · C+ · 407 pupilsThe Flying Bull Academy · D− · 415 pupilsPenbridge Junior School · C+ · 416 pupilsWicor Primary School · A− · 421 pupilsKing's Academy College Park (Junior) · D · 434 pupilsArk Dickens Primary Academy · B · 446 pupilsCottage Grove Primary School and Nursery · D · 462 pupilsCourt Lane Junior Academy · C · 474 pupilsUTC Portsmouth · no letter · 491 pupilsArk Ayrton Primary Academy · A− · 495 pupilsCraneswater Junior School · C · 508 pupilsNew Horizons Primary School · C− · 509 pupilsWimborne Primary School · C− · 557 pupilsLangstone Primary Academy · B · 620 pupilsCopnor Primary School · D · 632 pupilsArundel Court Primary Academy and Nursery · D− · 668 pupilsPortchester Community School · C− · 688 pupilsCastle View Academy · C− · 757 pupilsArk Charter Academy · C− · 883 pupilsMiltoncross Academy · D · 983 pupilsTrafalgar School · D · 1,031 pupilsSpringfield School · C · 1,133 pupilsSt Edmund's Catholic School · A · 1,157 pupilsThe Portsmouth Academy · D · 1,203 pupilsAdmiral Lord Nelson School · C− · 1,245 pupilsPriory School · C+ · 1,278 pupilsMayfield School · D− · 1,354 pupils© OpenStreetMap contributors
PrimarySecondarySpecial, nursery, 16–19Size: pupilsABCDNo letter

Most schools give places by distance once siblings are in, so the schools nearest a home matter more than any league table.

Results and intake

Which schools do better than their intake suggests

Schools with more pupils on free school meals tend to get lower results. The dashed line is the typical school in England for each level of free school meals; the band holds the middle two-thirds. A dot above the band is doing better than schools like it.

Primaries: KS2 reading, writing and maths against free school meals30%40%50%60%70%80%0%10%20%30%40%50%60%70%Pupils on free school meals →typical school in EnglandArk Ayrton Primary Academy: 72% with 63% on free school meals (a typical school with that intake: 51%)Ark Dickens Primary Academy: 67% with 55% on free school meals (a typical school with that intake: 53%)Arundel Court Primary Academy and Nursery: 34% with 60% on free school meals (a typical school with that intake: 52%)Beacon View Primary Academy: 38% with 56% on free school meals (a typical school with that intake: 53%)Castle Primary School: 69% with 16% on free school meals (a typical school with that intake: 64%)Copnor Primary School: 46% with 26% on free school meals (a typical school with that intake: 61%)Corpus Christi Catholic Primary School: 61% with 18% on free school meals (a typical school with that intake: 64%)Cottage Grove Primary School and Nursery: 46% with 49% on free school meals (a typical school with that intake: 55%)Court Lane Junior Academy: 55% with 22% on free school meals (a typical school with that intake: 63%)Craneswater Junior School: 55% with 27% on free school meals (a typical school with that intake: 61%)Fernhurst Junior School: 56% with 36% on free school meals (a typical school with that intake: 59%)Gatcombe Park Primary School: 56% with 27% on free school meals (a typical school with that intake: 61%)Highbury Primary School: 54% with 28% on free school meals (a typical school with that intake: 61%)King's Academy College Park (Junior): 43% with 30% on free school meals (a typical school with that intake: 60%)King's Academy Northern Parade (Junior): 43% with 36% on free school meals (a typical school with that intake: 58%)Langstone Primary Academy: 66% with 30% on free school meals (a typical school with that intake: 60%)Medina Primary School: 48% with 46% on free school meals (a typical school with that intake: 56%)Meon Junior School: 62% with 30% on free school meals (a typical school with that intake: 60%)Milton Park Primary School: 47% with 41% on free school meals (a typical school with that intake: 57%)New Horizons Primary School: 50% with 35% on free school meals (a typical school with that intake: 59%)Northern Junior School: 58% with 15% on free school meals (a typical school with that intake: 65%)Penbridge Junior School: 58% with 51% on free school meals (a typical school with that intake: 54%)Portsdown Primary School: 34% with 53% on free school meals (a typical school with that intake: 54%)Red Barn Community Primary School: 63% with 12% on free school meals (a typical school with that intake: 65%)Solent Junior School: 57% with 13% on free school meals (a typical school with that intake: 65%)St George's Beneficial Church of England (Voluntary Controlled) Primary School: 53% with 61% on free school meals (a typical school with that intake: 52%)St John's Cathedral Catholic Primary School: 77% with 26% on free school meals (a typical school with that intake: 61%)St Jude's CofE Primary School: 59% with 29% on free school meals (a typical school with that intake: 61%)St Paul's Catholic Primary School: 69% with 42% on free school meals (a typical school with that intake: 57%)St Swithun's Catholic Primary School: 67% with 18% on free school meals (a typical school with that intake: 64%)Stamshaw Junior School: 46% with 47% on free school meals (a typical school with that intake: 55%)The Flying Bull Academy: 36% with 57% on free school meals (a typical school with that intake: 53%)The Victory Primary School: 49% with 49% on free school meals (a typical school with that intake: 55%)Westover Primary School: 56% with 22% on free school meals (a typical school with that intake: 62%)Wicor Primary School: 71% with 11% on free school meals (a typical school with that intake: 66%)Wimborne Primary School: 48% with 17% on free school meals (a typical school with that intake: 64%)Ark AyrtonPortsdownArundel CourtKing's Academy College Park (Junior)
Secondaries: Attainment 8 against free school meals25303540455055600%10%20%30%40%50%60%70%Pupils on free school meals →typical school in EnglandAdmiral Lord Nelson School: 42 with 28% on free school meals (a typical school with that intake: 48)Ark Charter Academy: 40 with 66% on free school meals (a typical school with that intake: 35)Castle View Academy: 39 with 58% on free school meals (a typical school with that intake: 37)Mayfield School: 31 with 36% on free school meals (a typical school with that intake: 45)Miltoncross Academy: 36 with 47% on free school meals (a typical school with that intake: 41)Portchester Community School: 41 with 31% on free school meals (a typical school with that intake: 47)Priory School: 43 with 35% on free school meals (a typical school with that intake: 45)Springfield School: 42 with 31% on free school meals (a typical school with that intake: 47)St Edmund's Catholic School: 56 with 28% on free school meals (a typical school with that intake: 48)The Portsmouth Academy: 35 with 56% on free school meals (a typical school with that intake: 38)Trafalgar School: 40 with 42% on free school meals (a typical school with that intake: 43)MayfieldSt Edmund'sAdmiral Lord NelsonMiltoncross

The share of pupils on free school meals runs from 9% at Northern Infant School to 66% at Ark Charter Academy. Against schools with the same intake, Ark Ayrton Primary Academy does best: 72% with 63% on free school meals, where a typical school would reach 51%. 11 of 36 primaries and 3 of 11 secondaries are above the line.

Show as a table
SchoolFree school mealsResultTypical for that intakeDifference
Ark Ayrton Primary AcademyKS2 %63%72%51%+21
St John's Cathedral Catholic Primary SchoolKS2 %26%77%61%+16
Ark Dickens Primary AcademyKS2 %55%67%53%+14
St Paul's Catholic Primary SchoolKS2 %42%69%57%+12
St Edmund's Catholic SchoolAttainment 828%5648+8
Langstone Primary AcademyKS2 %30%66%60%+6
Wicor Primary SchoolKS2 %11%71%66%+5
Ark Charter AcademyAttainment 866%4035+5
Castle Primary SchoolKS2 %16%69%64%+5
Penbridge Junior SchoolKS2 %51%58%54%+4
St Swithun's Catholic Primary SchoolKS2 %18%67%64%+3
Meon Junior SchoolKS2 %30%62%60%+2
Castle View AcademyAttainment 858%3937+2
St George's Beneficial Church of England (Voluntary Controlled) Primary SchoolKS2 %61%53%52%+1
St Jude's CofE Primary SchoolKS2 %29%59%61%−2
Priory SchoolAttainment 835%4345−2
Red Barn Community Primary SchoolKS2 %12%63%65%−2
Fernhurst Junior SchoolKS2 %36%56%59%−3
Corpus Christi Catholic Primary SchoolKS2 %18%61%64%−3
Trafalgar SchoolAttainment 842%4043−3
The Portsmouth AcademyAttainment 856%3538−4
Springfield SchoolAttainment 831%4247−4
Gatcombe Park Primary SchoolKS2 %27%56%61%−5
Portchester Community SchoolAttainment 831%4147−6
Miltoncross AcademyAttainment 847%3641−6
The Victory Primary SchoolKS2 %49%49%55%−6
Craneswater Junior SchoolKS2 %27%55%61%−6
Admiral Lord Nelson SchoolAttainment 828%4248−6
Westover Primary SchoolKS2 %22%56%62%−6
Northern Junior SchoolKS2 %15%58%65%−7
Highbury Primary SchoolKS2 %28%54%61%−7
Court Lane Junior AcademyKS2 %22%55%63%−8
Medina Primary SchoolKS2 %46%48%56%−8
Solent Junior SchoolKS2 %13%57%65%−8
New Horizons Primary SchoolKS2 %35%50%59%−9
Cottage Grove Primary School and NurseryKS2 %49%46%55%−9
Stamshaw Junior SchoolKS2 %47%46%55%−9
Milton Park Primary SchoolKS2 %41%47%57%−10
Mayfield SchoolAttainment 836%3145−14
Beacon View Primary AcademyKS2 %56%38%53%−15
King's Academy Northern Parade (Junior)KS2 %36%43%58%−15
Copnor Primary SchoolKS2 %26%46%61%−15
Wimborne Primary SchoolKS2 %17%48%64%−16
The Flying Bull AcademyKS2 %57%36%53%−17
King's Academy College Park (Junior)KS2 %30%43%60%−17
Arundel Court Primary Academy and NurseryKS2 %60%34%52%−18
Portsdown Primary SchoolKS2 %53%34%54%−20

Free school meals: pupils eligible now, DfE January 2026 census. The typical-school line is a straight-line fit across every graded school in England. It describes; it doesn’t grade: the School Grade uses results alone.

Getting a place

How school places work in Portsmouth

Portsmouth Council handles applications for every state school in Portsmouth, academies included. You apply to the council where you live, even for a school in another area.

Secondary (starting at 11)Apply by 31 October of Year 6. Offers on 1 March.
Primary (starting in Reception)Apply by 15 January before the September your child starts. Offers on 16 April.
Moving mid-yearApply to the council for an in-year place; it tells you which schools have room.

When a school is full

Every school publishes its admissions rules. Children in care come first, then, at most schools, brothers and sisters of current pupils, then those who live nearest. 8 of Portsmouth’s 61 mainstream schools have a religious character; some of them give priority by church attendance, so check each school’s rules. Infant classes are limited to 30 by law. If you’re refused a place, you can appeal to an independent panel.

Useful: Apply for a primary place (GOV.UK) · Apply for a secondary place (GOV.UK) · How admissions criteria work

How full each school is

Pupils on roll as a share of the school’s official capacity. The black tick is 100%; 7 schools are at or over it.

St John's Cathedral incl. nursery113%
Craneswater Junior106%
The Portsmouth105%
Trafalgar103%
Cottage Grove incl. nursery103%
Priory102%
St Swithun's incl. nursery100%
Springfield100%
Solent Junior100%
Solent Infant100%
Show all 61 schools
Admiral Lord Nelson100%
Corpus Christi99%
Court Lane Junior99%
Langstone98%
Miltoncross98%
Ark Charter98%
Wimborne98%
Red Barn98%
Medina97%
Ark Ayrton incl. nursery97%
Stamshaw Infant97%
Fernhurst Junior97%
St Jude's97%
Gatcombe Park97%
Wicor97%
St Edmund's96%
Northern Infant96%
Court Lane Infant96%
Cumberland Infant incl. nursery96%
Portsdown incl. nursery95%
Westover incl. nursery94%
Arundel Court incl. nursery94%
Mayfield93%
Meon Junior93%
Highbury93%
Ark Dickens incl. nursery93%
Southsea Infant93%
Copnor92%
Castle91%
Milton Park91%
Bramble Infant incl. nursery90%
Devonshire Infant90%
King's Academy College Park (Junior)88%
Northern Junior88%
Penbridge Infant incl. nursery87%
Penbridge Junior87%
Moorings Way Infant86%
King's Academy College Park (Infant)84%
The Flying Bull incl. nursery83%
New Horizons81%
Stamshaw Junior80%
Portchester Community80%
St George's Beneficial incl. nursery78%
The Victory incl. nursery78%
Castle View76%
Meon Infant74%
King's Academy Northern Parade (Junior)73%
Manor Infant incl. nursery71%
St Paul's incl. nursery65%
King's Academy Northern Parade (Infant)64%
Beacon View incl. nursery51%

DfE register of schools (GIAS), January 2026 census. Capacity often excludes a nursery class, so a school with a nursery can show over 100%.

The schools

67 state schools in Portsmouth

Each school’s own letter compares its results with every state school in England of the same phase: Key Stage 2 for primaries, GCSEs for secondaries. Open a school for its results, how its letter is worked out, Ofsted and a map.

Letters of Portsmouth’s schoolsA 4B 8C 21D 1420 without a letter
Primary schools50 · best KS2 results first
St John's Cathedral Catholic Primary School
Primary · ages 3–11 · Voluntary aided · Roman Catholic
A
77% met the KS2 standard (3 years)
237 pupilsOfsted: Good 2022
Ark Ayrton Primary Academy
Primary · ages 2–11 · Academy
A−
72% met the KS2 standard (3 years)
495 pupilsOfsted: Good 2024
Wicor Primary School
Primary · ages 4–11 · Community
A−
71% met the KS2 standard (3 years)
421 pupilsOfsted: Inspected 2024
Castle Primary School
Primary · ages 4–11 · Community
B+
69% met the KS2 standard (3 years)
384 pupilsOfsted: Good 2024
St Paul's Catholic Primary School
Primary · ages 3–11 · Voluntary aided · Roman Catholic
B+
69% met the KS2 standard (3 years)
272 pupilsOfsted: Good 2023
Ark Dickens Primary Academy
Primary · ages 2–11 · Academy
B
67% met the KS2 standard (3 years)
446 pupilsOfsted: Inspected 2025
St Swithun's Catholic Primary School
Primary · ages 2–11 · Voluntary aided · Roman Catholic
B
67% met the KS2 standard (3 years)
351 pupilsOfsted: Inspected 2025
Langstone Primary Academy
Primary · ages 4–11 · Academy
B
66% met the KS2 standard (3 years)
620 pupilsOfsted: Good 2021
Red Barn Community Primary School
Primary · ages 4–11 · Community
B−
63% met the KS2 standard (3 years)
206 pupilsOfsted: Outstanding 2024
Meon Junior School
Primary · ages 7–11 · Academy
B−
62% met the KS2 standard (3 years)
336 pupilsOfsted: report card 2025
Corpus Christi Catholic Primary School
Primary · ages 5–11 · Academy · Roman Catholic
B−
61% met the KS2 standard (3 years)
312 pupilsOfsted: Good 2024
St Jude's CofE Primary School
Primary · ages 4–11 · Voluntary controlled · Church of England
C+
59% met the KS2 standard (3 years)
407 pupilsOfsted: Good 2024
Penbridge Junior School
Primary · ages 7–11 · Academy
C+
58% met the KS2 standard (3 years)
416 pupilsOfsted: Good 2023
Northern Junior School
Primary · ages 7–11 · Community
C+
58% met the KS2 standard (3 years)
211 pupilsOfsted: Good 2023
Solent Junior School
Primary · ages 7–11 · Academy
C
57% met the KS2 standard (3 years)
359 pupilsOfsted: Inspected 2025
Fernhurst Junior School
Primary · ages 7–11 · Community
C
56% met the KS2 standard (3 years)
349 pupilsOfsted: Good 2023
Westover Primary School
Primary · ages 3–11 · Academy
C
56% met the KS2 standard (3 years)
226 pupilsOfsted: Good 2022
Gatcombe Park Primary School
Primary · ages 4–11 · Academy
C
56% met the KS2 standard (3 years)
203 pupilsOfsted: Good 2023
Craneswater Junior School
Primary · ages 7–11 · Community
C
55% met the KS2 standard (3 years)
508 pupilsOfsted: report card 2026
Court Lane Junior Academy
Primary · ages 7–11 · Academy
C
55% met the KS2 standard (3 years)
474 pupilsOfsted: Good 2024
Highbury Primary School
Primary · ages 0–11 · Academy
C
54% met the KS2 standard (3 years)
391 pupilsOfsted: report card 2025
St George's Beneficial Church of England (Voluntary Controlled) Primary School
Primary · ages 3–11 · Voluntary controlled · Church of England
C−
53% met the KS2 standard (3 years)
274 pupilsOfsted: Inspected 2025
New Horizons Primary School
Primary · ages 4–11 · Academy
C−
50% met the KS2 standard (3 years)
509 pupilsOfsted: Good 2023
The Victory Primary School
Primary · ages 3–11 · Academy
C−
49% met the KS2 standard (3 years)
365 pupilsOfsted: Inspected 2024
Show all 50 primary schools
Wimborne Primary School
Primary · ages 4–11 · Community
C−
48% met the KS2 standard (3 years)
557 pupilsOfsted: Good 2023
Medina Primary School
Primary · ages 4–11 · Community
C−
48% met the KS2 standard (3 years)
204 pupilsOfsted: Inspected 2025
Milton Park Primary School
Primary · ages 4–11 · Academy
D
47% met the KS2 standard (3 years)
382 pupilsOfsted: Good 2024
Copnor Primary School
Primary · ages 4–11 · Community
D
46% met the KS2 standard (3 years)
632 pupilsOfsted: Inspected 2025
Cottage Grove Primary School and Nursery
Primary · ages 2–11 · Academy
D
46% met the KS2 standard (3 years)
462 pupilsOfsted: Requires improvement 2024
Stamshaw Junior School
Primary · ages 7–11 · Academy
D
46% met the KS2 standard (3 years)
289 pupilsOfsted: Good 2023
King's Academy College Park (Junior)
Primary · ages 7–11 · Academy
D
43% met the KS2 standard (3 years)
434 pupilsOfsted: Inspected 2024
King's Academy Northern Parade (Junior)
Primary · ages 7–11 · Academy
D
43% met the KS2 standard (3 years)
352 pupilsOfsted: Good 2023
The Flying Bull Academy
Primary · ages 3–11 · Academy
D−
36% met the KS2 standard (3 years)
415 pupilsOfsted: report card 2026
Beacon View Primary Academy
Primary · ages 3–11 · Academy
D−
38% met the KS2 standard (3 years)
233 pupilsOfsted: Inspected 2025
Arundel Court Primary Academy and Nursery
Primary · ages 3–11 · Academy
D−
34% met the KS2 standard (3 years)
668 pupilsOfsted: report card 2026
Portsdown Primary School
Primary · ages 2–11 · Community
D−
34% met the KS2 standard (3 years)
398 pupilsOfsted: Good 2024
Court Lane Infant Academy
Primary · ages 4–7 · Academy
No letter
346 pupilsOfsted: Good 2024
King's Academy College Park (Infant)
Primary · ages 4–7 · Academy
No letter
304 pupilsOfsted: Good 2023
Solent Infant School
Primary · ages 4–7 · Academy
No letter
269 pupilsOfsted: Inspected 2025
Stamshaw Infant Academy
Primary · ages 4–7 · Academy
No letter
262 pupilsOfsted: Good 2023
Manor Infant and Nursery School
Primary · ages 2–7 · Community
No letter
232 pupilsOfsted: Good 2024
King's Academy Northern Parade (Infant)
Primary · ages 4–7 · Academy
No letter
231 pupilsOfsted: Inspected 2024
Penbridge Infant School
Primary · ages 2–7 · Academy
No letter
207 pupilsOfsted: Good 2022
Cumberland Infant School
Primary · ages 2–7 · Community
No letter
172 pupilsOfsted: Good 2022
Devonshire Infant School
Primary · ages 4–7 · Community
No letter
171 pupilsOfsted: report card 2026
Southsea Infant School
Primary · ages 4–7 · Community
No letter
167 pupilsOfsted: report card 2026
Bramble Infant School and Nursery
Primary · ages 2–7 · Community
No letter
162 pupilsOfsted: Inspected 2025
Meon Infant School
Primary · ages 4–7 · Academy
No letter
133 pupilsOfsted: Inspected 2025
Northern Infant School
Primary · ages 5–7 · Community
No letter
130 pupilsOfsted: Good 2023
Moorings Way Infant School
Primary · ages 4–7 · Academy
No letter
116 pupilsOfsted: report card 2026
Secondary schools11 · best GCSE results first

Key result: Attainment 8 and grade 5+ English and maths (GCSEs, 2025/26 provisional) for secondaries; the share meeting the expected standard in reading, writing and maths (KS2, DfE’s three-year average) for primaries. Pupils: the January 2026 school census. No letter: an infant or first school (no KS2 tests), a new school, a small cohort DfE suppresses, or a special school, nursery or college. Independent schools aren’t included.

Ofsted

Ofsted report cards

Each school’s latest inspection; report cards replace one-word judgements as schools are re-inspected.

Outstanding 2Good 19Report card 15Requires improvement 1Inadequate 1Ungraded inspection only 29

Ofsted stopped giving one-word judgements in 2024. Until a school is re-inspected, its last overall judgement is its most recent single grade; a school judged years ago may have changed a lot since.

Since November 2025 Ofsted gives each area of a school one of five grades (exceptional, strong standard, expected standard, needs attention, urgent improvement) and says whether safeguarding is met, instead of one overall word. 15 of Portsmouth’s 67 state schools have a report card so far; the others show their last inspection under the old framework. Ofsted is never part of the School Grade.

SchoolSafeguardingAchievementCurriculum and teachingInclusionAttendance and behaviourPersonal development and well-beingLeadership and governanceEarly yearsSixth form
Craneswater Junior SchoolJuly 2026MetExpected standardExpected standardStrong standardExpected standardStrong standardExpected standard——
Southsea Infant SchoolJune 2026MetNeeds attentionNeeds attentionExpected standardExpected standardExpected standardExpected standardExpected standard—
Admiral Lord Nelson SchoolJune 2026MetExpected standardExpected standardExpected standardExpected standardExpected standardExpected standard——
The Flying Bull AcademyJune 2026MetNeeds attentionNeeds attentionNeeds attentionNeeds attentionNeeds attentionNeeds attentionNeeds attention—
Castle View AcademyJune 2026MetExpected standardExpected standardExpected standardNeeds attentionExpected standardExpected standard——
The Wymering SchoolJune 2026MetExpected standardExpected standardStrong standardStrong standardStrong standardExpected standard——
Devonshire Infant SchoolMay 2026MetExpected standardExpected standardExpected standardExpected standardExpected standardExpected standardExpected standard—
Arundel Court Primary Academy and NurseryApril 2026MetNeeds attentionNeeds attentionNeeds attentionExpected standardNeeds attentionNeeds attentionNeeds attention—
The Harbour SchoolMarch 2026MetUrgent improvementNeeds attentionUrgent improvementUrgent improvementUrgent improvementUrgent improvement——
Moorings Way Infant SchoolJanuary 2026MetExpected standardExpected standardStrong standardExpected standardStrong standardExpected standardExpected standard—
Mary Rose AcademyJanuary 2026MetStrong standardStrong standardStrong standardStrong standardStrong standardStrong standardStrong standardExceptional
Meon Junior SchoolNovember 2025MetExpected standardExpected standardStrong standardExpected standardStrong standardStrong standard——
Cliffdale Primary AcademyNovember 2025MetStrong standardStrong standardStrong standardStrong standardStrong standardStrong standardStrong standard—
Highbury Primary SchoolNovember 2025MetExpected standardExpected standardStrong standardExpected standardExpected standardExpected standardExpected standard—
UTC PortsmouthNovember 2025MetStrong standardStrong standardStrong standardStrong standardExceptionalStrong standard—Strong standard
Who runs them

15 academy trusts and the council

Academies are state schools run by a trust rather than the council: the trust employs the staff and can set its own curriculum and term dates. Admissions still go through the council.

Run bySchoolsPupilsTheir letters
University of Chichester (Multi) Academy TrustArundel Court, Langstone, Court Lane Junior, The Flying Bull, Highbury, Court Lane Infant, Stamshaw Junior, Stamshaw Infant83,465D−BCD−CD
Thinking Schools Academy TrustThe Portsmouth, New Horizons, Penbridge Junior, Meon Junior, Penbridge Infant, Meon Infant, Moorings Way Infant72,920DC−C+B−
King's Group AcademiesKing's Academy College Park (Junior), King's Academy Northern Parade (Junior), King's Academy College Park (Infant), King's Academy Northern Parade (Infant)41,321DD
Salterns Academy TrustMayfield, Admiral Lord Nelson, Trafalgar33,630D−C−D
Ark SchoolsArk Charter, Ark Ayrton, Ark Dickens31,824C−A−B
De Curci TrustSpringfield, Solent Junior, Solent Infant31,761CC
United Learning TrustCastle View, The Victory, Beacon View31,355C−C−D−
Solent Academies TrustCliffdale, Mary Rose, Redwood Park3587—
Gateway Multi Academy TrustCottage Grove, Milton Park2844DD
Hamwic Education TrustWestover, Gatcombe Park2429CC
Southern Education TrustThe Harbour, The Wymering2246—
Bohunt Education TrustPriory11,278C+
Kemnal Academies TrustMiltoncross1983D
Utc PortsmouthUTC Portsmouth1491—
Edith Stein Catholic Academy TrustCorpus Christi1312B−
Portsmouth CouncilSt Edmund's, Portchester Community, Copnor, Wimborne, Craneswater Junior, Wicor, St Jude's, Portsdown, Castle, St Swithun's, Fernhurst Junior, St George's Beneficial, St Paul's, St John's Cathedral, Manor Infant, Northern Junior, Red Barn, Medina, Cumberland Infant, Devonshire Infant, Southsea Infant, Bramble Infant, Northern Infant238,290AC−DC−CA−C+D−B+BCC−B+AC+B−C−
After 16

Where Portsmouth’s teenagers go at 16

In England young people stay in education or training until 18: a sixth form, a college, or an apprenticeship.

All 11 state secondaries in Portsmouth teach 11 to 16. City of Portsmouth College, a further-education college, is in the city.

Secondaries with a sixth form
0 of 11
state schools in Portsmouth
Colleges within 12 miles
3
nearest: City of Portsmouth College
Grammar schools in Portsmouth
0
no selective state secondaries
CollegeDistance
City of Portsmouth CollegeFurther-education college · PO6 2SAin Portsmouth
Havant and South Downs CollegeFurther-education college · PO7 8AA4.2 mi
South Hampshire College GroupFurther-education college · PO14 1NH5.9 mi
Special needs

Special schools and alternative provision in Portsmouth

Portsmouth has 5 special schools (Cliffdale, Mary Rose, Redwood Park, The Harbour and The Wymering: 833 pupils). A special-school place isn’t applied for like a mainstream one: for a child with an education, health and care plan (EHCP), Portsmouth Council names the school in the plan, after asking the family’s preference. These schools have no letter, because their results don’t compare with mainstream schools’. Their cards ↑

Portsmouth Council’s SEND Local Offer lists support beyond these schools.

Towns its size

44th of 44 English towns and cities of 156,000 to 301,000

Ranked by School Grade, best first: the towns and cities either side of Portsmouth, and the top and bottom of the group.

#TownSchoolsKS2Attainment 8Grade 5+ E&M
1Richmond upon Thames LondonA+77%57.767%
…
40Peterborough CambridgeshireC57%44.540%
41Derby DerbyshireC−56%4440%
42Southampton HampshireC−58%41.737%
43Stoke-on-Trent StaffordshireC−59%40.834%
44Portsmouth HampshireD54%40.835%
Neighbours

Portsmouth and the places around it

Coloured by School Grade.

Gosport: D−Stoke: C−Waterlooville: CSouth Hayling: DHavant: DFareham: BLee-on-the-Solent: C−GosportStokeWaterloovilleSouth HaylingHavantFarehamLee-on-the-SolentPortsmouth
TownSchoolsKS2Att. 8
Portsmouth
67 schools
D54%40.8
Gosport
28 schools · 3.3 mi
D−52%34.9
Stoke
0 schools · uses schools within 3 km · 4.3 mi
C−60%37
Waterlooville
14 schools · 4.7 mi
C57%45.2
South Hayling
5 schools · uses schools within 3 km · 5 mi
D55%37.5
Havant
16 schools · 5.3 mi
D55%32.1
Fareham
19 schools · 5.8 mi
B65%44.5
Lee-on-the-Solent
6 schools · uses schools within 3 km · 6 mi
C−57%40.4

Fareham has the best-graded schools nearby (B). Small places often use the schools within 3 km, so neighbours can share schools.

How to read these numbers

What this data can and can’t tell you

  • Expected standard at Key Stage 2. The share of 11-year-olds who reach the expected standard in reading, writing and maths together, in tests and teacher assessment at the end of primary school. We use DfE’s three-year average (2023–2025) to steady small schools.
  • Higher standard. The share working at greater depth in all three. In Portsmouth: 3% (England’s average school: 8%).
  • Attainment 8. A pupil’s GCSE grades across eight subjects, with English and maths counted twice, added up. 50 is roughly a grade 5 in every subject.
  • Grade 5+ in English and maths. A strong pass in both. Grade 4 is a standard pass.
  • Provisional. 2025/26 GCSE figures are DfE’s first release; revised figures follow in February, usually within a point.
  • Progress 8. Not shown: there is none for 2025/26, because these pupils sat no KS2 tests in 2020 (Covid).
  • Free school meals. Pupils eligible for free school meals now, from the January census: the usual measure of how many pupils come from low-income homes.
  • Independent schools. Not included: they publish no results comparable with state schools’.

Questions about schools in Portsmouth

Are schools in Portsmouth good?

Portsmouth’s state schools earn a D against schools across England: primary results beat 17% of towns in England; secondary results beat 15% of towns in England, on Department for Education Key Stage 2 and GCSE results. School places are handled by Portsmouth council.

What is the best secondary school in Portsmouth?

On 2025/26 GCSE results, St Edmund's Catholic School: Attainment 8 of 56 and 64% with grade 5+ in English and maths, against 47.3 at the average school in England. Results are one measure; distance decides most places.

What is the best primary school in Portsmouth?

On Key Stage 2 results over 2023–25, St John's Cathedral Catholic Primary School: 77% of pupils meet the expected standard in reading, writing and maths, against 62% at the average school in England.

Do Portsmouth secondary schools have sixth forms?

No. All 11 state secondaries teach 11–16; students move at 16 to a college, a sixth form elsewhere or an apprenticeship.

How do I apply for a school place in Portsmouth?

Through Portsmouth Council, for every state school including academies. Secondary applications close on 31 October (offers 1 March); primary on 15 January (offers 16 April).

How many schools in Portsmouth are full?

7 of 61 mainstream schools have at least as many pupils as places, on DfE’s January 2026 census. A full school still admits by its rules, usually distance after siblings.

How many state schools are in Portsmouth?

67 open state-funded schools are located in Portsmouth’s built-up area: 50 primary, 11 secondary and 6 other (special schools, alternative provision, nurseries and 16–19). Independent schools aren’t included.

Sources: DfE Get Information about Schools (16 October 2026), Key Stage 2 performance tables (2023–2025, three-year average) and Key Stage 4 (2025/26, provisional); Ofsted state-funded school inspections as at 30 September 2026 · DfE Get Information about Schools (16 October 2026), further-education and sixth-form colleges · TownRatings grades: our own summary of the data, ranked against UK towns only. All under the Open Government Licence v3.0.
Contains public sector information licensed under the Open Government Licence v3.0. Contains HM Land Registry data © Crown copyright and database right 2026. Contains OS data © Crown copyright and database right 2026 (ONS boundaries). Northern Ireland: Source: NISRA; contains Land & Property Services data and Ordnance Survey of Northern Ireland information, © Crown copyright, licensed under the Open Government Licence v3.0. Scotland: contains National Records of Scotland data, Registers of Scotland data and SEPA data, © Crown copyright / © SEPA 2025, licensed under the Open Government Licence v3.0.