Trillium Industrial ParkKitchener
This neighbourhood in Kitchener has a population of 3,420. Of Kitchener’s 37 neighbourhoods, this is one.
Is Trillium Industrial Park a good place to live?
Trillium Industrial Park’s grades pull in different directions. Cost of living is its weak spot (D−). The neighbourhood grades B− overall, better than 47% of Canadian towns. That places it #555 of 858 in Ontario. People here tend to be in good health (A). School results are strong (B+). Elsewhere it is close to typical: C+ for safety, C+ for jobs & income and C+ for walkability.
Rents here are the metro area's average, shared by every town and neighbourhood in it. Safety less sure: this is the whole city's figure, because the city doesn't publish open neighbourhood crime rates. Health is graded on the health region's survey figures and life expectancy, with the distance to hospital giving the town its own spread.
How Trillium Industrial Park grades
Each subject compares Trillium Industrial Park with Canadian towns of 2,500 or more, ordered by how far it is from the middle. Towns in other countries are graded separately.
How TownRatings grades Canadian towns →
What makes Trillium Industrial Park stand out
The 3 things Trillium Industrial Park does most differently from other towns.
The data
Data highlights are ordered by what stands out in Trillium Industrial Park.
Rent takes more of local pay in Trillium Industrial Park than in Ontario’s towns or Canadian towns: 25% of household income
Shared with the rest of the Kitchener-Cambridge-Waterloo metro area: rent as a share of income and monthly rent for a two-bedroom
Nearly two in five households spent 30% or more of their income on shelter, above Ontario’s towns (22%) and Canadian towns (18%) alike. Owners put the median home at $675,000, about level with Ontario’s towns ($695,000) and above Canadian towns ($406,000).
What homes were worth · The median owner’s estimate at the 2021 census
| Census 2021 | Trillium Industrial Park | Ontario | Canada |
|---|---|---|---|
| Households spending 30%+ on shelter | 39% | 22% | 18% |
| Rent as a share of income | 25% | 22% | 20% |
| Median home value, 2021 | $675,000 | $695,000 | $406,000 |
Statistics Canada, Census 2021; CMHC Rental Market Survey via Statistics Canada · These are 2021 census values, as owners judged them, set against household income in 2020.
Few places match Trillium Industrial Park for health: it beats 92% of Canadian towns
Measured across the Waterloo Health Unit: health survey and life expectancy
The town’s own part is the trip to care, and Trillium Industrial Park is well placed: 1.4 km to a hospital on average, against 3.7 km typical. At 9%, the share of adults who smoke sits under the 11% for Ontario. Chronic conditions run at 16% of adults, age-standardised, lower than both Ontario’s towns (17%) and Canadian towns (17%). Adults here are more upbeat about their health than the province: 53% very good or excellent, against 51% in Ontario.
Very good or excellent health · adults, age-standardised
| Health | Trillium Industrial Park | Ontario | Canada |
|---|---|---|---|
| Chronic conditions (average share) | 16% | 17% | 17% |
| Smokers | 9% | 10% | 12% |
| Very good or excellent health | 53% | 51% | 52% |
| Life expectancy at birth | 82.8 | 82.8 | 81.5 |
Statistics Canada, Canadian Community Health Survey 2023/2024 and life expectancy 2022/2024; Open Database of Healthcare Facilities
Flood mapping exists for Trillium Industrial Park: 1 on record, latest by Grand River Conservation Authority
Earthquake risk for the city of Kitchener
Radon is lower than usual: 4% of tested homes in the survey area topped the guideline, against 6.6% for the typical town. For earthquakes Trillium Industrial Park is middling, $0.022 a year per $1,000 against $0.030 for the typical town.
Radon tests above the guideline · share of tested homes, 200 Bq/m³
| Hazards | Trillium Industrial Park | Ontario | Canada |
|---|---|---|---|
| Radon tests above the guideline | 4% | 4% | 6.6% |
| Earthquake loss per $1,000 of buildings a year | $0.022 | $0.043 | $0.030 |
NRCan seismic risk model and burned areas, Health Canada radon survey, the Flood Hazard Map Inventory
English or French, public or Catholic: Trillium Industrial Park’s schools come under 4 boards
Schooling in French is on offer at 5 of 51; in Ontario, one in ten schools teach in it. The largest is St Mary's High School, with 2,240 students. Also worth knowing: the 41 with results split, 8 in the upper two fifths in Ontario and 20 in the lower. Within 3 km of Trillium Industrial Park are 45 elementary schools and 6 secondary schools, teaching 25,620 students.
| School | Level | Students | System |
|---|---|---|---|
| St Josephine Bakhita Catholic Elementary School CatholicLargest elementary schoolElementary · Grades JK–8 | Elementary · Grades JK–8 | 815 | English Catholic |
| St Mary's High School CatholicLargest secondary schoolSecondary · Grades 9–12 | Secondary · Grades 9–12 | 2,240 | English Catholic |
| ÉÉC Cardinal-Léger FrenchTeaches in FrenchElementary · Grades JK–6 | Elementary · Grades JK–6 | 250 | French Catholic |
| ÉSC Père-René-de-Galinée FrenchResults in the top fifth in OntarioSecondary · Grades 9–12 | Secondary · Grades 9–12 | 495 | French Catholic |
Schools by system · Schools within 3 km
| Schools within 3 km | Trillium Industrial Park | Ontario | Canada |
|---|---|---|---|
| School boards | 4 | 4 | 3 |
Provincial school lists and results, 2024-25
For safety, Trillium Industrial Park gets a C+
Across the area its police cover, the Crime Severity Index averaged 72 over 2023–25, higher than both Ontario’s towns (56) and Canadian towns (67). Violence across its police area runs at 14.2 per 1,000 residents a year.
Year by year · Crime Severity Index for each year
| 2023–2025 | Trillium Industrial Park | Ontario | Canada |
|---|---|---|---|
| Violent crime | 14.2 | 10.5 | 12 |
| Crime Severity Index | 72 | 56 | 67 |
Statistics Canada, Uniform Crime Reporting Survey, 2023–2025 average · Area behind the Crime Severity Index, Violent Crime Severity Index, violent crime and property crime per 1,000 figures: the Waterloo Region (Kitchener) service area
January nights in Trillium Industrial Park drop to −10.3°C (Ontario towns −9.1°C, Canadian towns −13.5°C)
Between the last spring frost, 8 May, and the first in autumn, 5 October, lie 149 days. Some 115 cm of snow falls in a typical year, below both Ontario’s towns (146 cm) and Canadian towns (141 cm). Snow peaks in January: 32 cm in a normal year. A normal July brings 96 mm of precipitation, more than any other month.
Average high by season · ECCC normals, 1991–2020
| Normals, 1991–2020 | Trillium Industrial Park | Ontario | Canada |
|---|---|---|---|
| Snowfall a year | 115 cm | 146 cm | 141 cm |
| January night low | −10.3°C | −9.1°C | −13.5°C |
| July afternoon high | 26.6°C | 26.7°C | 25.5°C |
| Days with frost a year | 156 | 139 | 159 |
Environment and Climate Change Canada, Canadian Climate Normals 1991–2020 (Kitchener/Waterloo)
Trips to work from Trillium Industrial Park are shorter than from Ontario’s towns or Canadian towns: 24 min on average
How working residents got to work · census 2021
| Census 2021 | Trillium Industrial Park | Ontario | Canada |
|---|---|---|---|
| Average trip | 24 min | 29 min | 26 min |
Statistics Canada, Census 2021 (labour and commuting) · These are May 2021 figures, gathered while COVID-19 kept many people home or out of work.
Fewer children live in Trillium Industrial Park than in Ontario’s towns or Canadian towns: 12% are under 15
People 65 and over make up 25% of the town, above both Ontario’s towns (19%) and Canadian towns (19%). 27% of residents belong to a visible minority, about level with Ontario’s towns (26%) and above Canadian towns (15%).
Ages · Share of residents in each age group, Census 2021
Schooling · Highest qualification, residents 15 and over
Women and men · all residents
53.9% of Trillium Industrial Park’s residents are women
In 2021 there were 1,845 women to 1,575 men; Canada as a whole is 50.9% women.
| Trillium Industrial Park | Ontario | Canada | |
|---|---|---|---|
| Under 15 | 12% | 15% | 16% |
| 15 to 64 | 63% | 65% | 64% |
| 65+ | 25% | 19% | 19% |
| No certificate, diploma or degree | 15% | 15% | 16% |
| Postsecondary qualification | 55% | 56% | 56% |
Statistics Canada, Census 2021; Ontario and Canada: medians of towns of 2,500+
A normal November in Trillium Industrial Park runs from −2°C to 7°C
Then December: 1°C by day, −6°C at night. November normally sees 75 mm of precipitation. A typical November adds 9 cm of snow. Normal highs peak at 27°C in July; nights bottom out at −10°C in January.
Normal highs, the months ahead · ECCC normals, 1991–2020
| Season | High | Low | Rain and snow |
|---|---|---|---|
| Winter | −1°C | −9°C | 167 mm |
| Spring | 12°C | 0°C | 218 mm |
| Summer | 25°C | 13°C | 244 mm |
| Autumn | 14°C | 4°C | 221 mm |
ECCC normals, 1991–2020 (Kitchener/Waterloo); the forecast is on the Weather page
29,450 residents per council seat in Kitchener, a higher ratio than 98% of Ontario municipalities
City council runs Trillium Industrial Park; in October 2022, Kitchener chose Berry Vrbanovic as mayor.
| Turnout | Trillium Industrial Park | Ontario | Canada |
|---|---|---|---|
| Municipal election, 2022 | 20% | 31% | 31% |
Wikidata, MAMH, MMAH, Statistics Canada
Kitchener Public Library - Country Hills is Trillium Industrial Park’s public library
Trillium Industrial Park is served by Kitchener Public Library, the library of all of Kitchener, so the figures here are the city’s, for 292,240 people.
Provincial library statistics, OpenStreetMap, the CRA and Statistics Canada
20 public protected areas lie within 10 km of Trillium Industrial Park
The nearest national park is more than 100 km away. Trillium Woods Provincial Park is the closest provincial park, at 46 km. 0.5 km out lies the largest, Huron Natural Area, at 96 ha. Walkers have 2 mapped routes close by, starting with the Grand Valley Trail and Homer Watson Loop Trail.
Protected land · of the land within 10 km
| Outdoors | Trillium Industrial Park | Ontario | Canada |
|---|---|---|---|
| Public protected areas within 10 km | 20 | 4 | 4 |
| Protected land within 10 km | 2.2% | 2.3% | 2.3% |
Canadian Protected and Conserved Areas Database (CPCAD), OpenStreetMap routes and beaches
Everything we know about Trillium Industrial Park
Doon Heritage Village and 19 more in and around Trillium Industrial Park
Sights in Trillium Industrial Park and close by, ordered by how widely each is known.
 MuseumDoon Heritage Villagein town · 80K visitors a year
 MuseumTHEMUSEUM2.6 km outside town, to the northwest
 Ski hillChicopee Ski Club1.2 km outside town, to the northeast
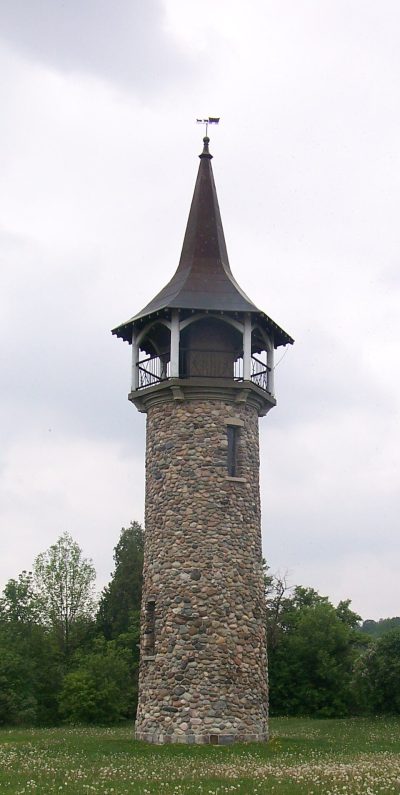 National historic site · Parks CanadaWaterloo Pioneer Memorial Tower1 km outside town, to the east
 MuseumHomer Watson House1.2 km outside town, to the southeast
 MuseumJoseph Schneider Haus2.1 km outside town, to the northwest
Photos: each place’s Wikidata image, from Wikimedia Commons under the licence below (our copy, resized).
Photo credits (6)
- Doon Heritage Village: Pcorb, CC BY-SA 3.0, Wikimedia Commons
- THEMUSEUM: Illustratedjc, CC BY-SA 3.0, Wikimedia Commons
- Chicopee Ski Club: Beowulf cam at English Wikipedia, Public domain, Wikimedia Commons
- Waterloo Pioneer Memorial Tower: Original photograph: Sarah Pidcock; derivative work: Mindmatrix, CC BY-SA 3.0, Wikimedia Commons
- Homer Watson House: Matt Deres, CC BY-SA 3.0, Wikimedia Commons
- Joseph Schneider Haus: Yoho2001, CC BY-SA 3.0, Wikimedia Commons
Famous people from around Trillium Industrial Park
No notable person born in Trillium Industrial Park is on our list; these were born in the towns around it.


Photo credits
Moses Springer: Notman & Fraser, Public domain · Phoebe Amelia Watson: Unknown author, Public domain · Hilda Ranscombe: Preston Rivulettes, Public domain
About Trillium Industrial Park
Neighbourhood in Kitchener
Census areas put together by TownRatings make up Trillium Industrial Park, one part of Kitchener; the city’s map or OpenStreetMap gives it its name.
Statistics Canada: population estimates 2025 (17-10-0155), Census of Population 2021, 2021 census boundaries.
- Population
- 3,420 (people, 2021 estimate)
- Province or territory
- Ontario
- City
- Kitchener
- Census subdivision
- 3530013
Trillium Industrial Park’s neighbours
The nearest places of 1,000 or more. Statistics Canada
| Town | People | km | Overall | Cost | Safety | Health |
|---|---|---|---|---|---|---|
| Trillium Industrial Park | 3,420 | — | B− | D− | C+ | A |
| Country Hills | 4,561 | 1.1 | B− | D− | C+ | A |
| Vanier | 15,686 | 1.3 | C+ | D− | C+ | A |
| Alpine | 3,055 | 1.8 | B− | D− | C+ | A |
| Country Hills West | 5,936 | 2.6 | B+ | D | C+ | A |
| Pioneer Park | 8,781 | 2.8 | B | D− | C+ | A |
| Centreville Chicopee | 10,291 | 2.8 | B− | D− | C+ | A |
People: Statistics Canada, Census 2021. Distances: centre to centre.
Sources: Statistics Canada, Census of Population 2021 · population estimates 2025 (17-10-0155) and 2021 census boundaries · Uniform Crime Reporting Survey 2023–25 (35-10-0026, 35-10-0183 to 35-10-0190) · CMHC rents as published by Statistics Canada (34-10-0133) · grades by TownRatings. Under the Statistics Canada Open Licence.
Adapted from Statistics Canada (Census of Population 2021, population estimates 2025, 2021 census boundaries) under the Statistics Canada Open Licence; this does not constitute an endorsement by Statistics Canada. Neighbourhood names in some cities © OpenStreetMap contributors (ODbL).