Home › Canada › Ontario › Kitchener Canada Find your neighbourhood in Kitchener Its 37 neighbourhoods each have a page here. With 16,857 residents, Laurentian West is the biggest. The 2025 estimate puts Kitchener 26.1% above its 2021 census count. Bridgeport North has the best overall grade of the city’s neighbourhoods, #335 of 2,556 nationally. Against the rest of the country, the typical neighbourhood in the city does best on health and least well on cost of living. In all, 3 neighbourhoods in the city earn an A grade overall. Bottom of the city’s neighbourhoods is Cedar Hill, #1,701 among 2,556 nationally. The middle of the city’s graded neighbourhoods is Mt. Hope Huron Park, #1,151 of 2,556 nationally.
37 graded towns
37 neighbourhoods
Laurentian West largest · 16,857
The finder Find a town that’s… In national order: each neighbourhood is ranked in its province and across the country, not within the city.
37 towns · in national order
#335 in Canada A− Town · 2,858 people
Strongest A Jobs & incomeA HealthLowest D Walkability
#345 in Canada A− Town · 4,122 people
Strongest A HealthA− Hazard riskLowest C+ Safety
#359 in Canada A− Town · 10,723 people
Strongest A HealthA Jobs & incomeLowest C Cost of living
#573 in Canada B+ Town · 5,005 people
Strongest A HealthA− Jobs & incomeLowest C Cost of living
#660 in Canada B+ Town · 3,823 people
Strongest A Jobs & incomeA HealthLowest C− Cost of living
#728 in Canada B+ Town · 5,555 people
Strongest A HealthA− Hazard riskLowest C− Cost of living
#780 in Canada B+ Town · 15,044 people
Strongest A HealthA− Hazard riskLowest C Cost of living
#785 in Canada B+ Town · 5,936 people
Strongest A HealthA− Hazard riskLowest D Cost of living
#803 in Canada B+ Town · 5,048 people
Strongest A+ WalkabilityA HealthLowest D− Cost of living
#812 in Canada B+ Town · 12,476 people
Strongest A HealthA− Hazard riskLowest C− Cost of living
#838 in Canada B+ Town · 14,369 people
Strongest A HealthA− Hazard riskLowest C− Cost of living
#923 in Canada B Town · 16,857 people
Strongest A HealthA− Hazard riskLowest C− Cost of living
#960 in Canada B Town · 3,903 people
Strongest A HealthA− Hazard riskLowest D− Cost of living
#1,030 in Canada B Town · 9,831 people
Strongest A HealthA− Hazard riskLowest C− Cost of living
#1,046 in Canada B Town · 2,581 people
Strongest A+ WalkabilityA HealthLowest D Cost of living
#1,116 in Canada B Town · 8,781 people
Strongest A HealthA WalkabilityLowest D− Cost of living
#1,136 in Canada B Town · 6,169 people
Strongest A HealthA WalkabilityLowest D− Cost of living
#1,140 in Canada B Town · 3,918 people
Strongest A HealthA WalkabilityLowest D− Cost of living
#1,151 in Canada B Town · 5,174 people
Strongest A+ WalkabilityA HealthLowest D− Cost of living
#1,159 in Canada B Town · 5,895 people
Strongest A+ WalkabilityA HealthLowest D− Cost of living
#1,183 in Canada B− Town · 3,497 people
Strongest A HealthA− Hazard riskLowest D− Cost of living
#1,227 in Canada B− Town · 5,760 people
Strongest A+ WalkabilityA HealthLowest D− Cost of living
#1,230 in Canada B− Town · 3,055 people
Strongest A WalkabilityA HealthLowest D− Cost of living
#1,256 in Canada B− Town · 10,291 people
Strongest A HealthA WalkabilityLowest D− Cost of living
#1,279 in Canada B− Town · 5,007 people
Strongest A WalkabilityA HealthLowest D− Cost of living
#1,306 in Canada B− Town · 6,304 people
Strongest A+ WalkabilityA HealthLowest D− Cost of living
#1,333 in Canada B− Town · 6,369 people
Strongest A HealthA WalkabilityLowest D− Cost of living
#1,354 in Canada B− Town · 4,561 people
Strongest A HealthA WalkabilityLowest D− Cost of living
#1,359 in Canada B− Town · 8,721 people
Strongest A HealthA− Hazard riskLowest D− Cost of living
#1,428 in Canada B− Town · 10,026 people
Strongest A HealthA− WalkabilityLowest D− Cost of living
#1,451 in Canada B− Town · 10,760 people
Strongest A+ WalkabilityA HealthLowest D− Cost of living
#1,454 in Canada B− Town · 3,574 people
Strongest A+ WalkabilityA HealthLowest D− Cost of living
#1,461 in Canada B− Town · 3,420 people
Strongest A HealthA− Hazard riskLowest D− Cost of living
#1,485 in Canada B− Town · 3,319 people
Strongest A+ WalkabilityA HealthLowest D− Cost of living
#1,538 in Canada C+ Town · 15,686 people
Strongest A+ WalkabilityA HealthLowest D− Cost of living
#1,698 in Canada C+ Town · 5,277 people
Strongest A HealthA WalkabilityLowest D− Cost of living
#1,701 in Canada C+ Town · 3,190 people
Strongest A+ WalkabilityA HealthLowest D− Cost of living
Show all 37 towns Dots: each town’s overall grade, sized by population. Labels: the top five.
Rankings Kitchener’s neighbourhoods, list by list Bridgeport North is first on 7 of the 14 lists that rank the neighbourhoods in Kitchener.
Questions about Kitchener How do the biggest towns in Kitchener grade? Laurentian West grades B overall, with its best grade in health. Next in size, Vanier grades C+, best in walkability.
Is every town in Kitchener on TownRatings? Yes: every neighbourhood of Kitchener has its page, listed here.
Why isn’t my town ranked? Neighbourhoods are ranked in their province and nationally, not against each other within the city.
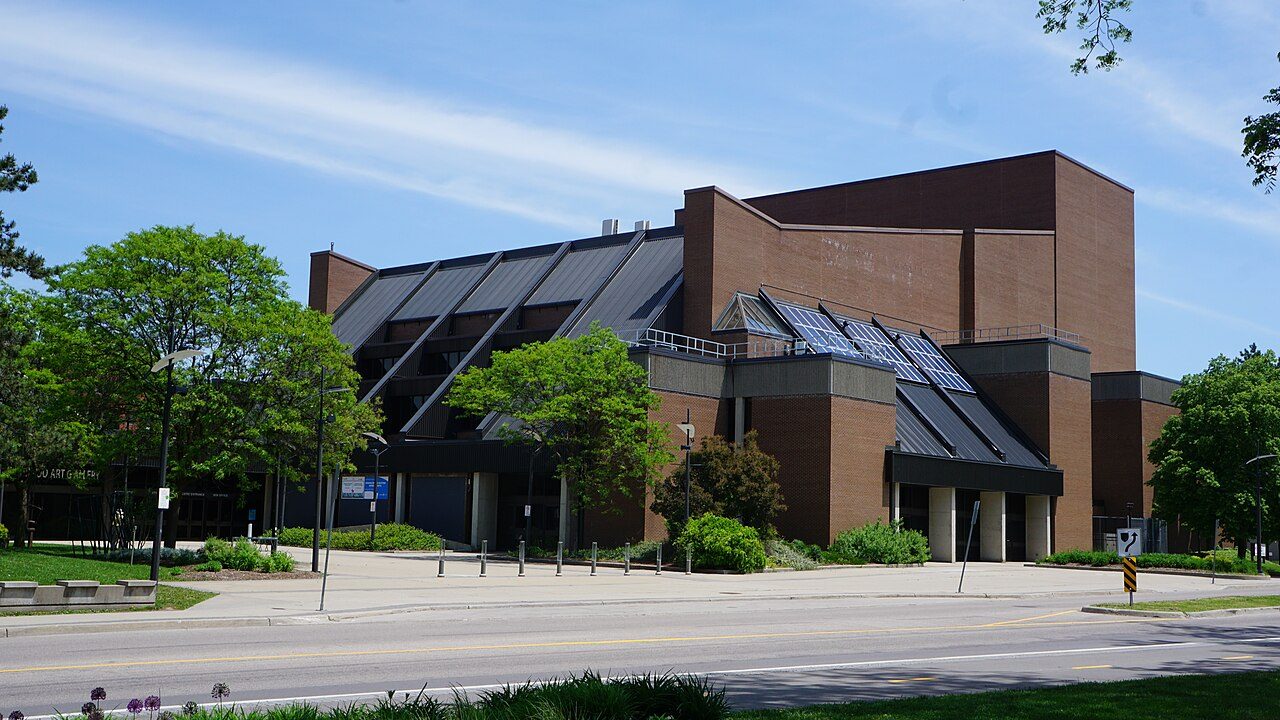
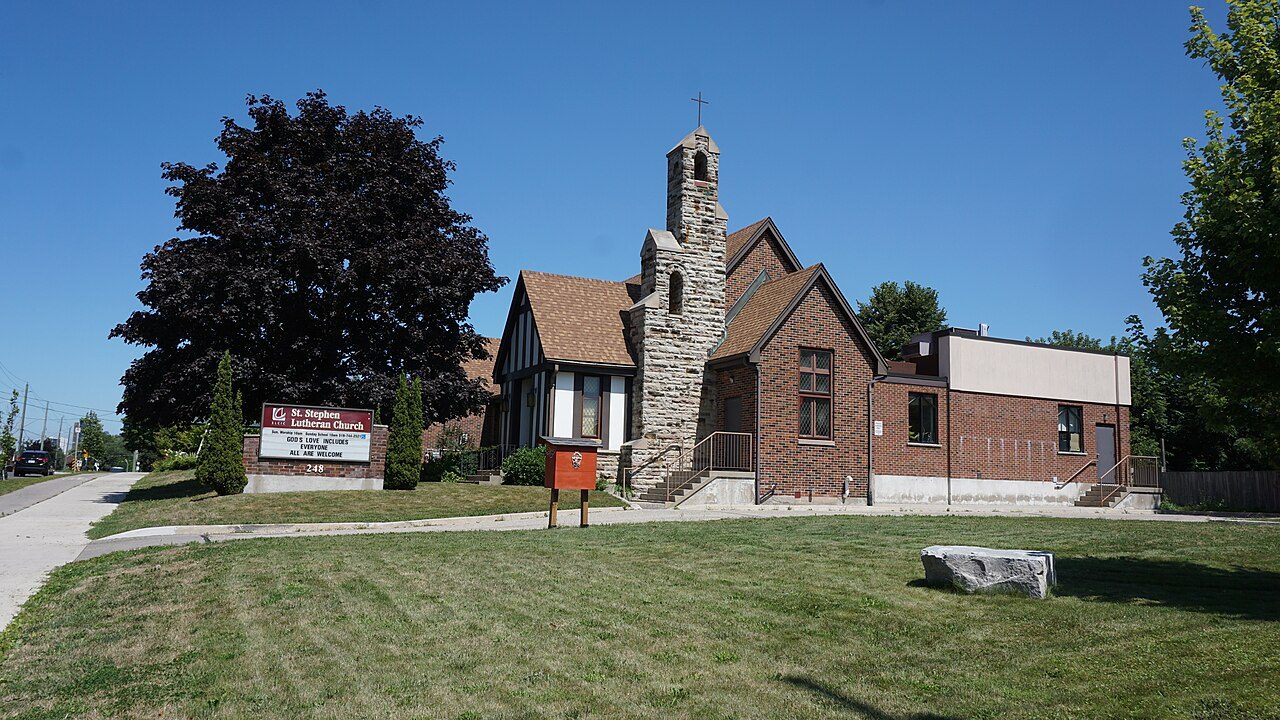
Photos: Bridgeport North, Liam Quinn from Canada (CC BY-SA 2.0 ) · Pioneer Tower West, Earth Science and Remote Sensing Unit , Lyndon B. Johnson S… (Public domain ) · Grand River North, JFVoll (CC BY-SA 4.0 ) · Doon South, JFVoll (CC BY-SA 4.0 ) · Country Hills West, JFVoll (CC BY-SA 4.0 ) · Highland West, Ryan Hodnett (CC BY-SA 4.0 ) · Forest Heights, JFVoll (CC BY-SA 4.0 ) · Bridgeport East, JFVoll (CC BY-SA 4.0 ) · Rosenberg, Michael Hiemstra from Canada (CC BY 2.0 ) · City Commercial Core, JFVoll (CC BY-SA 3.0 ) · Pioneer Park, A J Butler (CC BY 3.0 ) · Auditorium, JFVoll (CC BY-SA 4.0 ) · Mt. Hope Huron Park, JFVoll (CC BY-SA 4.0 ) · Central Frederick, JFVoll (CC BY-SA 4.0 ) · Fairfield, Jason F. Voll (CC BY-SA 3.0 ) · Centreville Chicopee, Francine Pallister (CC BY-SA 3.0 ) · Meinzinger Park-Lakeside, JFVoll (CC BY-SA 4.0 ) · Cherry Hill, JFVoll (CC BY-SA 3.0 ) · Stanley Park, JFVoll (CC BY-SA 3.0 ) · Victoria Hills, Ryan Hodnett (CC BY-SA 4.0 ) · Victoria Park, Sam Nabi (CC BY-SA 4.0 ) · Mill Courtland Woodside Park, JFVoll (CC BY-SA 3.0 ) · Vanier, JFVoll (CC BY-SA 4.0 ) · Southdale, JFVoll (CC BY-SA 3.0 ) · Cedar Hill, Julius177 (CC BY-SA 4.0 ), via Wikimedia Commons.
Sources: TownRatings grades: our own summary of the data, ranking Canadian towns against each other only, run #73 of 10 November 2026 · Statistics Canada, 2021 Census of Population and population estimates. Under the Statistics Canada Open Licence.
Adapted from Statistics Canada (Census of Population 2021, population estimates 2025, 2021 census boundaries) under the Statistics Canada Open Licence; this does not constitute an endorsement by Statistics Canada. Neighbourhood names in some cities © OpenStreetMap contributors (ODbL).