Guest, Sign inJoin
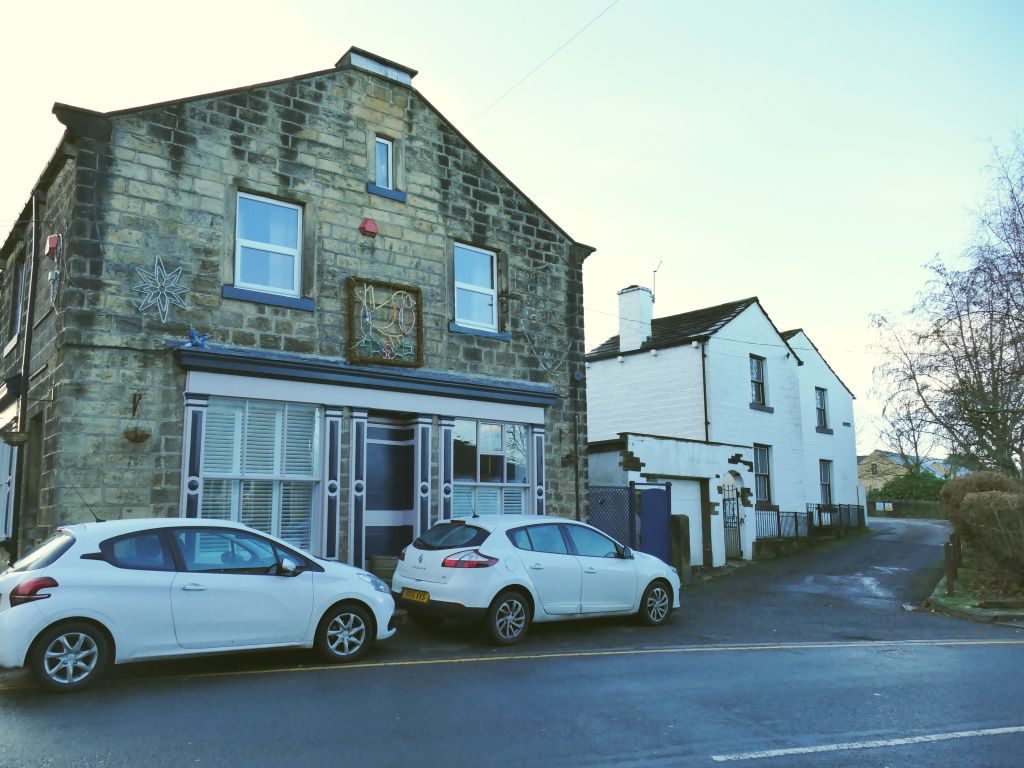
Ripponden - 53034589976Ripponden, #1 on this list · Photo: Tim Green · CC BY 2.0
West Yorkshire rankings · Small towns

Best small towns in West Yorkshire

Ripponden ranks first of 54 small towns of 2,500 to 9,999 residents in West Yorkshire, with an A+. 12 of the 54 grade A− or better.

The overall score, among towns of 2,500 to 9,999; the letter is the same UK grade every town gets. The rank across England, Wales and Northern Ireland sits beside each letter. How grades work

#1

Ripponden

4,775 people
A+

Score 72.7·#55 of 1,289 in England, Wales and Northern Ireland

Strongest: health A, schools A·lowest: walkability C+
#2
A+

Score 71.2·#74 of 1,289 in England, Wales and Northern Ireland

Strongest: schools A+, jobs & income A+·lowest: cost of living C−

#3

Shepley

2,515 people
A

Score 69.1·#112 of 1,289 in England, Wales and Northern Ireland

Strongest: jobs & income A, safety A·lowest: walkability C

All 54 towns, ranked

By overall score; the letter is the same UK grade as on each town’s page. Each rank across England, Wales and Northern Ireland links to the national list. The score (0–100) blends the seven livability grades and sets the order; the letter places that score among UK towns of 2,500+, and A+ is the top 5%, so neighbours on the list often share a letter.

Every town in West Yorkshire →

54 towns.

#TownScoreGrade · UK rankWhat drives it
1Ripponden4,775 people72.7top 3.6%A+#55 of 1,289 nationallyStrongest: health A, schools A·lowest: walkability C+
2Burley in Wharfedale6,806 people71.2top 4.8%A+#74 of 1,289 nationallyStrongest: schools A+, jobs & income A+·lowest: cost of living C−
3Shepley2,515 people69.1top 7.5%A#112 of 1,289 nationallyStrongest: jobs & income A, safety A·lowest: walkability C
4Addingham3,247 people68.2top 8.7%A#128 of 1,289 nationallyStrongest: schools A+, health A+·lowest: hazard risk D
5Shelley2,696 people67.5top 9.6%A#140 of 1,289 nationallyStrongest: jobs & income A, safety A·lowest: walkability D
6Menston5,905 people67.4top 9.8%A#144 of 1,289 nationallyStrongest: jobs & income A+, health A+·lowest: cost of living D
7Marsden3,691 people62.3top 17.3%A−#262 of 1,289 nationallyStrongest: schools A, cost of living A−·lowest: hazard risk C−
8Kirkburton4,033 people61.8top 18.4%A−#278 of 1,289 nationallyStrongest: jobs & income A−, health B+·lowest: walkability C
9Boston Spa6,358 people61.0top 20.8%A−#312 of 1,289 nationallyStrongest: schools A, health A·lowest: cost of living D
10Denby Dale2,734 people60.5top 21.9%A−#325 of 1,289 nationallyStrongest: schools B+, jobs & income B+·lowest: hazard risk C−
11Holmfirth4,982 people59.6top 23.5%A−#348 of 1,289 nationallyStrongest: health A, schools A−·lowest: hazard risk C
12Bramhope3,593 people58.8top 24.9%A−#370 of 1,289 nationallyStrongest: health A+, jobs & income A·lowest: cost of living D−
13Rawdon6,738 people58.4top 25.7%B+#381 of 1,289 nationallyStrongest: jobs & income A+, health A·lowest: cost of living D
14Calverley3,988 people57.6top 27.3%B+#403 of 1,289 nationallyStrongest: jobs & income A+, health A−·lowest: cost of living C−
15Lepton4,950 people57.2top 28.0%B+#412 of 1,289 nationallyStrongest: cost of living B+, hazard risk B+·lowest: walkability C−
16Shelf and Northowram9,191 people55.9top 30.6%B+#450 of 1,289 nationallyStrongest: jobs & income A−, cost of living A−·lowest: schools C
17Holywell Green and Stainland2,799 people55.8top 31.0%B+#458 of 1,289 nationallyStrongest: cost of living A−, schools A−·lowest: health C
18Steeton5,019 people54.4top 34.4%B+#513 of 1,289 nationallyStrongest: walkability A, jobs & income A−·lowest: safety D
19Clayton West and Scissett4,382 people53.0top 36.6%B#542 of 1,289 nationallyStrongest: schools B+, jobs & income B+·lowest: hazard risk D
20Walton3,266 people52.6top 37.4%B#555 of 1,289 nationallyStrongest: hazard risk B+, safety B·lowest: cost of living C
21Linthwaite and Slaithwaite9,242 people52.2top 38.5%B#569 of 1,289 nationallyStrongest: cost of living A−, schools A−·lowest: safety C−
22Hebden Bridge5,230 people52.1top 38.7%B#574 of 1,289 nationallyStrongest: walkability A+, schools B·lowest: hazard risk D−
23Ackworth Moor Top6,275 people52.1top 38.8%B#575 of 1,289 nationallyStrongest: health A−, jobs & income B+·lowest: walkability C−
24Lofthouse and Robin Hood4,187 people51.4top 39.9%B#593 of 1,289 nationallyStrongest: hazard risk A, jobs & income A·lowest: health C
25Silsden8,392 people50.8top 41.2%B#611 of 1,289 nationallyStrongest: walkability B+, cost of living B·lowest: hazard risk C−
26Wilsden3,749 people50.7top 41.5%B#616 of 1,289 nationallyStrongest: jobs & income B+, cost of living B·lowest: walkability C
27Crofton6,127 people50.3top 42.3%B#624 of 1,289 nationallyStrongest: hazard risk A, schools B+·lowest: walkability C+
28Skelmanthorpe4,458 people49.7top 43.9%B#646 of 1,289 nationallyStrongest: schools B+, cost of living B·lowest: safety C+
29Kirkheaton3,492 people49.7top 43.9%B#647 of 1,289 nationallyStrongest: hazard risk A, cost of living A−·lowest: schools C−
30Crigglestone and Durkar6,672 people49.4top 44.4%B#652 of 1,289 nationallyStrongest: jobs & income A−, hazard risk B+·lowest: walkability C−
31Mytholmroyd3,852 people48.2top 47.2%B−#690 of 1,289 nationallyStrongest: walkability A, cost of living A−·lowest: hazard risk D−
32Haworth5,680 people48.0top 47.5%B−#697 of 1,289 nationallyStrongest: cost of living A−, walkability B·lowest: safety C−
33Mickletown3,362 people47.3top 49.2%B−#716 of 1,289 nationallyStrongest: jobs & income A−, schools B·lowest: health C−
34Netherton (Kirklees)3,151 people47.1top 49.6%B−#721 of 1,289 nationallyStrongest: cost of living B+, walkability B·lowest: health C+
35Meltham8,325 people46.6bottom 49.1%B−#737 of 1,289 nationallyStrongest: hazard risk B, cost of living B·lowest: safety C
36Horbury9,868 people45.9bottom 47.6%B−#756 of 1,289 nationallyStrongest: schools A−, cost of living B+·lowest: safety D
37Swillington3,077 people44.9bottom 45.1%B−#788 of 1,289 nationallyStrongest: hazard risk A, schools B·lowest: safety C
38Gildersome6,278 people44.3bottom 43.4%C+#808 of 1,289 nationallyStrongest: hazard risk A, schools B·lowest: safety C
39Oakworth3,688 people44.1bottom 43.0%C+#813 of 1,289 nationallyStrongest: cost of living A−, jobs & income B·lowest: schools D
40Drighlington5,280 people43.6bottom 41.9%C+#825 of 1,289 nationallyStrongest: hazard risk A, jobs & income B+·lowest: safety C−
41Queensbury9,707 people43.4bottom 41.3%C+#830 of 1,289 nationallyStrongest: hazard risk A, cost of living A−·lowest: safety C−
42Allerton Bywater6,958 people42.1bottom 38.5%C+#864 of 1,289 nationallyStrongest: schools A−, jobs & income B−·lowest: hazard risk D
43Sowerby Bridge4,483 people41.3bottom 36.7%C+#889 of 1,289 nationallyStrongest: cost of living A, walkability A·lowest: safety D−
44Scholes (near Cleckheaton)2,896 people38.6bottom 30.8%C#956 of 1,289 nationallyStrongest: hazard risk A, cost of living A−·lowest: safety C−
45Knottingley9,516 people38.5bottom 30.6%C#959 of 1,289 nationallyStrongest: walkability A−, schools A−·lowest: safety D−
46Thornton5,410 people38.0bottom 28.9%C#980 of 1,289 nationallyStrongest: hazard risk A, cost of living A·lowest: safety D
47Cullingworth3,096 people37.2bottom 27.1%C#1,002 of 1,289 nationallyStrongest: jobs & income B−, cost of living C+·lowest: hazard risk C−
48Havercroft and Ryhill5,204 people37.1bottom 27.0%C#1,004 of 1,289 nationallyStrongest: cost of living B+, schools B·lowest: jobs & income D
49Holmfield4,150 people35.0bottom 20.8%C−#1,067 of 1,289 nationallyStrongest: cost of living A−, schools B·lowest: safety D−
50Denholme2,960 people34.2bottom 18.8%C−#1,092 of 1,289 nationallyStrongest: hazard risk A, cost of living A−·lowest: safety D−
51Upton6,332 people30.0bottom 10.7%D#1,179 of 1,289 nationallyStrongest: cost of living B+, hazard risk B·lowest: safety D
52Hemsworth9,177 people28.4bottom 7.9%D#1,213 of 1,289 nationallyStrongest: walkability B+, cost of living B·lowest: safety D−
53Fitzwilliam and Kinsley4,993 people23.7bottom 3.2%D−#1,257 of 1,289 nationallyStrongest: walkability B+, cost of living B·lowest: health D−
54South Kirkby8,880 people22.7bottom 2.3%D−#1,268 of 1,289 nationallyStrongest: cost of living B, hazard risk B·lowest: health D−
Quick answers

Questions people ask

What is the best small town to live in West Yorkshire?

Ripponden ranks first of 54 (A+): health (A) and schools (A) are its strongest grades; walkability (C+) is its lowest. Burley in Wharfedale and Shepley follow.

How are these towns ranked?

By the overall grade, which blends seven livability grades (cost of living, safety, schools, health, jobs & income, walkability, flood risk) from public data, each comparing a town with every UK town. How grades work.

Why isn’t my town on this list?

The list covers towns of 2,500 to 9,999 residents with an overall grade. Towns without one are counted above with the reason.

Go deeper

More West Yorkshire lists

Every list ranks the same 2,500+ towns, so a town’s rank means the same thing on each.

All West Yorkshire rankings →
County by county

Best small towns, county by county

Sources: TownRatings grades: our own summary of the data, ranked against UK towns only. All under the Open Government Licence v3.0.

Contains public sector information licensed under the Open Government Licence v3.0. Contains HM Land Registry data © Crown copyright and database right 2026. Contains OS data © Crown copyright and database right 2026 (ONS boundaries). Northern Ireland: Source: NISRA; contains Land & Property Services data and Ordnance Survey of Northern Ireland information, © Crown copyright, licensed under the Open Government Licence v3.0. Scotland: contains National Records of Scotland data, Registers of Scotland data and SEPA data, © Crown copyright / © SEPA 2025, licensed under the Open Government Licence v3.0.