Guest, Sign inJoin
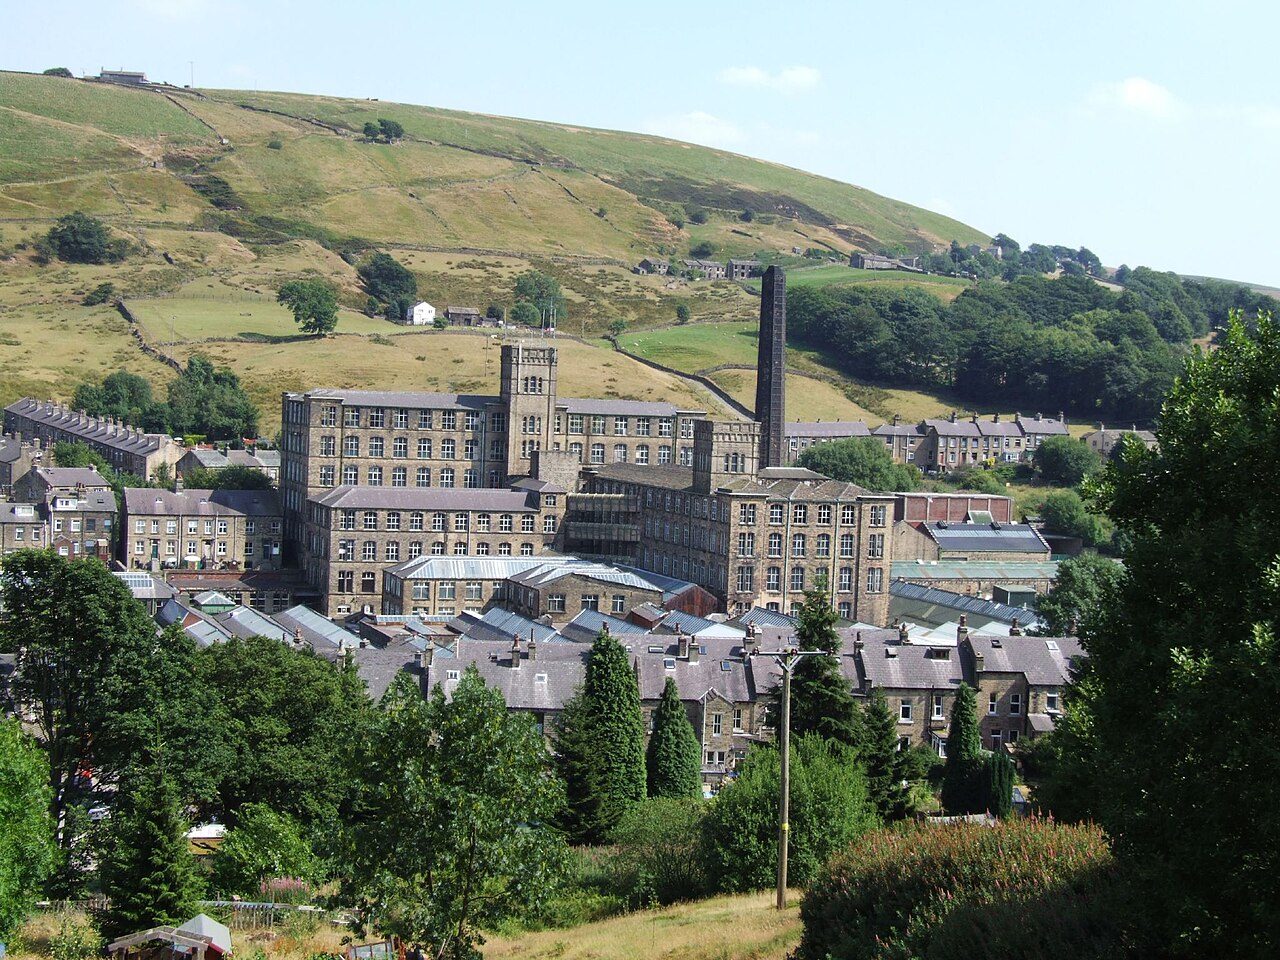
Marsden MillMarsden, #1 on this list · Photo: Andrew Farquhar · CC BY 2.0
West Yorkshire rankings · Climate

Wettest towns in West Yorkshire

Marsden is the wettest of West Yorkshire’s 91 towns of 2,500+: 1,509 mm of rain in a typical year (Met Office, 1991–2020). The typical town here gets 848 mm.

Rain in a typical year, in millimetres. Met Office HadUK-Grid 1991–2020 averages on its 2 km grid, the cells inside each town averaged (contains Met Office data © Crown copyright). A described list: no letters. The rank across England, Scotland, Wales and Northern Ireland sits beside each figure.

#1

Marsden

3,691 people
1,509mm

Rain a year·43 days of 10 mm+·#100 of 2,537 in England, Scotland, Wales and Northern Ireland

#2

Todmorden

12,971 people
1,412mm

Rain a year·44 days of 10 mm+·#131 of 2,537 in England, Scotland, Wales and Northern Ireland

#3

Meltham

8,325 people
1,284mm

Rain a year·43 days of 10 mm+·#196 of 2,537 in England, Scotland, Wales and Northern Ireland

All 91 towns, ranked

Rain a year, highest first. Towns smaller than a 2 km cell share its figures. Towns with the same figure share a rank (T = tied). Each rank across England, Scotland, Wales and Northern Ireland links to the national list.

Every town in West Yorkshire →

91 towns.

#TownRain a yearDays 10 mm+UK rank
1Marsden3,691 people1,509 mm43#100 of 2,537 nationally
2Todmorden12,971 people1,412 mm44#131 of 2,537 nationally
3Meltham8,325 people1,284 mm43#196 of 2,537 nationally
5Ripponden4,775 people1,265 mm40#208 of 2,537 nationally
6Denholme2,960 people1,252 mm37#218 of 2,537 nationally
7Queensbury9,707 people1,242 mm34#231 of 2,537 nationally
8Thornton5,410 people1,241 mm33#233 of 2,537 nationally
T9Mytholmroyd3,852 people1,229 mm34#240 of 2,537 nationally
11Holmfirth4,982 people1,208 mm40#262 of 2,537 nationally
12Cullingworth3,096 people1,187 mm34#290 of 2,537 nationally
13Honley14,399 people1,177 mm27#303 of 2,537 nationally
T14Shepley2,515 people1,132 mm27#347 of 2,537 nationally
16Elland15,788 people1,129 mm26#355 of 2,537 nationally
T17Haworth5,680 people1,108 mm33#378 of 2,537 nationally
T17Oakworth3,688 people1,108 mm33#378 of 2,537 nationally
20Halifax88,111 people1,035 mm26#512 of 2,537 nationally
21Wilsden3,749 people1,034 mm29#516 of 2,537 nationally
23Addingham3,247 people1,007 mm27#544 of 2,537 nationally
24Huddersfield141,683 people996 mm24#567 of 2,537 nationally
25Ilkley14,852 people962 mm25#624 of 2,537 nationally
26Keighley48,754 people939 mm28#667 of 2,537 nationally
27Brighouse33,159 people938 mm20#668 of 2,537 nationally
28Steeton5,019 people910 mm28#747 of 2,537 nationally
29Bingley21,334 people908 mm22#757 of 2,537 nationally
31Otley14,549 people906 mm21#764 of 2,537 nationally
32Bradford333,968 people903 mm25#769 of 2,537 nationally
T33Denby Dale2,734 people895 mm26#794 of 2,537 nationally
T33Silsden8,392 people895 mm23#794 of 2,537 nationally
38Baildon17,056 people868 mm21#892 of 2,537 nationally
39Menston5,905 people867 mm22#896 of 2,537 nationally
40Shipley29,228 people865 mm21#902 of 2,537 nationally
T41Kirkheaton3,492 people864 mm21#906 of 2,537 nationally
T41Lepton4,950 people864 mm21#906 of 2,537 nationally
43Guiseley12,462 people860 mm18#918 of 2,537 nationally
T45Calverley3,988 people848 mm21#965 of 2,537 nationally
T45Mirfield19,614 people848 mm15#965 of 2,537 nationally
47Pudsey34,853 people847 mm21#970 of 2,537 nationally
48Shelley2,696 people820 mm23#1,082 of 2,537 nationally
52Rawdon6,738 people809 mm20#1,118 of 2,537 nationally
53Yeadon14,273 people808 mm22#1,121 of 2,537 nationally
57Dewsbury63,730 people737 mm16#1,435 of 2,537 nationally
58Morley32,562 people719 mm17#1,540 of 2,537 nationally
60Batley44,494 people713 mm15#1,574 of 2,537 nationally
61Leeds536,262 people712 mm17#1,582 of 2,537 nationally
63Ossett21,854 people702 mm16#1,648 of 2,537 nationally
66Rothwell20,964 people694 mm16#1,711 of 2,537 nationally
68Walton3,266 people682 mm14#1,791 of 2,537 nationally
69Crofton6,127 people681 mm14#1,795 of 2,537 nationally
70Kippax10,299 people678 mm14#1,823 of 2,537 nationally
71Garforth15,148 people677 mm14#1,829 of 2,537 nationally
76Horbury9,868 people664 mm14#1,923 of 2,537 nationally
T79Upton6,332 people649 mm15#2,041 of 2,537 nationally
87Wetherby11,711 people636 mm11#2,135 of 2,537 nationally
Quick answers

Questions people ask

What is the wettest town in West Yorkshire?

Marsden: 1,509 mm of rain in a typical year, the most in December 179 mm. Todmorden and Meltham follow.

How are these towns ranked?

By the rain that falls in a typical year, most first, from the Met Office’s 1991–2020 averages on its 2 km grid: the cells inside the town, or the one nearest its centre for a town smaller than a cell. The figure is the one on each town’s Climate page.

Why isn’t my town on this list?

The list covers West Yorkshire’s towns of 2,500+ with the figure. Smaller places show it on their own pages; every town in West Yorkshire is on the county page.

Go deeper

More West Yorkshire lists

Every list ranks the same 2,500+ towns, so a town’s rank means the same thing on each.

All West Yorkshire rankings →
County by county

Wettest towns, county by county

Sources: . All under the Open Government Licence v3.0.

Contains public sector information licensed under the Open Government Licence v3.0. Contains HM Land Registry data © Crown copyright and database right 2026. Contains OS data © Crown copyright and database right 2026 (ONS boundaries). Northern Ireland: Source: NISRA; contains Land & Property Services data and Ordnance Survey of Northern Ireland information, © Crown copyright, licensed under the Open Government Licence v3.0. Scotland: contains National Records of Scotland data, Registers of Scotland data and SEPA data, © Crown copyright / © SEPA 2025, licensed under the Open Government Licence v3.0.