Guest, Sign inJoin
Edwalton, NottinghamshireEdwalton, #1 on this list · Photo: Simon Cobb · CC0
Nottinghamshire rankings · Income

Towns with the highest household incomes in Nottinghamshire

Edwalton has the highest household incomes of Nottinghamshire’s 49 towns of 2,500+: £74,333 a year before tax, on average (ONS, 2022–23). The typical town here averages £47,298.

ONS small-area income estimates, financial year ending 2023: the mean income of a household before tax (ONS models means, not medians, for small areas), averaged over the town’s neighbourhoods. A described list: no letters. The rank across England and Wales sits beside each figure.

#1

Edwalton

4,762 people
£74,333

Mean household income·£58,623 after tax·#136 of 2,178 in England and Wales
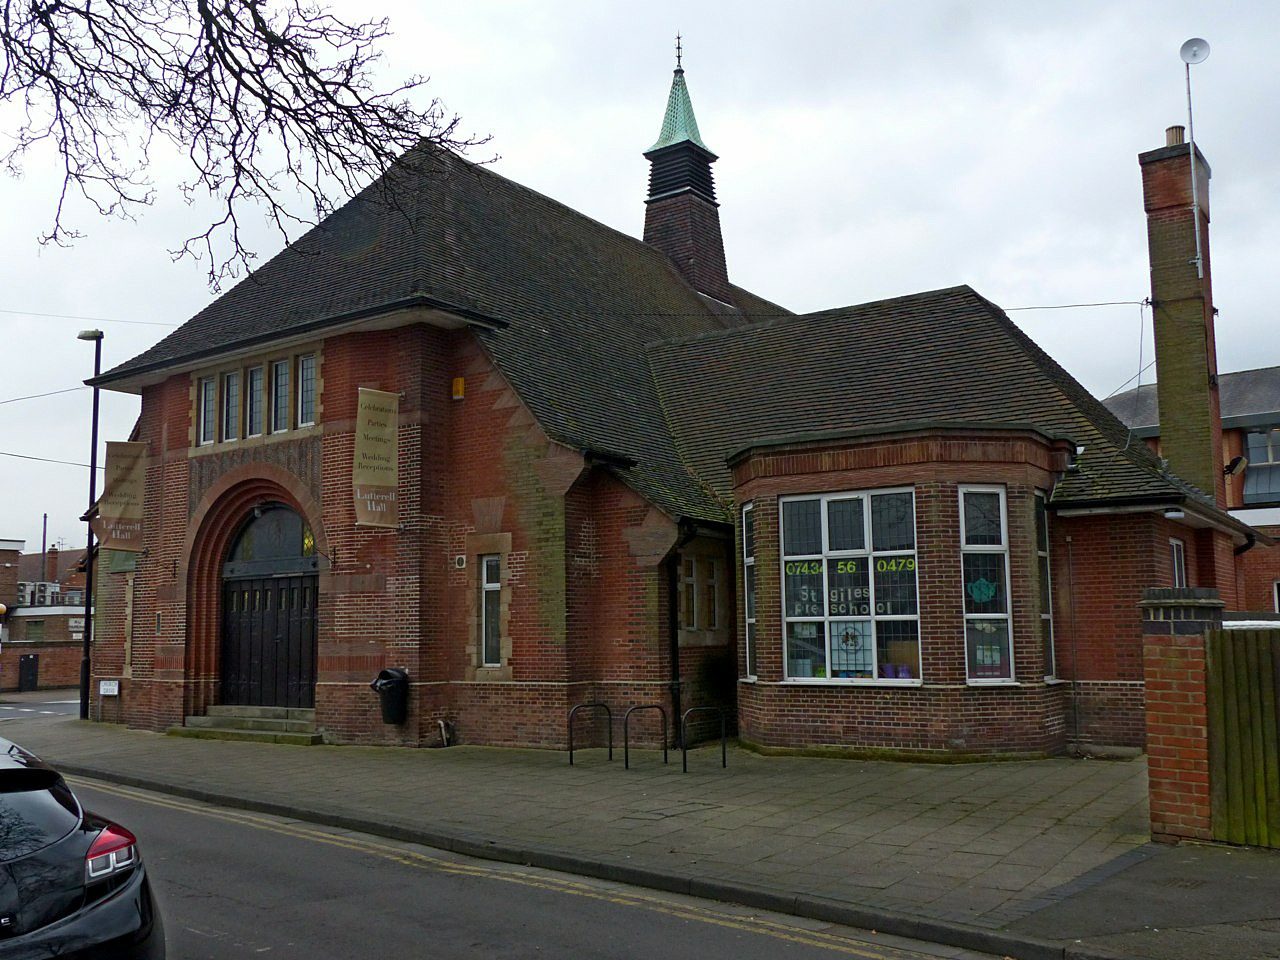
#2

West Bridgford

36,489 people
£69,608

Mean household income·£53,191 after tax·#264 of 2,178 in England and Wales

#3

Ravenshead

5,370 people
£62,285

Mean household income·£52,221 after tax·#543 of 2,178 in England and Wales

All 49 towns, ranked

Mean household income, highest first. Small towns sit inside one ONS area of 5,000 to 15,000 people, so their figure is partly their surroundings’. Towns with the same figure share a rank (T = tied). Each rank across England and Wales links to the national list.

Every town in Nottinghamshire →

49 towns.

#TownMean household incomeAfter taxUK rank
1Edwalton4,762 people£74,333£58,623#136 of 2,178 nationally
2West Bridgford36,489 people£69,608£53,191#264 of 2,178 nationally
3Ravenshead5,370 people£62,285£52,221#543 of 2,178 nationally
4Bingham10,109 people£61,778£50,256#562 of 2,178 nationally
5East Leake8,551 people£61,568£48,263#571 of 2,178 nationally
6Keyworth6,822 people£61,318£50,027#580 of 2,178 nationally
7Southwell7,405 people£60,654£49,516#622 of 2,178 nationally
8Ruddington7,491 people£60,592£47,842#624 of 2,178 nationally
9Radcliffe on Trent7,205 people£60,049£47,423#651 of 2,178 nationally
10Collingham2,870 people£56,225£42,943#846 of 2,178 nationally
11Beeston52,359 people£55,028£41,996#917 of 2,178 nationally
12Cotgrave7,794 people£54,367£43,292#962 of 2,178 nationally
T13Bilsthorpe3,490 people£53,787£43,345#996 of 2,178 nationally
T13Farnsfield3,217 people£53,787£43,345#996 of 2,178 nationally
15Kimberley4,467 people£52,120£39,779#1,108 of 2,178 nationally
16Nuthall and Watnall9,581 people£52,071£39,737#1,111 of 2,178 nationally
17Arnold40,016 people£51,641£38,983#1,154 of 2,178 nationally
18Wilford4,849 people£51,455£40,116#1,168 of 2,178 nationally
19Calverton7,318 people£51,052£42,649#1,196 of 2,178 nationally
20Tuxford2,810 people£51,028£40,045#1,199 of 2,178 nationally
21Balderton12,876 people£50,453£40,018#1,247 of 2,178 nationally
22Edwinstowe5,327 people£48,926£41,076#1,352 of 2,178 nationally
23Carlton53,555 people£48,879£37,370#1,356 of 2,178 nationally
24Stapleford15,041 people£48,479£34,391#1,385 of 2,178 nationally
25Hucknall35,848 people£47,298£36,184#1,471 of 2,178 nationally
26Forest Town19,015 people£46,553£38,460#1,531 of 2,178 nationally
27Nottingham299,786 people£45,873£34,095#1,588 of 2,178 nationally
28Kirkby-in-Ashfield21,262 people£45,538£34,816#1,615 of 2,178 nationally
29Blidworth4,295 people£45,435£36,256#1,623 of 2,178 nationally
30Newark-on-Trent29,755 people£45,170£34,721#1,638 of 2,178 nationally
31Annesley Woodhouse6,162 people£44,997£34,810#1,648 of 2,178 nationally
32Worksop43,435 people£44,682£35,213#1,676 of 2,178 nationally
34Eastwood18,890 people£44,339£34,872#1,705 of 2,178 nationally
35Selston6,278 people£44,093£33,136#1,726 of 2,178 nationally
36Rainworth7,990 people£44,082£34,897#1,727 of 2,178 nationally
37Retford23,735 people£43,940£36,165#1,740 of 2,178 nationally
38Mansfield Woodhouse19,521 people£43,590£34,194#1,771 of 2,178 nationally
40Mansfield63,448 people£42,603£34,691#1,854 of 2,178 nationally
T42Carlton in Lindrick5,460 people£42,336£33,918#1,877 of 2,178 nationally
T42Langold2,603 people£42,336£33,918#1,877 of 2,178 nationally
44Sutton in Ashfield36,435 people£42,208£32,423#1,888 of 2,178 nationally
45Clifton22,936 people£42,099£31,126#1,893 of 2,178 nationally
48Huthwaite5,069 people£40,363£30,440#2,005 of 2,178 nationally
49Market Warsop6,970 people£39,228£33,969#2,061 of 2,178 nationally
Quick answers

Questions people ask

Which town in Nottinghamshire has the highest household income?

Edwalton: its households average £74,333 a year before tax (£58,623 after). West Bridgford and Ravenshead follow.

How are these towns ranked?

By mean household income before tax in ONS’s small-area estimates (April 2022 to March 2023), highest first: each neighbourhood’s figure weighted by its share of the town’s residents.

Why isn’t my town on this list?

The list covers Nottinghamshire’s towns of 2,500+ with the figure. Smaller places show it on their own pages; every town in Nottinghamshire is on the county page.

Go deeper

More Nottinghamshire lists

Every list ranks the same 2,500+ towns, so a town’s rank means the same thing on each.

All Nottinghamshire rankings →
County by county

Towns with the highest household incomes, county by county

Sources: ONS small-area income estimates (financial year ending 2023). All under the Open Government Licence v3.0.

Contains public sector information licensed under the Open Government Licence v3.0. Contains HM Land Registry data © Crown copyright and database right 2026. Contains OS data © Crown copyright and database right 2026 (ONS boundaries). Northern Ireland: Source: NISRA; contains Land & Property Services data and Ordnance Survey of Northern Ireland information, © Crown copyright, licensed under the Open Government Licence v3.0. Scotland: contains National Records of Scotland data, Registers of Scotland data and SEPA data, © Crown copyright / © SEPA 2025, licensed under the Open Government Licence v3.0.