 #1
Wilford
4,849 peopleJanuary low·34 air frosts a year·#603 of 2,537 in England, Scotland, Wales and Northern Ireland
Each edition grades its towns against each other only.
Wilford, #1 on this list · Photo: Alan Murray-Rust · CC BY-SA 2.0Wilford has the mildest winters of Nottinghamshire’s 49 towns of 2,500+: January nights average a low of 2.2°C (Met Office, 1991–2020). The typical town here averages 1.5°C.
The average January low (the coldest month’s nights). Met Office HadUK-Grid 1991–2020 averages on its 2 km grid, the cells inside each town averaged (contains Met Office data © Crown copyright). A described list: no letters. The rank across England, Scotland, Wales and Northern Ireland sits beside each figure.
#1January low·34 air frosts a year·#603 of 2,537 in England, Scotland, Wales and Northern Ireland
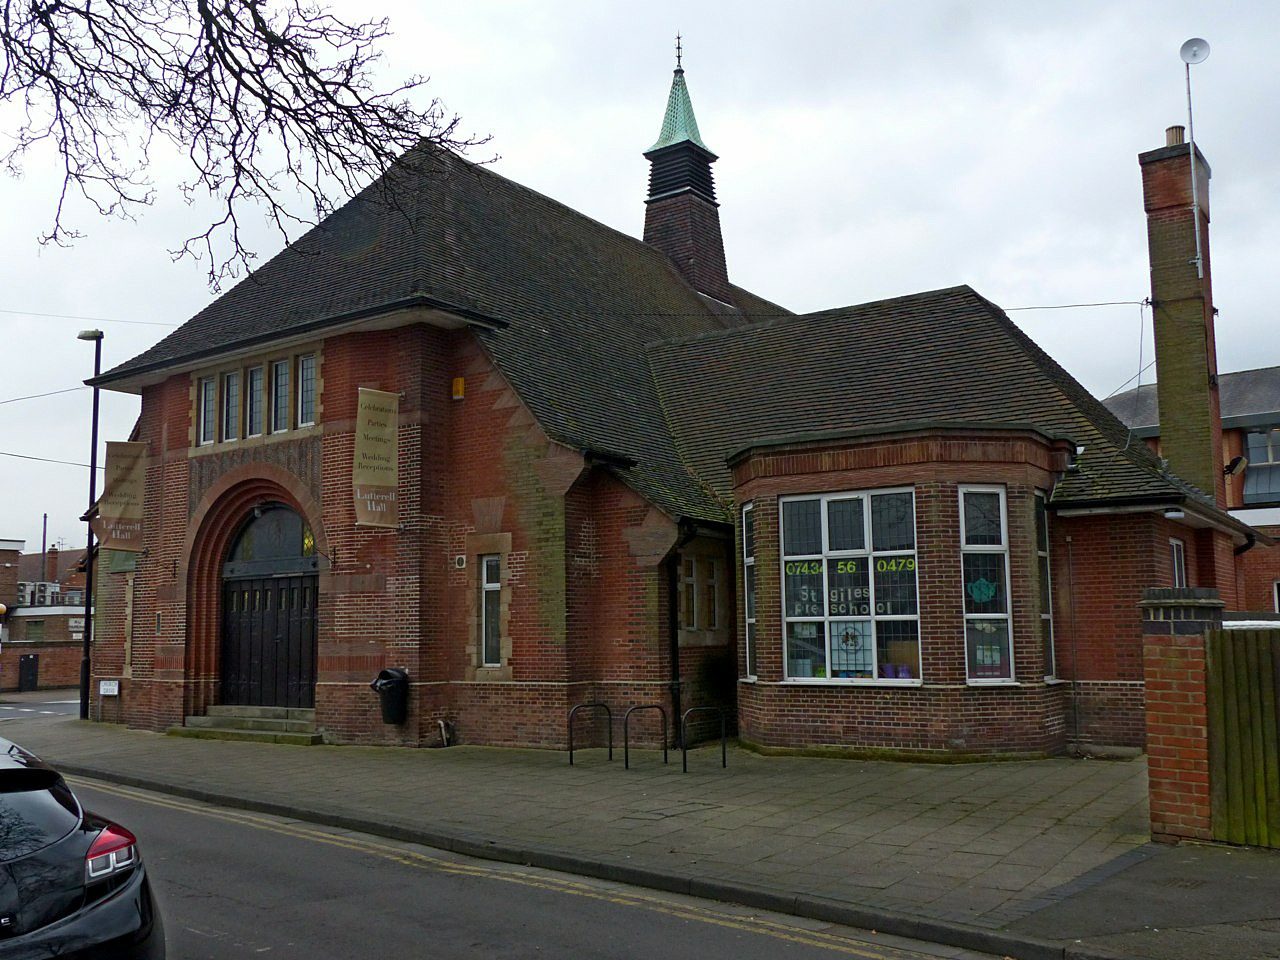 #2
January low·33 air frosts a year·#623 of 2,537 in England, Scotland, Wales and Northern Ireland
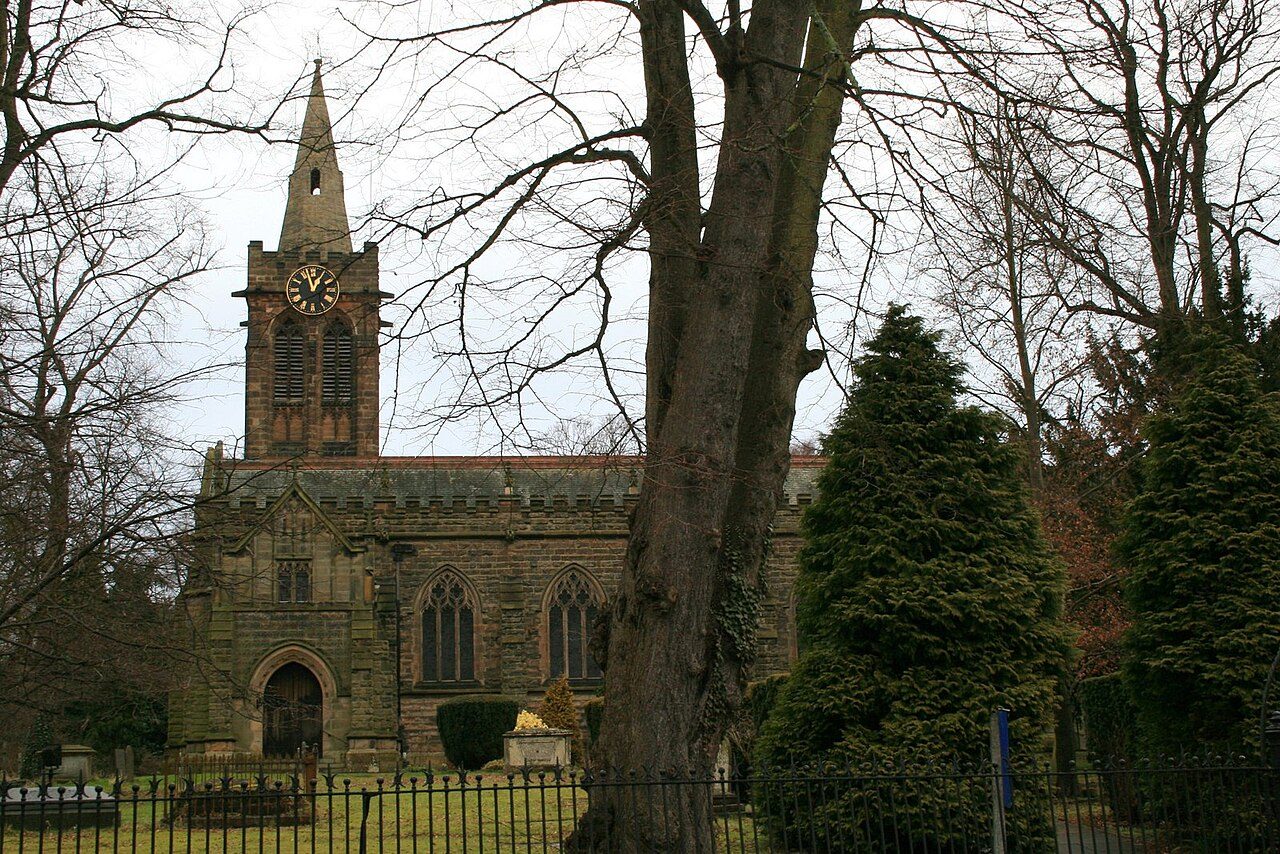 #3
January low·38 air frosts a year·#691 of 2,537 in England, Scotland, Wales and Northern Ireland
January low, highest first. Temperatures are ranked on two decimals and shown to one, so two towns showing the same figure can rank apart; towns smaller than a 2 km cell share its figures. Towns with the same figure share a rank (T = tied). Each rank across England, Scotland, Wales and Northern Ireland links to the national list.
49 towns.
Wilford: January nights average a low of 2.2°C, with 34 air frosts in a typical year. West Bridgford and Ruddington follow.
By the average January low, highest first, from the Met Office’s 1991–2020 averages on its 2 km grid: the cells inside the town, or the one nearest its centre for a town smaller than a cell. The figure is the one on each town’s Climate page.
The list covers Nottinghamshire’s towns of 2,500+ with the figure. Smaller places show it on their own pages; every town in Nottinghamshire is on the county page.
Every list ranks the same 2,500+ towns, so a town’s rank means the same thing on each.
Sources: . All under the Open Government Licence v3.0.
Contains public sector information licensed under the Open Government Licence v3.0. Contains HM Land Registry data © Crown copyright and database right 2026. Contains OS data © Crown copyright and database right 2026 (ONS boundaries). Northern Ireland: Source: NISRA; contains Land & Property Services data and Ordnance Survey of Northern Ireland information, © Crown copyright, licensed under the Open Government Licence v3.0. Scotland: contains National Records of Scotland data, Registers of Scotland data and SEPA data, © Crown copyright / © SEPA 2025, licensed under the Open Government Licence v3.0.