Guest, Sign inJoin
Grand Parade - HookHook, #1 on this list · Photo: Mr Ignavy · CC BY-SA 2.0
Hampshire rankings · Income

Towns with the highest household incomes in Hampshire

Hook has the highest household incomes of Hampshire’s 77 towns of 2,500+: £84,934 a year before tax, on average (ONS, 2022–23). The typical town here averages £64,965.

ONS small-area income estimates, financial year ending 2023: the mean income of a household before tax (ONS models means, not medians, for small areas), averaged over the town’s neighbourhoods. A described list: no letters. The rank across England and Wales sits beside each figure.

#1

Hook

9,062 people
£84,934

Mean household income·£54,706 after tax·#18 of 2,178 in England and Wales
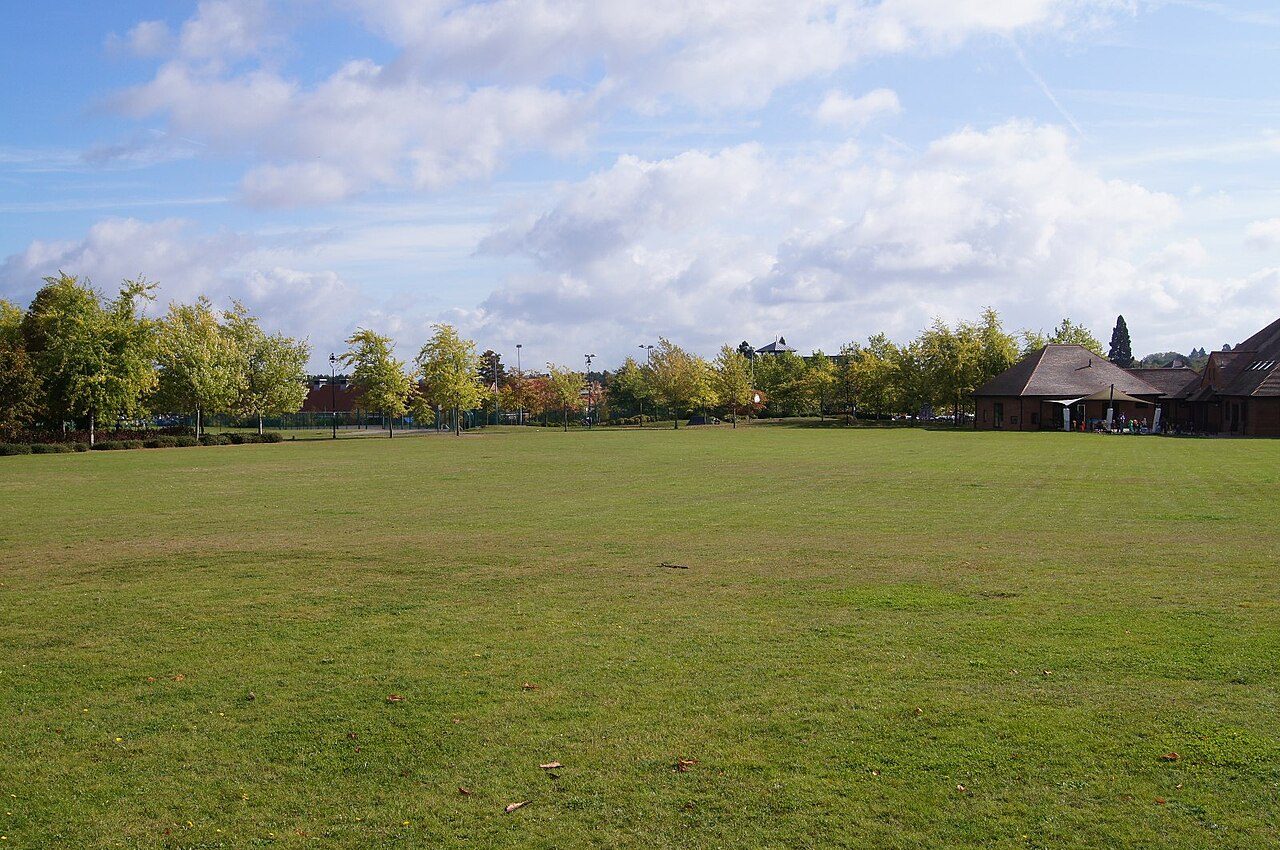
#2

Elvetham Heath

4,916 people
£83,513

Mean household income·£53,817 after tax·#23 of 2,178 in England and Wales
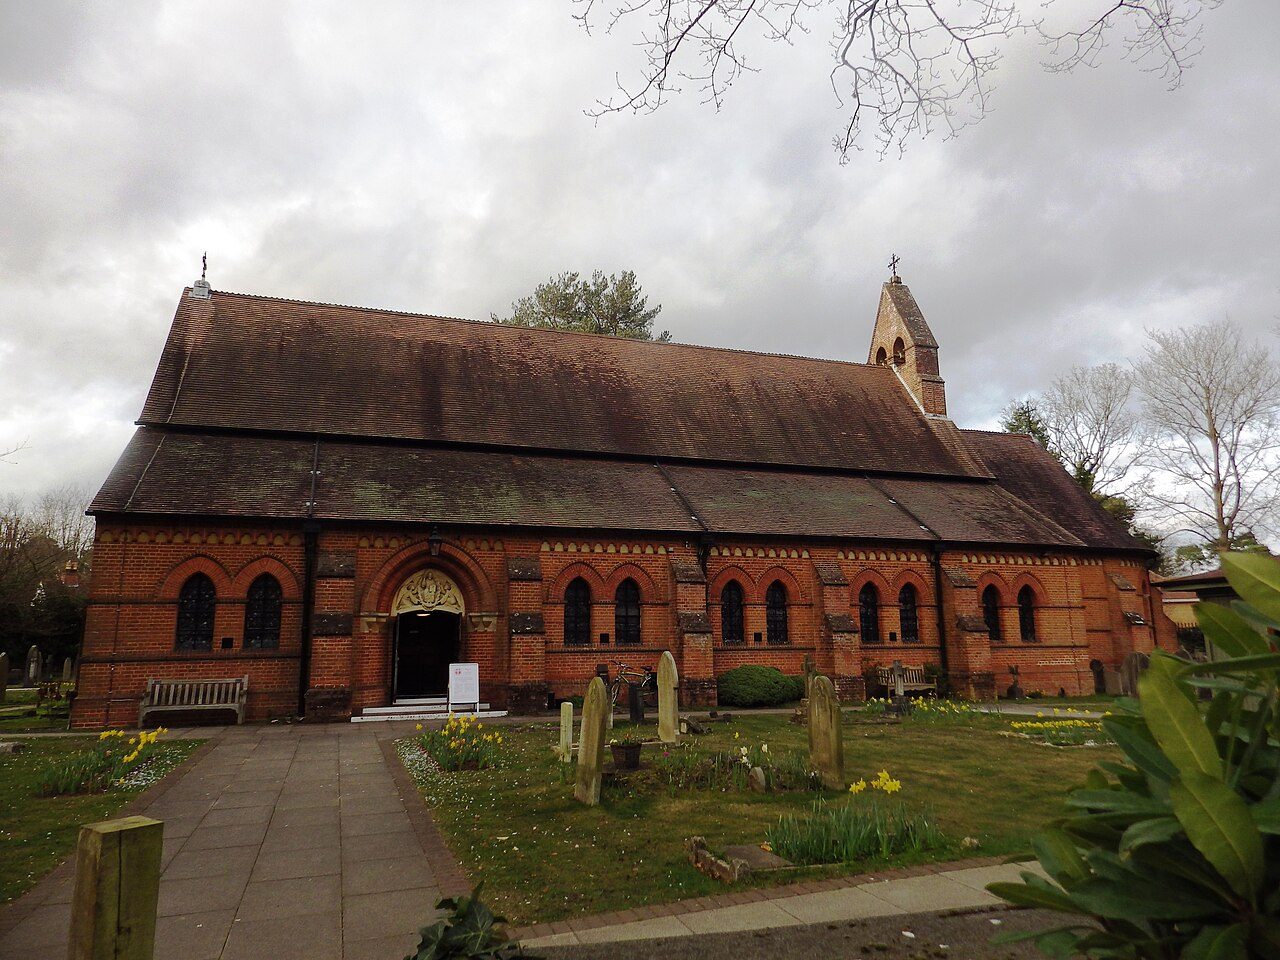
#3

Fleet

37,800 people
£82,088

Mean household income·£54,820 after tax·#28 of 2,178 in England and Wales

All 77 towns, ranked

Mean household income, highest first. Small towns sit inside one ONS area of 5,000 to 15,000 people, so their figure is partly their surroundings’. Towns with the same figure share a rank (T = tied). Each rank across England and Wales links to the national list.

Every town in Hampshire →

77 towns.

#TownMean household incomeAfter taxUK rank
1Hook9,062 people£84,934£54,706#18 of 2,178 nationally
2Elvetham Heath4,916 people£83,513£53,817#23 of 2,178 nationally
3Fleet37,800 people£82,088£54,820#28 of 2,178 nationally
4Hartley Wintney3,465 people£80,672£53,377#36 of 2,178 nationally
5Whiteley9,350 people£78,078£52,594#68 of 2,178 nationally
6Bramley4,730 people£77,722£52,436#76 of 2,178 nationally
7Odiham Garrison town5,091 people£77,718£56,194#77 of 2,178 nationally
8South Wonston2,686 people£77,475£52,513#79 of 2,178 nationally
10Four Marks5,613 people£76,585£52,016#92 of 2,178 nationally
11Overton4,350 people£76,527£52,022#94 of 2,178 nationally
12Swanmore3,113 people£75,667£52,811#112 of 2,178 nationally
13Kingsclere2,889 people£75,642£50,463#113 of 2,178 nationally
14Kings Worthy4,631 people£74,764£53,859#131 of 2,178 nationally
15Botley5,900 people£73,762£50,086#146 of 2,178 nationally
16Colden Common3,827 people£73,291£51,059#156 of 2,178 nationally
17Chandler's Ford31,965 people£72,467£50,116#179 of 2,178 nationally
18Liphook7,128 people£71,429£48,734#207 of 2,178 nationally
T19Blackwater7,170 people£70,933£49,686#218 of 2,178 nationally
T19Hawley2,581 people£70,933£49,686#218 of 2,178 nationally
21Oakley5,264 people£70,738£47,115#226 of 2,178 nationally
22Locks Heath35,744 people£70,396£48,274#240 of 2,178 nationally
23Winchester48,486 people£70,372£48,212#241 of 2,178 nationally
24Whitchurch5,291 people£70,058£48,641#248 of 2,178 nationally
25Yateley14,676 people£69,915£48,116#254 of 2,178 nationally
26Horton Heath3,047 people£69,511£46,346#266 of 2,178 nationally
28Denmead6,509 people£68,883£46,823#281 of 2,178 nationally
29Rowlands Castle2,969 people£68,826£46,005#284 of 2,178 nationally
30Rownhams and Nursling4,796 people£68,426£48,596#298 of 2,178 nationally
31Tadley14,767 people£68,389£47,048#300 of 2,178 nationally
32Bransgore3,688 people£68,371£45,517#301 of 2,178 nationally
33Hedge End23,195 people£67,719£47,253#317 of 2,178 nationally
34Old Basing3,834 people£66,600£46,296#355 of 2,178 nationally
35Bursledon8,072 people£65,106£46,939#412 of 2,178 nationally
36Basingstoke117,211 people£65,103£46,064#413 of 2,178 nationally
37North Baddesley6,996 people£65,057£45,776#416 of 2,178 nationally
38Romsey19,923 people£64,971£45,517#423 of 2,178 nationally
39Hamble-le-Rice4,613 people£64,965£48,731#424 of 2,178 nationally
40Brockenhurst3,484 people£64,549£46,984#441 of 2,178 nationally
41Farnborough60,665 people£64,096£46,551#467 of 2,178 nationally
T42Bishop's Waltham6,957 people£63,379£44,764#498 of 2,178 nationally
T42Waltham Chase2,830 people£63,379£44,764#498 of 2,178 nationally
44Lee-on-the-Solent24,307 people£63,301£45,217#500 of 2,178 nationally
45New Alresford5,340 people£63,047£45,746#506 of 2,178 nationally
46Emsworth11,512 people£63,003£43,573#511 of 2,178 nationally
47Liss4,749 people£62,973£46,088#513 of 2,178 nationally
48Alton17,883 people£62,292£44,529#542 of 2,178 nationally
49Petersfield14,994 people£62,160£44,913#550 of 2,178 nationally
50Bordon9,349 people£61,890£44,837#558 of 2,178 nationally
51Marchwood5,776 people£61,315£43,871#581 of 2,178 nationally
52Fordingbridge4,947 people£61,048£41,924#598 of 2,178 nationally
53Horndean34,046 people£60,869£42,385#610 of 2,178 nationally
54Fareham42,633 people£60,585£42,141#625 of 2,178 nationally
55Andover48,484 people£60,138£42,616#646 of 2,178 nationally
56Whitehill5,178 people£59,342£43,348#681 of 2,178 nationally
57Lindford2,740 people£59,270£43,278#688 of 2,178 nationally
59Eastleigh48,355 people£58,812£42,752#710 of 2,178 nationally
60Milford on Sea4,364 people£58,738£46,728#715 of 2,178 nationally
61West End10,865 people£56,550£41,742#825 of 2,178 nationally
62Aldershot39,827 people£56,518£42,059#826 of 2,178 nationally
63Netley6,309 people£56,075£40,867#853 of 2,178 nationally
64Totton28,093 people£55,646£40,856#885 of 2,178 nationally
65Ringwood12,789 people£55,350£41,254#903 of 2,178 nationally
66Waterlooville34,766 people£55,132£39,651#910 of 2,178 nationally
67Lymington14,870 people£54,768£42,605#935 of 2,178 nationally
68Holbury7,339 people£54,719£39,654#938 of 2,178 nationally
69Gosport70,120 people£54,364£39,606#963 of 2,178 nationally
71Portsmouth223,324 people£53,635£39,731#1,007 of 2,178 nationally
72Southampton249,633 people£52,380£39,984#1,090 of 2,178 nationally
73Barton on Sea6,763 people£50,402£36,038#1,250 of 2,178 nationally
74Havant46,964 people£49,947£37,648#1,275 of 2,178 nationally
75South Hayling15,305 people£48,676£38,316#1,367 of 2,178 nationally
76Ashley7,730 people£47,958£36,558#1,433 of 2,178 nationally
77New Milton11,872 people£46,577£35,700#1,527 of 2,178 nationally
Quick answers

Questions people ask

Which town in Hampshire has the highest household income?

Hook: its households average £84,934 a year before tax (£54,706 after). Elvetham Heath and Fleet follow.

How are these towns ranked?

By mean household income before tax in ONS’s small-area estimates (April 2022 to March 2023), highest first: each neighbourhood’s figure weighted by its share of the town’s residents.

Why isn’t my town on this list?

The list covers Hampshire’s towns of 2,500+ with the figure. Smaller places show it on their own pages; every town in Hampshire is on the county page.

Go deeper

More Hampshire lists

Every list ranks the same 2,500+ towns, so a town’s rank means the same thing on each.

All Hampshire rankings →
County by county

Towns with the highest household incomes, county by county

Sources: ONS small-area income estimates (financial year ending 2023). All under the Open Government Licence v3.0.

Contains public sector information licensed under the Open Government Licence v3.0. Contains HM Land Registry data © Crown copyright and database right 2026. Contains OS data © Crown copyright and database right 2026 (ONS boundaries). Northern Ireland: Source: NISRA; contains Land & Property Services data and Ordnance Survey of Northern Ireland information, © Crown copyright, licensed under the Open Government Licence v3.0. Scotland: contains National Records of Scotland data, Registers of Scotland data and SEPA data, © Crown copyright / © SEPA 2025, licensed under the Open Government Licence v3.0.