Guest, Sign inJoin
Collingham - Vine Farm on High StreetCollingham, #1 on this list · Photo: Dave Bevis · CC BY-SA 2.0
Nottinghamshire rankings · Schools

Towns with the best schools in Nottinghamshire

Collingham ranks first on schools among Nottinghamshire’s 49 towns of 2,500+; 14 of the 49 grade A− or better against UK towns.

The School Grade (England only): Key Stage 2 and GCSE results of the state schools in the town (or within 3 km), weighted by pupils and measured against England’s schools. The rank across England sits beside each letter. How grades work

#1

Collingham

2,870 people
A+

Better than almost every UK town·#3 of 1,973 in England

#2

Southwell

7,405 people
A+

Better than 96% of UK towns·#56 of 1,973 in England
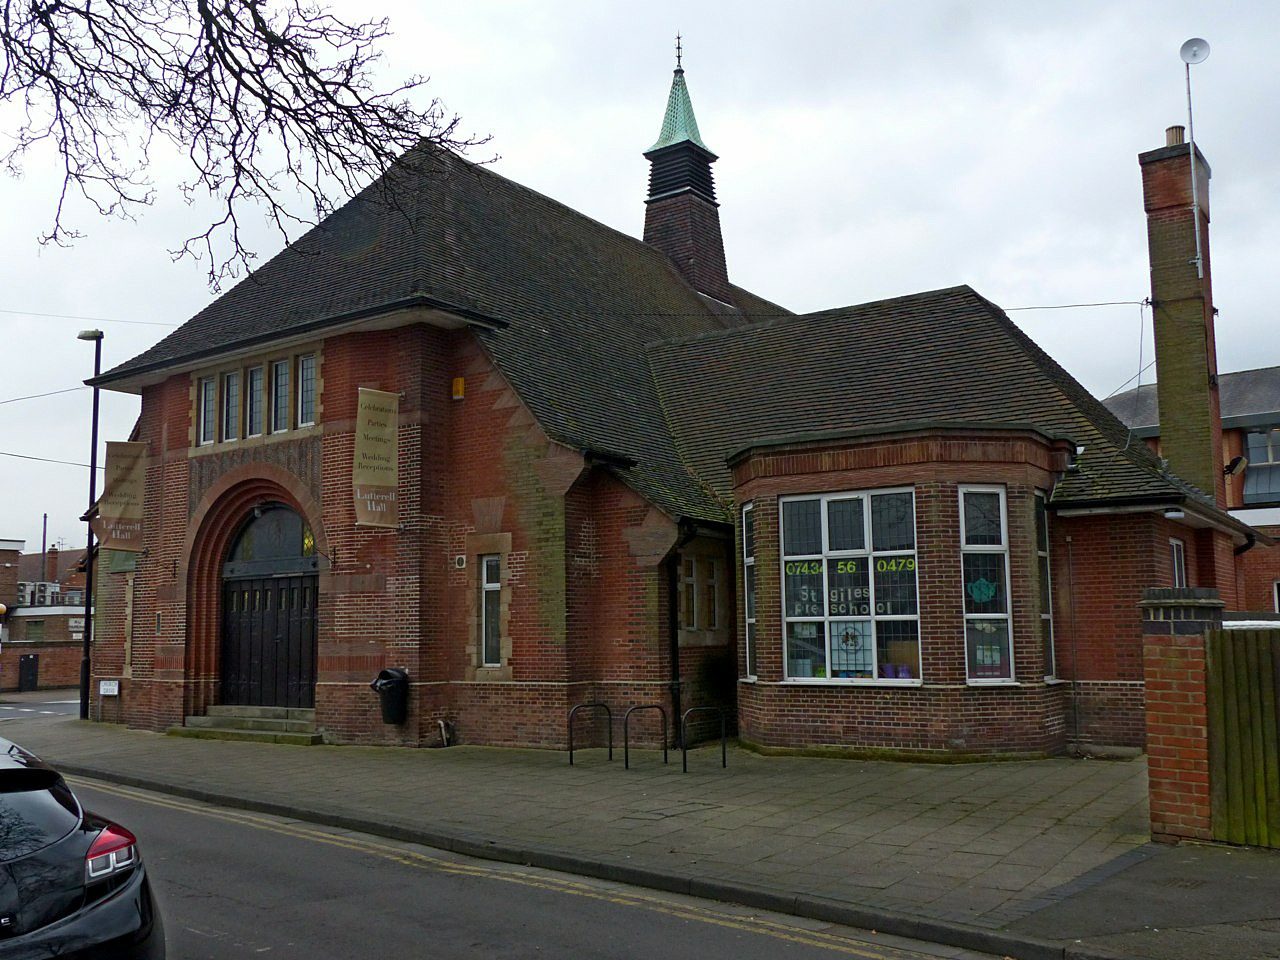
#3

West Bridgford

36,489 people
A+

Better than 96% of UK towns·#60 of 1,973 in England

All 49 towns, ranked

Schools grade, best first; ranks are the county ranks on each town’s page (T = tied). Military garrison towns and university campuses keep their grades but aren’t ranked. Each rank across England links to the national list.

Every town in Nottinghamshire →

49 towns.

#TownGrade · UK rankCompared with UK towns
1Collingham2,870 peopleA+#3 of 1,973 nationallybetter than almost every UK town
2Southwell7,405 peopleA+#56 of 1,973 nationallybetter than 96% of UK towns
3West Bridgford36,489 peopleA+#60 of 1,973 nationallybetter than 96% of UK towns
4Wilford4,849 peopleA+#67 of 1,973 nationallybetter than 95% of UK towns
5Edwalton4,762 peopleA#95 of 1,973 nationallybetter than 94% of UK towns
6Carlton in Lindrick5,460 peopleA#107 of 1,973 nationallybetter than 93% of UK towns
7Ruddington7,491 peopleA#113 of 1,973 nationallybetter than 93% of UK towns
8Bingham10,109 peopleA#151 of 1,973 nationallybetter than 91% of UK towns
9Beeston52,359 peopleA#205 of 1,973 nationallybetter than 88% of UK towns
10Cotgrave7,794 peopleA#217 of 1,973 nationallybetter than 88% of UK towns
T11East Leake8,551 peopleA#266 of 1,973 nationallybetter than 85% of UK towns
T11Radcliffe on Trent7,205 peopleA#266 of 1,973 nationallybetter than 85% of UK towns
13Carlton53,555 peopleA−#292 of 1,973 nationallybetter than 84% of UK towns
14Rainworth7,990 peopleA−#451 of 1,973 nationallybetter than 75% of UK towns
15Harworth and Bircotes8,885 peopleB+#454 of 1,973 nationallybetter than 75% of UK towns
16Keyworth6,822 peopleB+#481 of 1,973 nationallybetter than 73% of UK towns
17Clifton22,936 peopleB+#534 of 1,973 nationallybetter than 71% of UK towns
18Stapleford15,041 peopleB+#561 of 1,973 nationallybetter than 70% of UK towns
19Arnold40,016 peopleB+#602 of 1,973 nationallybetter than 68% of UK towns
20Edwinstowe5,327 peopleB#671 of 1,973 nationallybetter than 64% of UK towns
21Bilsthorpe3,490 peopleB#691 of 1,973 nationallybetter than 63% of UK towns
22Ravenshead5,370 peopleB#723 of 1,973 nationallybetter than 62% of UK towns
23Worksop43,435 peopleB#756 of 1,973 nationallybetter than 60% of UK towns
24Blidworth4,295 peopleB#773 of 1,973 nationallybetter than 60% of UK towns
25Kimberley4,467 peopleB−#981 of 1,973 nationallybetter than 49% of UK towns
26Farnsfield3,217 peopleB−#1,032 of 1,973 nationallybetter than 47% of UK towns
27Balderton12,876 peopleB−#1,073 of 1,973 nationallybetter than 45% of UK towns
28Hucknall35,848 peopleB−#1,076 of 1,973 nationallybetter than 45% of UK towns
29Calverton7,318 peopleB−#1,078 of 1,973 nationallybetter than 45% of UK towns
30Annesley Woodhouse6,162 peopleC+#1,106 of 1,973 nationallybetter than 44% of UK towns
31Forest Town19,015 peopleC+#1,143 of 1,973 nationallybetter than 42% of UK towns
32Nottingham299,786 peopleC+#1,183 of 1,973 nationallybetter than 39% of UK towns
33Nuthall and Watnall9,581 peopleC+#1,214 of 1,973 nationallybetter than 38% of UK towns
34Brinsley and Underwood4,514 peopleC+#1,260 of 1,973 nationallybetter than 36% of UK towns
35Langold2,603 peopleC#1,293 of 1,973 nationallybetter than 35% of UK towns
36New Ollerton and Ollerton10,870 peopleC#1,403 of 1,973 nationallybetter than 30% of UK towns
37Tuxford2,810 peopleC#1,406 of 1,973 nationallybetter than 30% of UK towns
38Huthwaite5,069 peopleC#1,412 of 1,973 nationallybetter than 29% of UK towns
39Jacksdale and Westwood2,758 peopleC#1,416 of 1,973 nationallybetter than 29% of UK towns
40Kirkby-in-Ashfield21,262 peopleC#1,429 of 1,973 nationallybetter than 28% of UK towns
41Eastwood18,890 peopleC#1,467 of 1,973 nationallybetter than 27% of UK towns
42Stanton Hill and Skegby4,568 peopleC#1,475 of 1,973 nationallybetter than 26% of UK towns
43Newark-on-Trent29,755 peopleC#1,478 of 1,973 nationallybetter than 26% of UK towns
44Selston6,278 peopleC−#1,524 of 1,973 nationallybetter than 24% of UK towns
45Mansfield63,448 peopleC−#1,540 of 1,973 nationallybetter than 23% of UK towns
46Mansfield Woodhouse19,521 peopleC−#1,684 of 1,973 nationallybetter than 16% of UK towns
47Retford23,735 peopleC−#1,693 of 1,973 nationallybetter than 16% of UK towns
48Sutton in Ashfield36,435 peopleD#1,724 of 1,973 nationallybetter than 14% of UK towns
49Market Warsop6,970 peopleD#1,847 of 1,973 nationallybetter than 8% of UK towns
Quick answers

Questions people ask

Which town in Nottinghamshire has the best schools?

Collingham ranks first on schools among 49 towns, with an A+: better than almost every UK town. Southwell and West Bridgford follow.

How are these towns ranked?

The School Grade (England only): Key Stage 2 and GCSE results of the state schools in the town (or within 3 km), weighted by pupils and measured against England’s schools. The letter and rank are the same as on each town’s page. How grades work.

Why isn’t my town on this list?

Welsh towns have no School Grade: Wales doesn’t publish school-level results. Garrison towns and university campuses aren’t ranked, and towns without the figures this grade needs are counted above. The list covers Nottinghamshire’s towns of 2,500+ with the figure. Smaller places show it on their own pages; every town in Nottinghamshire is on the county page.

Go deeper

More Nottinghamshire lists

Every list ranks the same 2,500+ towns, so a town’s rank means the same thing on each.

All Nottinghamshire rankings →
County by county

Towns with the best schools, county by county

Sources: DfE Get Information about Schools (16 October 2026), Key Stage 2 performance tables (2023–2025, three-year average) and Key Stage 4 (2025/26, provisional); Ofsted state-funded school inspections as at 30 September 2026 · TownRatings grades: our own summary of the data, ranked against UK towns only. All under the Open Government Licence v3.0.

Contains public sector information licensed under the Open Government Licence v3.0. Contains HM Land Registry data © Crown copyright and database right 2026. Contains OS data © Crown copyright and database right 2026 (ONS boundaries). Northern Ireland: Source: NISRA; contains Land & Property Services data and Ordnance Survey of Northern Ireland information, © Crown copyright, licensed under the Open Government Licence v3.0. Scotland: contains National Records of Scotland data, Registers of Scotland data and SEPA data, © Crown copyright / © SEPA 2025, licensed under the Open Government Licence v3.0.