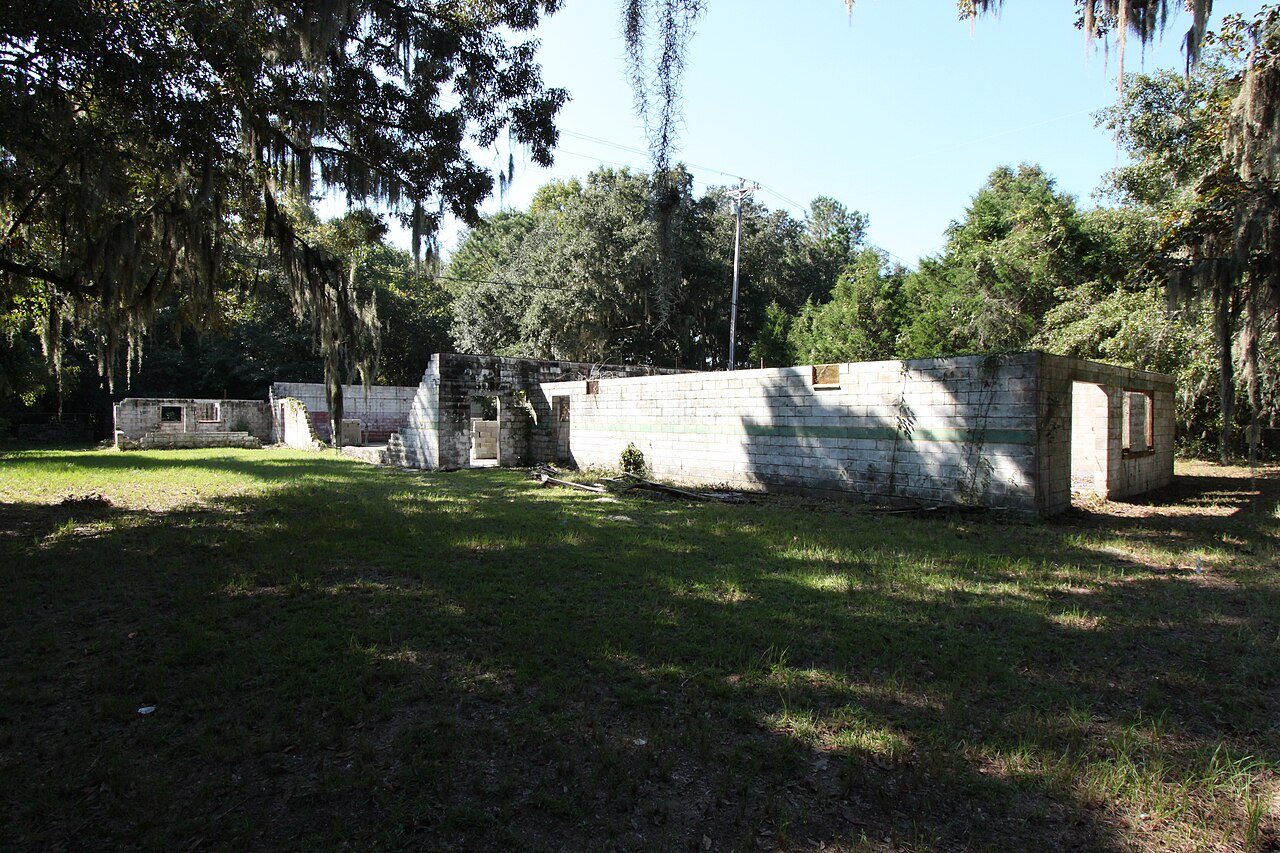
 Progressive Club, The · Photo: Cantbeatpie · CC BY-SA 3.0
132 homes sold in Kiawah Island in the last year, at a typical $1.4M
Houses and condos split the market almost evenly. Below: what each kind of home sells for, what your budget buys, the best months to buy, how hard you’ll have to bid, and a shortcut to every site where Kiawah Island homes are listed.
Every place Kiawah Island homes are listed, in one stop
We don’t copy listings: the agents’ sites have the photos and the latest price changes. Set what you want once and we open each site already filtered to Kiawah Island.
For sale
Rent
New, land & open houses
Links open the listing sites; TownRatings isn’t paid for them and doesn’t rank one above another. Rentals and government-owned homes come from sources outside the MLS.
38% of Kiawah Island’s sales are condos, at $1.1M less than a house
78 houses and 52 condos sold in the year to May 2026.
typical sale · 78 sold in the year to May 2026
- Per square foot
- $712SC $205
- Days to sell
- 80
- Sold over asking
- 4%
- Listings with a price cut
- 9%
typical sale · 52 sold in the year to May 2026
- Per square foot
- $988SC $263
- Days to sell
- 80
- Sold over asking
- 4%
- Listings with a price cut
- 17%
Townhouses: 8 sold, typical $797K
Too few sales in 12 months for reliable figures.
More homes sell than most years, at 2.5 times the 2016 price
132 sales in the last year, against 204 in 2020 and a low of 43 in 2013. The typical sale went from $569K in 2016 to $1.4M.
Source: Redfin Data Center, MLS sales; from June 2026 each month is a 3-month rolling window, its counts divided by 3. Typical price and $/sq ft are the monthly medians, weighted by sales. Redfin stopped publishing towns’ figures by property type after May 2026, so houses and condos are shown for the year to then.
What $1.4M buys in Kiawah Island
Check a listing against what Kiawah Island homes sold for
Against the town’s median price per square foot over the last 12 months. A rough check: condition, lot and location within town move a price more than this can see.
Bidding wars in Kiawah Island are back to pre-pandemic levels, but two thirds fewer homes come up for sale
We read every month of Kiawah Island’s home sales since 2012 so you don’t have to. Each figure covers 12 months, because a single month in a town is too few sales to mean much. Latest: the year to September 2026, 132 sales.
If you’re buying in Kiawah Island
- Shop in May. It brings about 17 new listings a month, close to the busiest month, with fewer bidding wars (7% over asking).
- Offer under asking. Buyers paid 96.6% of the list price on average; 4% paid over.
- You’ll usually have time. Only 39% of homes go under contract within two weeks; the typical one takes 68 days.
Spring brings the homes; summer brings the bidding wars
March has the most new listings (about 18 a month), but June is the most competitive: 15% of June sales close over asking. April and May offer nearly as much choice with fewer homes bid up (9%). February has the least competition (4%).
Averages for each calendar month, 2015 on.
Calmer than the 2021 frenzy, and calmer than South Carolina
| Kiawah Island now | 2017–19 | 2021 peak | SC now | |
|---|---|---|---|---|
| Sold over askingShare of sales that closed above the list price | 4% | 2% | 19% | 12% |
| Gone within two weeksShare of homes under contract within 14 days | 39% | 14% | 58% | 25% |
| Price paid vs. askingAverage sale price ÷ list price | 96.6% | 93.6% | 98.8% | 97.7% |
| Days to sellMedian days from listing to contract | 68 | 223 | 79 | 81 |
36 homes for sale on a typical day
That’s 1.4 times the 2022 low (27), 63% fewer than in 2017–19 and well under 2019’s 102.
Since 2019, houses are up 91%, condos 161%
A house typically sold for $2.1M in the year to May 2026 (78 sales), a condo for $1.1M (52).
Median sale price, weighted by sales each month. Years with fewer than 4 sales of a type are left out.
Kiawah Island ranks 115th of 124 busy South Carolina markets for bidding wars
Share of sales over asking in the last year, among towns with 60 or more sales. Kiawah Island is one of the state’s calmer markets.
Source: Redfin Data Center, city figures, January 2012 to September 2026 (MLS sales, not seasonally adjusted; from June 2026 each month is a 3-month rolling window, its counts divided by 3). Ratios are weighted by homes sold; price cuts by homes for sale.
Owning the typical Kiawah Island home costs about $7,825 a month
Price: Kiawah Island’s typical sale, last 12 months. Property tax at Kiawah Island’s 0.4% (median bill ÷ median value, Census ACS); insurance at 0.35% of price a year. Before PMI, HOA dues, upkeep and the tax deduction. Whether Kiawah Island is affordable on local pay is on Cost of living.
Six things worth knowing
New listings in March
The month with the most choice. December has the fewest, about 5.
Best time to buyProperty tax, a year
Of a home’s value: the median bill over the median home value. On a $1.4M home, about $5,870 a year.
Taxes vs. neighborsSchools
The schools grade for Kiawah Island, from test results, graduation and how much students grow.
Schools in Kiawah IslandTypical commute
The average one-way trip to work for people who live in Kiawah Island.
Work & commuteCheck the flood map
Flood insurance isn’t in a standard policy, and lenders require it in FEMA flood zones. Check the address before you make an offer.
Natural hazardsLook up any property
Assessed value, lot size and every past sale of a home you’re eyeing are public, at the town or county assessor and the registry of deeds.
Folly Beach, Seabrook Island, James Island, Hollywood, Meggett and Ravenel sell for less a square foot
The busier markets within 25 miles of Kiawah Island, by what sold. Prices, taxes and how far a paycheck goes next door are on Cost of living.
| Sold | Typical sale | $/sq ft | Over asking | Days to sell | |
|---|---|---|---|---|---|
| Ravenel | 201 | $399K | $223 | 15% | 64 |
| James Island | 190 | $600K | $361 | 20% | 62 |
| Seabrook Island | 182 | $939K | $572 | 4% | 89 |
| Kiawah Island | 132 | $1.4M | $839 | 4% | 68 |
| Hollywood | 107 | $653K | $274 | 11% | 112 |
| Folly Beach | 103 | $1.1M | $650 | 1% | 156 |
| Meggett | 20 | $706K | $299 | 0% | 191 |
Redfin Data Center, October 2025 to September 2026. Towns with fewer than 20 sales are left out, and Redfin doesn’t report every town separately.
Post your home to Kiawah Island, free
Selling it yourself, renting out an apartment or looking for a roommate? Post it to Kiawah Island. People who follow the town see it, and so do people comparing Kiawah Island with their own town. No commission, no listing fee.
Questions about buying a home in Kiawah Island
What do homes sell for in Kiawah Island, SC?
132 homes sold in the year to September 2026 at a typical $1.4M, $839 a square foot. Houses sold for about $2.1M, condos for about $1.1M in the year to May 2026.
Is Kiawah Island a buyer’s or seller’s market?
A seller’s market: 32 homes were for sale in September 2026 and 12 sold, about 2.6 months of supply. Buyers paid 96.6% of asking on average.
When is the best time to buy in Kiawah Island?
March brings the most new listings. The sales history shows which months have fewer bidding wars.
How much are property taxes in Kiawah Island?
About 0.4% of a home’s value a year. On a $1.4M home that’s near $5,870.
Where can I see homes for sale in Kiawah Island?
Zillow, Redfin, Realtor.com and Homes.com all carry Kiawah Island’s MLS listings; the search links above open each one filtered to Kiawah Island.
Sales, prices, days on market and listings: Redfin Data Center (MLS, monthly, not seasonally adjusted; from June 2026 each month is a 3-month rolling window, its counts divided by 3). Property tax rate: Census American Community Survey. Two-bedroom rent: HUD Fair Market Rent. Typical home value: Zillow Home Value Index. Schools grade: TownRatings (how grades work).