
Huey based at the ohnstown Airport, 2005
Richland Township’s story
246 years in pictures
The archive holds 14 old photos and papers going back to 2005 and 5 maps from 1904 on.
- 1780Richland Township is settled
Each edition grades its towns against each other only.
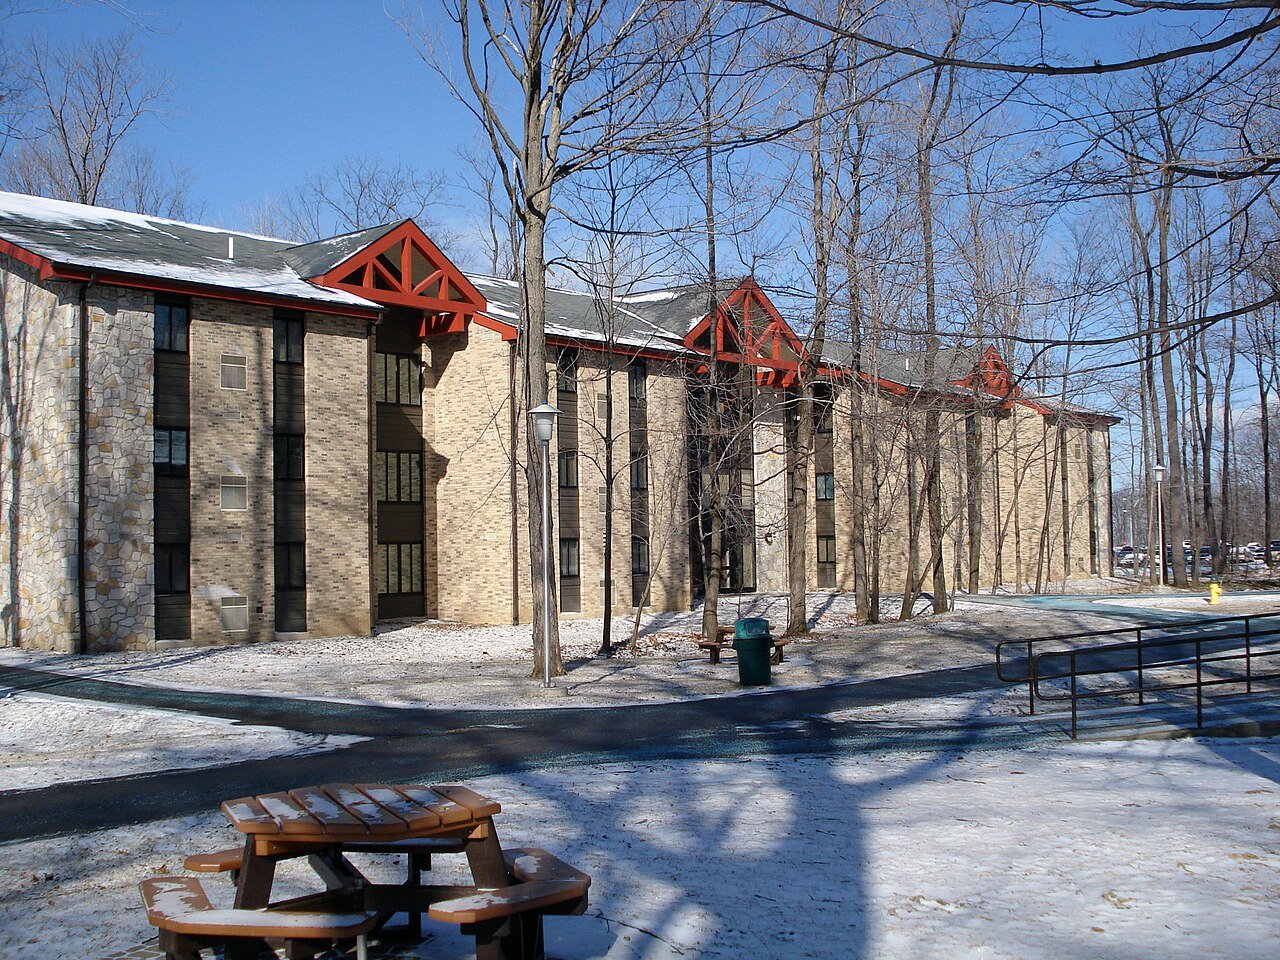
Population 11,936: a town settled in 1780.
Mostly strong, with a single weak spot. Its best grade is for hazard risk (A+). Homes run about $190K for a typical one, 3.3 times the Johnstown metro’s $58K median household income. The trade-off is safety — its crime rate is higher than 76% of U.S. towns, with 18 violent crimes reported to the FBI in 2025. Overall, that makes a B+, good for 506th of 1032 in Pennsylvania. Set against the rest, it does better than nearly two thirds of U.S. towns. Richland Township is home to University of Pittsburgh-Johnstown. The town’s average commute is 17 minutes, where Pennsylvania’s towns sit at 26 minutes and U.S. towns at 25 minutes.
Figures: FEMA National Risk Index · FBI crime data, 2025 · home values, Zillow · incomes, Census ACS, 2020–24.
Where Richland Township beats most towns.
| School | Grades | Students |
|---|---|---|
| Richland El Sch | K–6 | 831 |
| Richland Academy | PK–K | 47 |
| Richland HS | 7–12 | 693 |
The archive holds 14 old photos and papers going back to 2005 and 5 maps from 1904 on.
Each subject compared with towns across the country (schools within Pennsylvania), ordered by how far Richland Township is from typical.
How TownRatings grades towns →
Who provides power, water and the rest in Richland Township, and how to reach them.
EPA SDWIS (Oct 9, 2026) · HIFLD + EIA-861 2025 · Census 2020 ZCTAs · NCES 2024–25 · registration: vote.gov, updated Nov 18, 2024.
Ordered by what stands out in Richland Township.
Richland Township draws workers from Johnstown and beyond, but it reports more crime than Geistown and its other graded neighbors.
10,791 jobs are based in Richland Township, 2.2 for every working resident, so most of the people who work here commute in. The average commute takes 17.1 minutes, against 26.3 across Pennsylvania.
Jobs based in Richland Township fell to 10,791 in 2023, 1,827 fewer than in 2013. 23% of working residents work locally in the town. For half of commuters, work is under 6 miles away. The top destinations are Johnstown (15%), Windber (3%) and Pittsburgh (2%).
| Richland Township | Pennsylvania towns | U.S. towns | |
|---|---|---|---|
| Average trip to work | 17 minutes | 26 minutes | 25 minutes |
| Working residents who work in town | 23% | 6.3% | 8% |
| Below the poverty line | 11% | 7.6% | 9.6% |
| Median household income | $73,000 | $81,000 | $80,000 |
Census LEHD 2023 · ACS
Two of its 4 schools are shown below, with the reason for each. Richland SD runs its public schools. The largest public high school is Richland HS, with 693 students.
| School | Level | Students | Letter |
|---|---|---|---|
| Richland El SchLargest public elementary schoolGrades K–6 | Grades K–6 | 831 | A− |
| Richland HSLargest public high schoolGrades 7–12 | Grades 7–12 | 693 | A− |
NCES · EDFacts · graded within PA on state tests and graduation
61% of Richland Township’s expected losses from natural hazards come from inland flooding, followed by tornadoes at 9%. This Pennsylvania town has had 29 paid flood insurance claims since 1978. Expected storm and flood damage is lower than in 99% of U.S. communities.
FEMA flood insurance claims · FEMA National Risk Index · OpenFEMA
Each of the 3 graded towns on its borders reports less crime per resident, from Geistown (A) to Adams Township (A+). At 32.5 crimes per 1,000 residents a year, it reports more crime than 90% of Pennsylvania’s graded towns.
For Richland Township, the property offense rate is 19.4 per 1,000 residents. In Richland Township, the violent crime rate is 1.5 per 1,000 residents.
| Richland Township | Pennsylvania towns | U.S. towns | |
|---|---|---|---|
| Property crimes per 1,000 (2025) | 19.4 per 1,000 residents | 5.7 | 9.9 |
| Violent crimes per 1,000 (2025) | 1.5 per 1,000 residents | 0.7 | 1.6 |
FBI crime data, 2025 · crimes reported to police
The share of adults in Richland Township who had a checkup this year: 80%. 17% of Richland Township adults binge drink.
| Richland Township | Pennsylvania towns | U.S. towns | |
|---|---|---|---|
| Binge drink (CDC PLACES) | 17% | 18% | 16% |
| Yearly checkup (CDC PLACES) | 80% | 79% | 79% |
| Frequent physical distress (CDC PLACES) | 13% | 14% | 14% |
| Smoke cigarettes (CDC PLACES) | 14% | 17% | 14% |
| What stands out | Richland Township | PA |
|---|---|---|
| More adults who have had cancer | 10.5% | 8.8% |
| More adults with heart disease | 8.3% | 7.4% |
CDC PLACES 2025 · modeled estimates for adults · CMS · HRSA
Richland Township’s July high comes in at 81°F.
NOAA U.S. Climate Normals, 1991–2020
Trails total 5.0 miles in 3 parks and preserves. Richland Township’s trail density stands at 0.2 miles per square mile.
| Richland Township | Pennsylvania towns | U.S. towns | |
|---|---|---|---|
| Conserved land | 0.7% | 8.2% | 4.3% |
| Miles of trail per square mile | 0.2 miles per square mile | 0.5 | 0.4 |
| Biggest places to walk | Trails | Acres |
|---|---|---|
| 1. Luray Park | 0.4 mi | 10 |
| 2. Windber Recreation Park | — | 16 |
| 3. East Hills Kiwanis Memorial Park to Veterans | — | 1 |
Trails & parks © OpenStreetMap contributors · Conserved land: USGS PAD-US
Among residents in Richland Township, 27% are 65 or older. The bachelor’s-degree share among adults 25 and older is 37%, against 35% across Pennsylvania. 11,936 people lived in Richland Township by the Census Bureau’s 2025 estimate, 2.7% fewer than in 2020.
| Richland Township | Pennsylvania towns | U.S. towns | |
|---|---|---|---|
| Under 18 | 14% | 20% | 22% |
| Aged 65 or older | 27% | 21% | 18% |
| Bachelor’s degree or more, 25+ | 37% | 29% | 29% |
| Median age | 43.9 years | 43.2 years | 40.5 years |
52% women, 48% men
That’s an even split within the survey’s margin of ±2.5 points. Across Pennsylvania, 50.7% of residents are women.
| Richland Township | PA | U.S. | |
|---|---|---|---|
| Under 10 | 8.9% | 10.8% | 11.6% |
| 10 to 17 | 5.4% | 9.7% | 10.3% |
| 18 to 24 | 19.3% | 9% | 9.1% |
| 25 to 34 | 9.1% | 13% | 13.7% |
| 35 to 44 | 9% | 12.6% | 13.2% |
| 45 to 54 | 12.3% | 11.9% | 12.2% |
| 55 to 64 | 9.4% | 13.6% | 12.7% |
| 65 to 74 | 12.3% | 11.4% | 10.2% |
| 75 and older | 14.2% | 8.1% | 7% |
| No diploma | 4% | 7.9% | 10.4% |
| High school | 36% | 32.9% | 26% |
| Some college | 14.4% | 15.1% | 19.1% |
| Associate’s | 8.8% | 8.9% | 8.8% |
| Bachelor’s | 22.6% | 20.9% | 21.6% |
| Graduate | 14.2% | 14.3% | 14.1% |
Census population estimates, 2025 · U.S. Census Bureau · ACS 2020-2024 5-year estimates
Museums, parks, gardens and other places to visit around Richland Township. Close and well known come first.
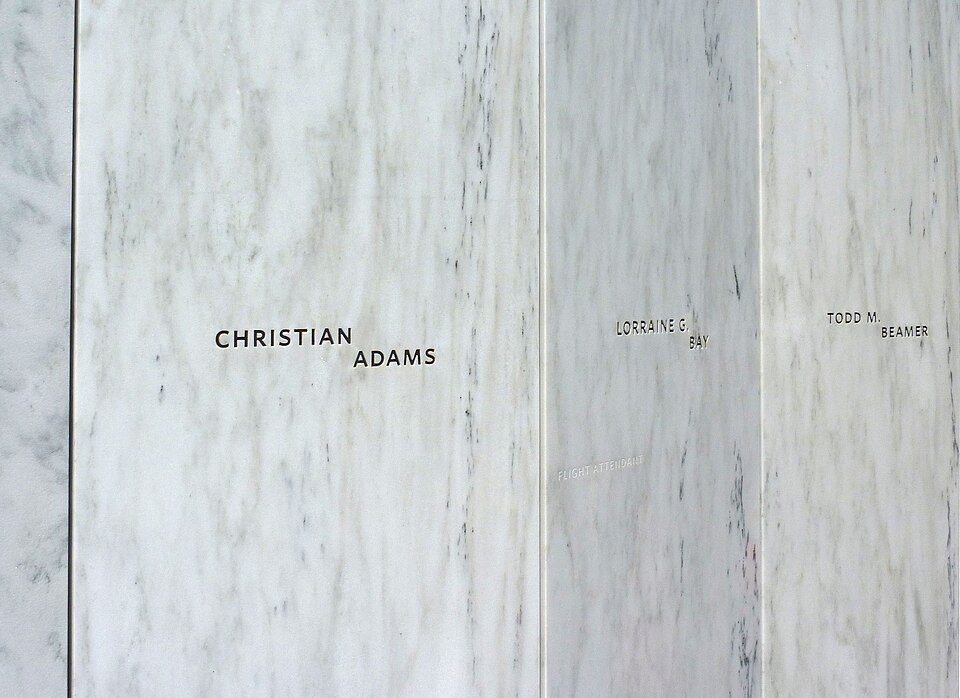 Big draw14 mi National MemorialFlight 93 National Memorial286K visitors a year
 6 mi DamSouth Fork Dam
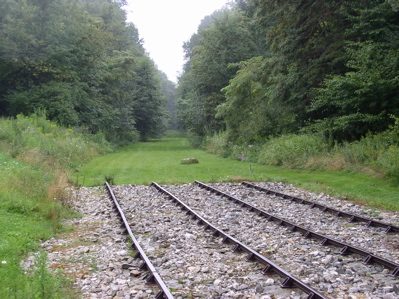 5 mi National Historic SiteAllegheny Portage Railroad National Historic Site163K visitors a year
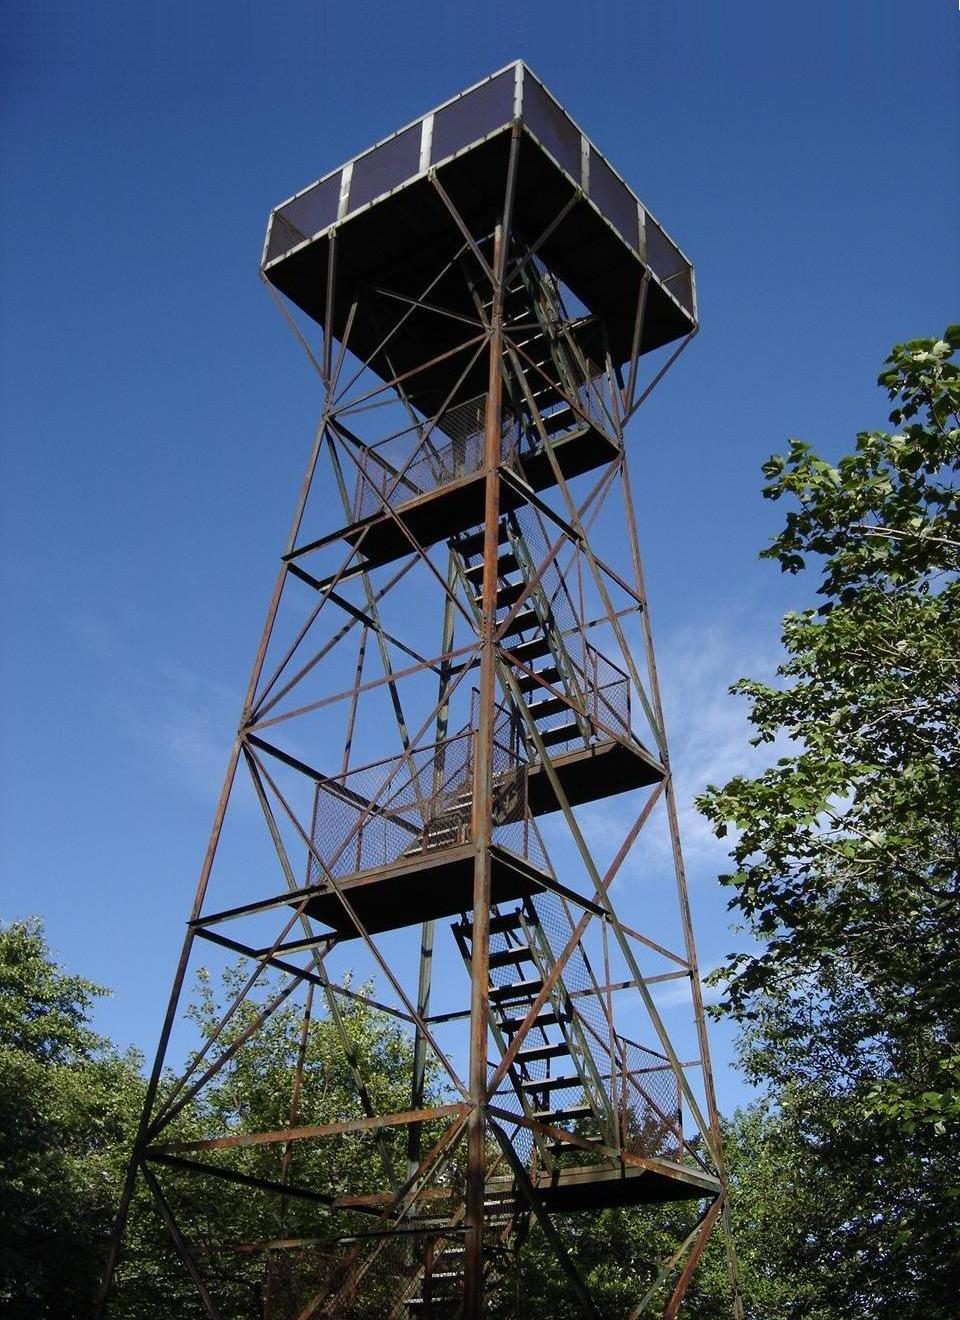 39 mi MountainMount Davis23 mi Theme parkIdlewild and Soak Zone
 5 mi National MemorialJohnstown Flood National Memorial75K visitors a year
Flight 93 National Memorial: James Steakley, CC BY-SA 3.0 · South Fork Dam: Ernest Walter Histed, Public domain · Allegheny Portage Railroad National Historic Site: Matthew A. Lynn; Original uploader was Mosamiazaz at en.wikipedia, Public domain · Mount Davis: Wikiuser100, CC BY-SA 3.0 · Johnstown Flood National Memorial: David Brossard, CC BY-SA 2.0
3 within 15 miles of the center of Richland Township
College town 17 of every 100 Richland Township residents are enrolled in college, against 6 across Pennsylvania.
2 colleges in town.
Township in Pennsylvania, US
Richland Township is a township in Cambria County, Pennsylvania, United States. The population was 12,814 at the 2010 census. It is part of the Johnstown, Pennsylvania Metropolitan Statistical Area.
From Wikipedia, licensed CC BY-SA 4.0 · facts via Wikidata (CC0)
9 towns share a border with Richland Township.
Stonycreek Township next door grades lower for schools (D to Richland Township’s A) and higher for cost of living (A to B−).
| Town | PA rank | Overall | Cost | Safety | Schools | Health |
|---|---|---|---|---|---|---|
| Richland Township | #506 | B+ | B− | C− | A | B+ |
| Paint Township | #393 | A− | A− | — | A | B− |
| Geistown | — | — | B | A | A | B+ |
| Conemaugh Township | #102 | A+ | A− | A | A+ | B− |
| Belmont | — | — | — | — | — | — |
| Scalp Level | — | — | — | — | — | — |
| Adams Township | #139 | A | A | A+ | A− | B− |
| Stonycreek Township | #879 | C | A | — | D | C− |
Geistown has fewer than 2,500 residents, so it gets subject grades but no overall grade. Paint Township and Stonycreek Township report no FBI crime data of their own. Belmont and Scalp Level aren’t graded (fewer than 1,000 residents, or not enough data). Compare Richland Township with a neighbor →
Short answers, built from the data on this page.
By most measures, yes. Richland Township grades B+ overall, better than 66% of U.S. towns and #506 of 1032 in Pennsylvania. It grades B+ for health, C− for safety and A for schools. Safety is its weak spot, with a C−.
Cost of living, which also weighs rents, property taxes and how many households pay 30% or more of their income for housing, grades B−.


