BelmontPA
A town of 2,618.
Is Belmont a good place to live?
11% of residents are under 18 in Belmont, below both the Pennsylvania town median (20%) and the median of U.S. towns (22%). Only 4 of the 1,036 Pennsylvania towns we compare have a lower share of working residents who work in town than Belmont. Belmont’s trail density is 4.1 miles per square mile, where Pennsylvania’s towns sit at 0.4 and U.S. towns at 0.4. We don’t grade Belmont yet; the figures below are still real.
99% of working residents leave Belmont for work
Where Belmont’s working residents go each day. Line width shows the share.
Census LEHD 2023
Moving to Belmont: who provides what
Belmont is unincorporated, so Cambria County and regional agencies provide most services.
EPA SDWIS (Oct 9, 2026) · HIFLD + EIA-861 2025 · Census 2020 ZCTAs · NCES 2024–25 · registration: vote.gov, updated Nov 18, 2024.
The data
Ordered by what stands out in Belmont.
The FEMA risk score in Belmont is lower than in most of Pennsylvania or the rest of the country
The FEMA risk score in Belmont is 1 of 100.
FEMA National Risk Index · OpenFEMA
Belmont has 0.2 jobs for every working resident, so most commute out
Most working residents leave Belmont for work: only 1% work in town. Belmont’s average trip to work is 19 minutes. Jobs based in Belmont fell to 255 in 2023, 89 fewer than in 2013.
| Belmont | Pennsylvania towns | U.S. towns | |
|---|---|---|---|
| Average trip to work | 19 minutes | 26 minutes | 25 minutes |
| Median household income | $69,000 | $81,000 | $80,000 |
Where working residents work
Census LEHD 2023 · ACS
Older than Pennsylvania overall
People 65 and older are 31% of residents (20% statewide); children under 18 are 11% of residents (21% statewide). 34% of adults 25 and older have a bachelor’s degree or more, vs 35% across Pennsylvania.
| Belmont | Pennsylvania towns | U.S. towns | |
|---|---|---|---|
| Aged 65 or older | 31% | 21% | 18% |
| Median age | 50.4 years | 43.2 years | 40.5 years |
| Bachelor’s degree or more, 25+ | 34% | 29% | 29% |
Ages · share of residents
Education · adults 25 and older
Women and men · all residents
49% women, 51% men
That’s an even split within the survey’s margin of ±8 points. Across Pennsylvania, 50.7% of residents are women.
| Belmont | PA | U.S. | |
|---|---|---|---|
| Under 10 | 7.3% | 10.8% | 11.6% |
| 10 to 17 | 3.9% | 9.7% | 10.3% |
| 18 to 24 | 11.7% | 9% | 9.1% |
| 25 to 34 | 12.4% | 13% | 13.7% |
| 35 to 44 | 10.5% | 12.6% | 13.2% |
| 45 to 54 | 9.5% | 11.9% | 12.2% |
| 55 to 64 | 14.1% | 13.6% | 12.7% |
| 65 to 74 | 11.8% | 11.4% | 10.2% |
| 75 and older | 18.9% | 8.1% | 7% |
| No diploma | 2.6% | 7.9% | 10.4% |
| High school | 41.2% | 32.9% | 26% |
| Some college | 16.1% | 15.1% | 19.1% |
| Associate’s | 6.6% | 8.9% | 8.8% |
| Bachelor’s | 23% | 20.9% | 21.6% |
| Graduate | 10.5% | 14.3% | 14.1% |
U.S. Census Bureau · ACS 2020-2024 5-year estimates · in a town of 2,600, single groups can be off by several points
Belmont has snowy winters and pleasant summers
Belmont has chilly, snowy winters and pleasant summers. July afternoons reach 83°, January nights drop to 19° and about 74 inches of snow falls in a winter.
Typical low → high °F
NOAA U.S. Climate Normals, 1991–2020
More of Belmont’s adults had a checkup this year than in the typical Pennsylvania or U.S. town
82% of adults had a checkup this year in Belmont. Belmont beats the Pennsylvania average on 2 of 26 CDC measures and trails it on 5. 16% of adults binge drink in Belmont.
| Belmont | Pennsylvania towns | U.S. towns | |
|---|---|---|---|
| Yearly checkup (CDC PLACES) | 82% | 79% | 79% |
| Binge drink (CDC PLACES) | 16% | 18% | 16% |
| Frequent mental distress (CDC PLACES) | 15% | 16% | 17% |
| Get no exercise (CDC PLACES) | 27% | 24% | 25% |
| What stands out | Belmont | PA |
|---|---|---|
| More adults treating high blood pressure | 83.4% | 79.2% |
| More adults getting cholesterol checked | 88% | 85.3% |
| More adults who have had cancer | 11.6% | 8.8% |
CDC PLACES 2025 · modeled estimates for adults · CMS · HRSA
| Biggest places to walk | Trails | Acres |
|---|---|---|
| 1. Coldren St. Playground | — | 1 |
Trails & parks © OpenStreetMap contributors · Conserved land: USGS PAD-US
| Belmont | Pennsylvania towns | U.S. towns | |
|---|---|---|---|
| Median rent | $706 a month | $1,115 a month | $1,185 a month |
| Households that own their home | 66% | 78% | 73% |
Census ACS, 2020–24 · Zillow Home Value Index · Redfin Data Center
Flight 93 National Memorial and 19 more within 40 miles
Museums, parks, gardens and other places to visit around Belmont. Close and well known come first.
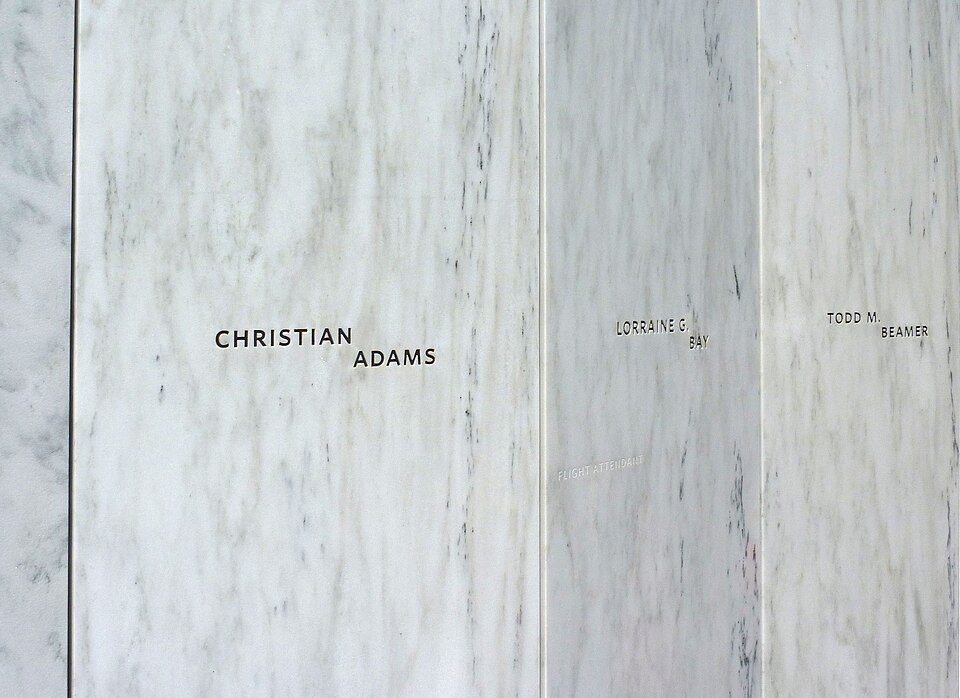 Big draw13 mi National MemorialFlight 93 National Memorial286K visitors a year
 7 mi DamSouth Fork Dam
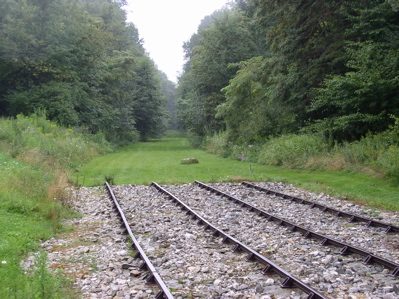 5 mi National Historic SiteAllegheny Portage Railroad National Historic Site163K visitors a year
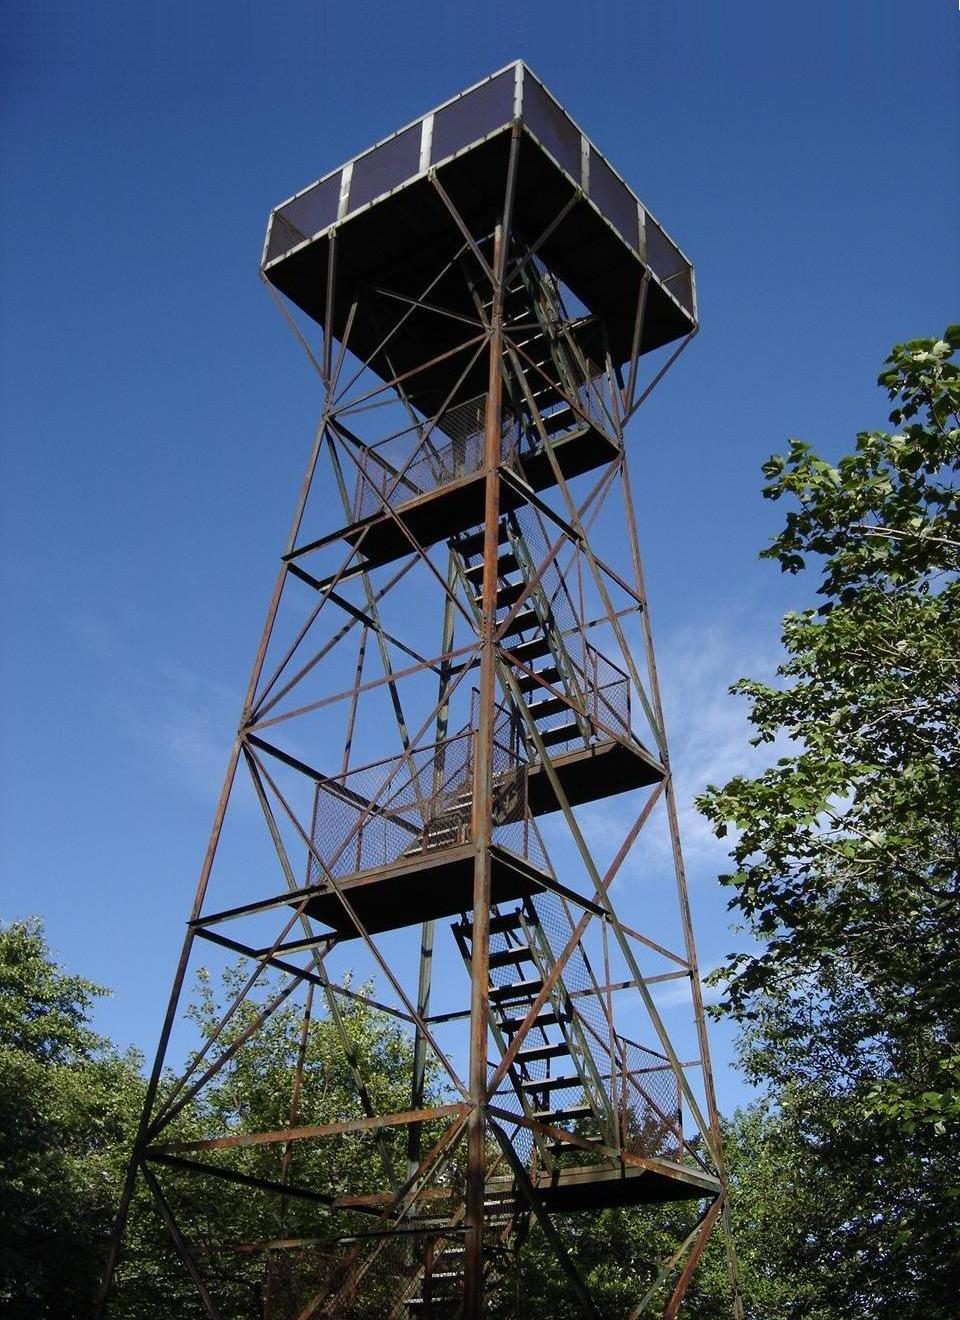 38 mi MountainMount Davis21 mi Theme parkIdlewild and Soak Zone
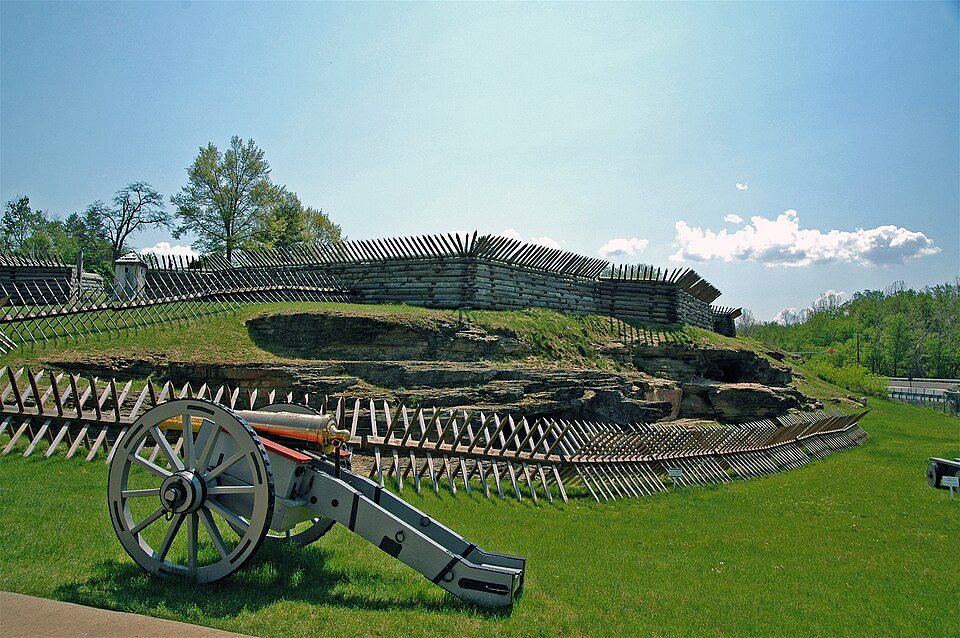 19 mi MuseumFort Ligonier
Photo credits
Flight 93 National Memorial: James Steakley, CC BY-SA 3.0 · South Fork Dam: Ernest Walter Histed, Public domain · Allegheny Portage Railroad National Historic Site: Matthew A. Lynn; Original uploader was Mosamiazaz at en.wikipedia, Public domain · Mount Davis: Wikiuser100, CC BY-SA 3.0 · Fort Ligonier: The original uploader was Mind meal at English Wikipedia., CC BY-SA 2.0


Everything we know about Belmont
Colleges nearby
3 within 15 miles of the center of Belmont
About 8 of every 100 Belmont residents are enrolled in college, against 6 across Pennsylvania.
About Belmont
Unincorporated community in Pennsylvania, US
Belmont is an unincorporated community and census-designated place (CDP) in Cambria County, Pennsylvania, United States. As of the 2020 census, Belmont had a population of 2,771.
From Wikipedia, licensed CC BY-SA 4.0 · facts via Wikidata (CC0)
- Area
- 1.8 sq mi
- Elevation
- 1,677 ft
Belmont’s neighbors
7 towns share a border with Belmont.
| Town | PA rank | Overall | Cost | Safety | Schools | Health |
|---|---|---|---|---|---|---|
| Belmont | — | — | — | — | — | — |
| Richland Township | #506 | B+ | B− | C− | A | B+ |
| Geistown | — | — | B | A | A | B+ |
| Oakland | — | — | — | — | — | — |
| Stonycreek Township | #879 | C | A | — | D | C− |
| Conemaugh Township | #102 | A+ | A− | A | A+ | B− |
| Lorain | — | — | — | — | — | — |
| Johnstown | #1004 | D | A | D | D | D− |
Geistown has fewer than 2,500 residents, so it gets subject grades but no overall grade. Stonycreek Township reports no FBI crime data of its own. Belmont, Oakland and Lorain aren’t graded (fewer than 1,000 residents, or not enough data). Compare Belmont with a neighbor →
Questions about Belmont
Short answers, built from the data on this page.
Is Belmont, PA a good place to live?
We don’t grade Belmont yet; the figures below are still real.