340 years in pictures
Census counts: 1,498 in 1790, 17,768 in 2020. The archive holds 18 old photos and papers going back to 1797 and 6 maps from 1890 on.
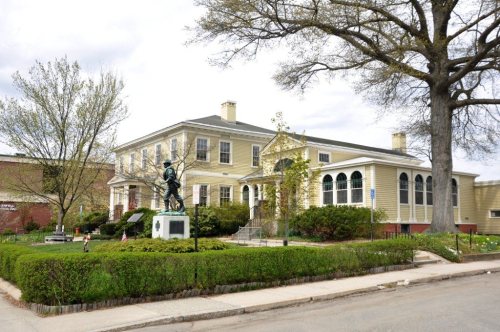
10 places on the National Register of Historic Places.
- 1686Greenfield is settled
Each edition grades its towns against each other only.

Greenfield earns a D, 274th of 282 graded towns in Massachusetts, mostly because of schools and safety. Its public schools trail 96% of Massachusetts towns on state tests and graduation. Its crime rate is higher than 84% of U.S. towns, with 81 violent crimes reported to the FBI in 2025. One bright spot: it has 37 miles of trail. History is its standout character grade: an A+, better than 98% of U.S. towns, with 10 places on the National Register. Greenfield’s average trip to work is 17 minutes, against 30 minutes in Massachusetts’ towns and 25 minutes across U.S. towns. Only 5 of Massachusetts’ 325 towns score lower on incomes. Greenfield is easier to get around on foot or by transit than 93% of U.S. towns.
Where Greenfield beats most towns, and one thing worth knowing.
Census counts: 1,498 in 1790, 17,768 in 2020. The archive holds 18 old photos and papers going back to 1797 and 6 maps from 1890 on.
10 places on the National Register of Historic Places.
Each subject compared with towns across the country (schools within Massachusetts), ordered by how far Greenfield is from typical.
How TownRatings grades towns →
Museums, parks, gardens and other places to visit around Greenfield. Close and well known come first.
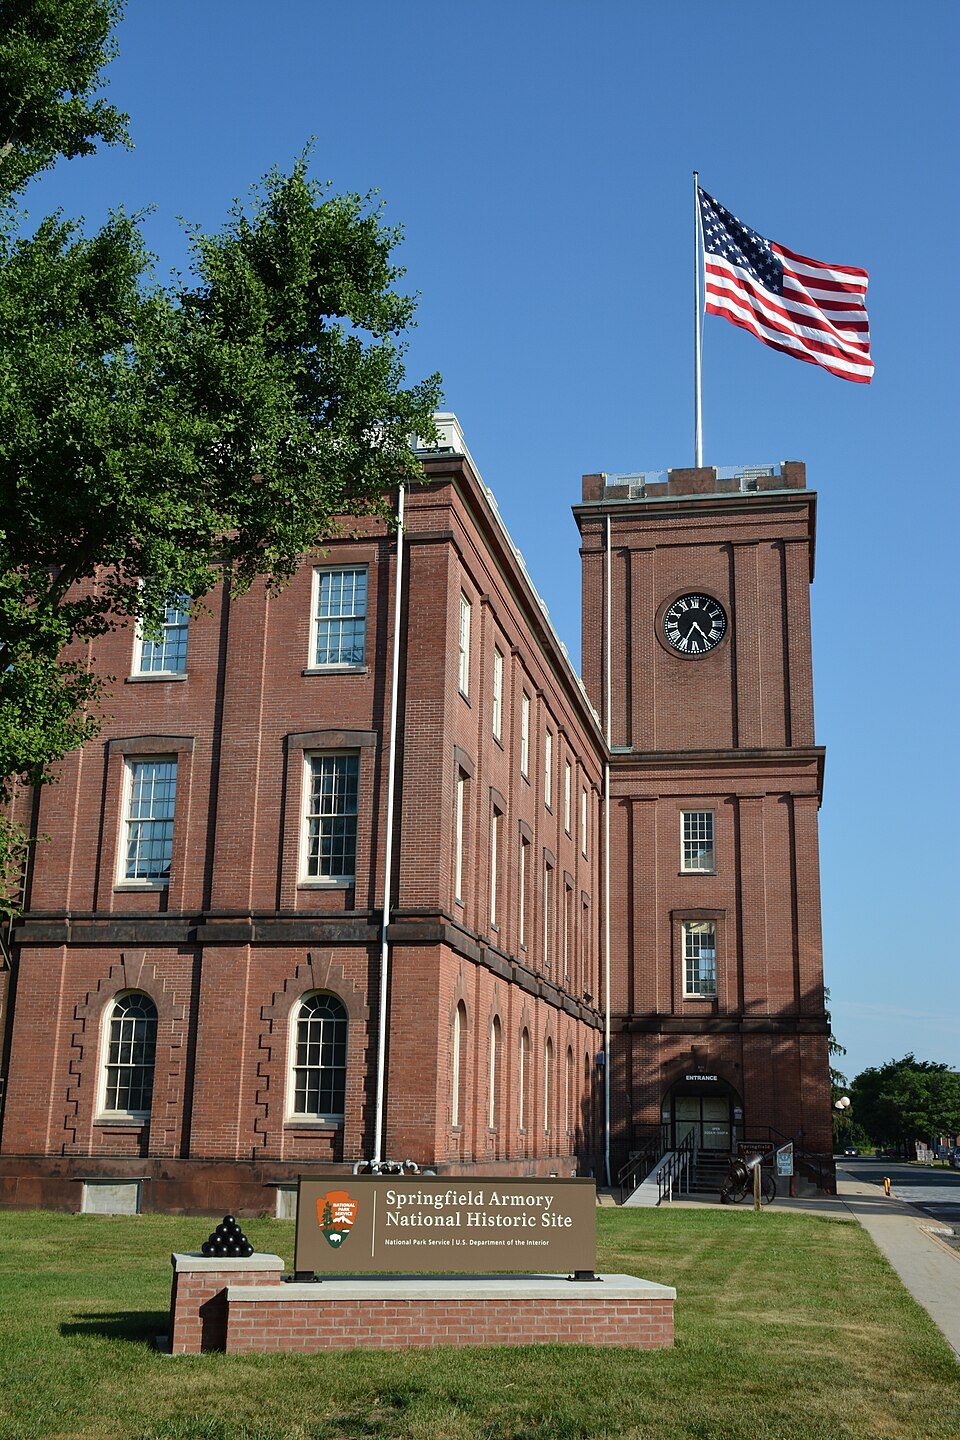
35 mi National Historic SiteSpringfield Armory National Historic Site14K visitors a year
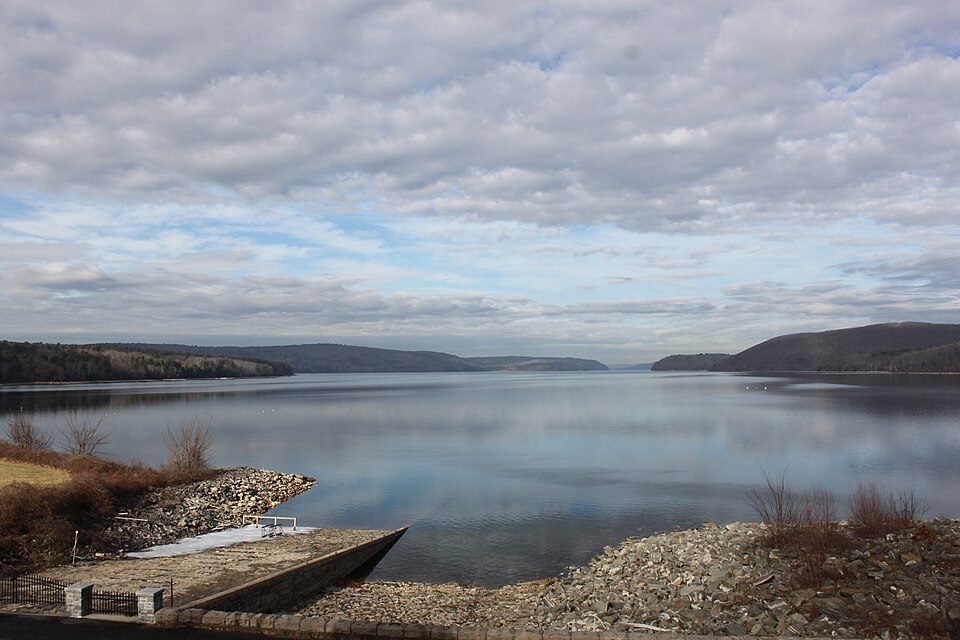
23 mi LakeQuabbin Reservoir
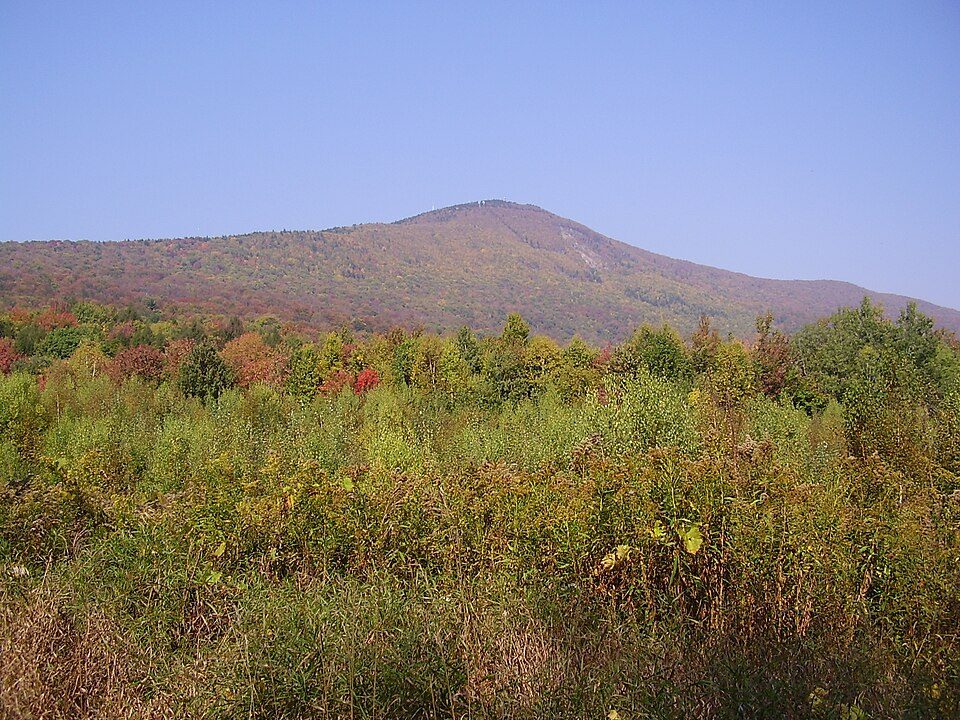
29 mi MountainMount Greylock
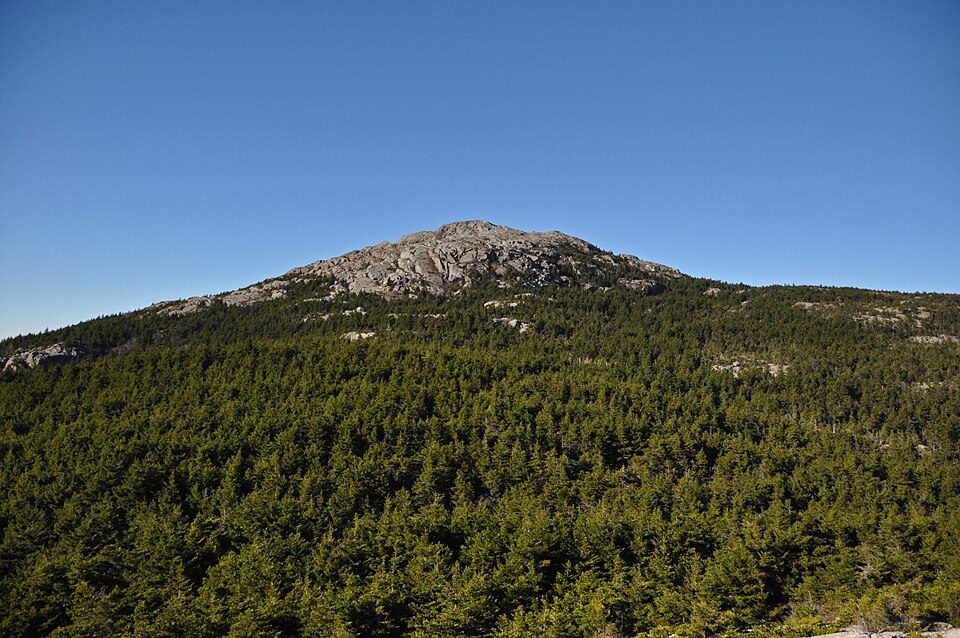
30 mi MountainMount Monadnock
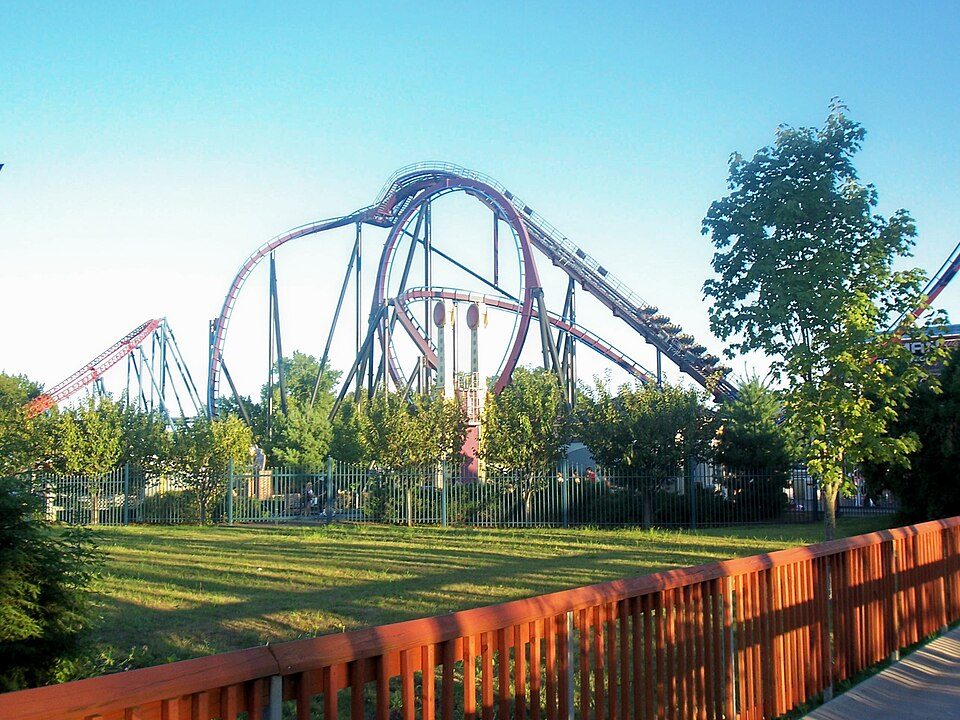
40 mi Theme parkSix Flags New England
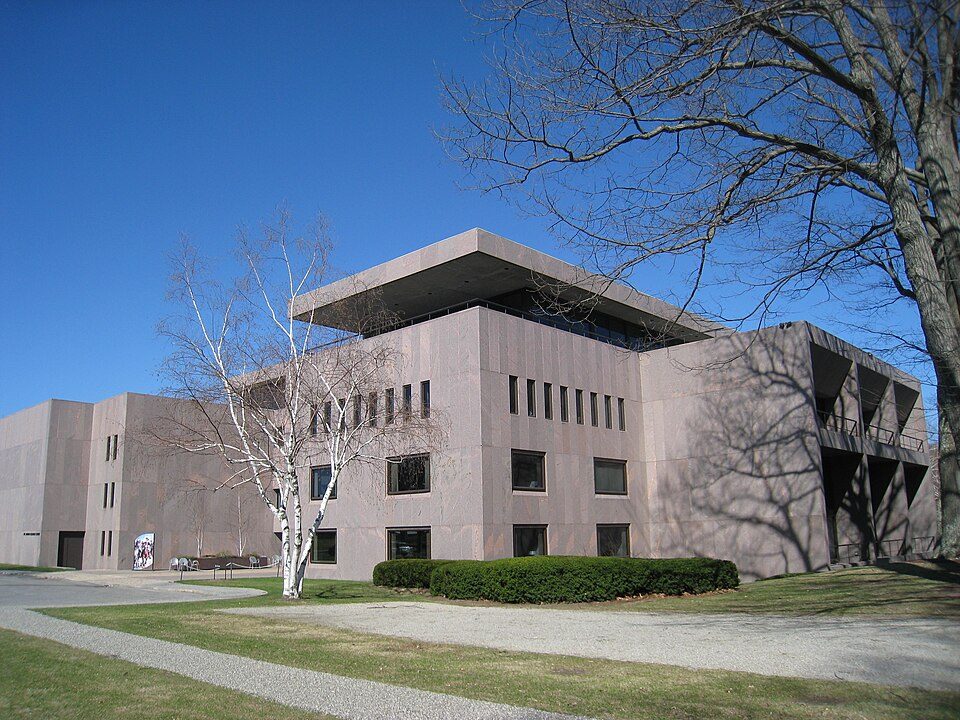
32 mi MuseumClark Art InstituteSpringfield Armory National Historic Site: National Park Service, Public domain · Quabbin Reservoir: engineerchange, CC BY 2.0 · Mount Greylock: Jstergis, CC BY 3.0 · Mount Monadnock: Jonwmcinenrey, CC BY-SA 4.0 · Six Flags New England: Canadaolympic989, Public domain · Clark Art Institute: Daderot, Public domain
Who provides power, water and the rest in Greenfield, and how to reach them.
EPA SDWIS (Oct 9, 2026) · HIFLD + EIA-861 2025 · Census 2020 ZCTAs · NCES 2024–25 · registration: vote.gov, updated Nov 18, 2024.
Ordered by what stands out in Greenfield.
Greenfield is healthier than towns with similar incomes and trades workers with Northampton and other neighbors, but it reports more crime than Montague and its other graded neighbors.
Each of its 5 graded neighbors has a higher School Grade than its D−, Deerfield highest at B−.
Two of its 11 schools are below, each with why it’s listed.
| School | Level | Students | Letter |
|---|---|---|---|
| Greenfield MiddleLargest public middle schoolGrades 5–7 | Grades 5–7 | 325 | C− |
| Greenfield HighLargest public high schoolGrades 8–12 | Grades 8–12 | 404 | C |
NCES · EDFacts · graded within MA on state tests and graduation
The typical Greenfield home is worth about $333,000, about the same as a year ago, 49% below the Massachusetts typical home. 56% of households own their home in Greenfield.
| Greenfield | Massachusetts towns | U.S. towns | |
|---|---|---|---|
| Households that own their home | 56% | 79% | 73% |
| Median rent | $1,107 a month | $1,683 a month | $1,185 a month |
Census ACS, 2020–24 · Zillow Home Value Index · Redfin Data Center
Each of the 5 graded towns on its borders reports less crime per resident, from Montague (C+) to Bernardston (A−). At 40.3 crimes per 1,000 residents a year, it reports more crime than 97% of Massachusetts’s graded towns.
The violent crime rate in Greenfield is 4.6 per 1,000 residents. Greenfield reports more crime per resident than most U.S. towns we grade: about 84% report less. The property crime rate in Greenfield is 16.3 per 1,000 residents.
| Greenfield | Massachusetts towns | U.S. towns | |
|---|---|---|---|
| Violent crimes per 1,000 (2025) | 4.6 per 1,000 residents | 1.4 | 1.6 |
| Property crimes per 1,000 (2025) | 16.3 per 1,000 residents | 4.9 | 9.9 |
FBI crime data, 2025 · crimes reported to police
Greenfield’s trail density is 1.7 miles per square mile. GTD Conservation Land, at 161 acres with 1.9 miles of trail, is the biggest park or preserve.
| Biggest places to walk | Trails | Acres |
|---|---|---|
| 1. Temple Woods | 2.3 mi | 57 |
| 2. Rocky Mountain Park | 2.2 mi | 90 |
| 3. GTD Conservation Land | 1.9 mi | 161 |
Trails & parks © OpenStreetMap contributors · Conserved land: USGS PAD-US
Greenfield has cold, snowy winters and warm summers, with plenty of rain. July afternoons reach 85°, January nights drop to 15° and about 46 inches of snow falls in a winter.
NOAA U.S. Climate Normals, 1991–2020
Greenfield has about as many jobs (8,940) as working residents, but only 2,245 people both live and work here. The average commute takes 17.4 minutes, against 29.1 across Massachusetts.
15% of Greenfield residents live below the poverty line. About one in 4 of Greenfield’s working residents works in town. Since 2013, Greenfield has added 632 jobs, to 8,940 in 2023.
| Greenfield | Massachusetts towns | U.S. towns | |
|---|---|---|---|
| Working residents who work in town | 26% | 9.8% | 8% |
| Median household income | $56,000 | $120,000 | $80,000 |
| Below the poverty line | 15% | 6% | 9.6% |
| Work from home | 12% | 18% | 11% |
Census LEHD 2023 · ACS
Against the 7,616 U.S. towns with household incomes like Greenfield’s, it is healthier than 91%, so its B isn’t only a matter of income. Within Massachusetts it is less healthy than 85% of the 279 graded towns: Massachusetts sets a high bar.
Greenfield beats the Massachusetts average on 0 of 32 CDC measures and trails it on 11.
| Greenfield | Massachusetts towns | U.S. towns | |
|---|---|---|---|
| Depression (CDC PLACES) | 26% | 24% | 23% |
| Obesity (CDC PLACES) | 28% | 28% | 35% |
| Frequent physical distress (CDC PLACES) | 15% | 12% | 14% |
| Feel lonely (CDC PLACES) | 34% | 33% | 33% |
| What stands out | Greenfield | MA |
|---|---|---|
| More adults with COPD | 8.2% | 5.9% |
| More smokers | 14.3% | 11.3% |
| More adults with heart disease | 7.2% | 5.8% |
CDC PLACES 2025 · modeled estimates for adults · CMS · HRSA
The median household earns $55,614, against $103,960 across Massachusetts, one input to its C− for jobs and income.
Adults 18 to 34 are 18% of residents (24% statewide); people 65 and older are 23% of residents (18% statewide). 39% of adults 25 and older have a bachelor’s degree or more, vs 47% across Massachusetts.
| Greenfield | Massachusetts towns | U.S. towns | |
|---|---|---|---|
| Aged 65 or older | 23% | 19% | 18% |
| Under 18 | 18% | 20% | 22% |
| Bachelor’s degree or more, 25+ | 39% | 47% | 29% |
| Median age | 44.6 years | 43.4 years | 40.5 years |
51% women, 49% men
That’s an even split within the survey’s margin of ±1.7 points. Across Massachusetts, 51.1% of residents are women. Median age: women 46.6, men 43.1.
| Greenfield | MA | U.S. | |
|---|---|---|---|
| Under 10 | 9.6% | 10.2% | 11.6% |
| 10 to 17 | 8.7% | 9.2% | 10.3% |
| 18 to 24 | 7% | 9.8% | 9.1% |
| 25 to 34 | 11.2% | 14% | 13.7% |
| 35 to 44 | 14% | 13% | 13.2% |
| 45 to 54 | 13.6% | 12.3% | 12.2% |
| 55 to 64 | 12.6% | 13.6% | 12.7% |
| 65 to 74 | 14.1% | 10.5% | 10.2% |
| 75 and older | 9.2% | 7.4% | 7% |
| No diploma | 6.4% | 8.6% | 10.4% |
| High school | 25.9% | 22.6% | 26% |
| Some college | 18.6% | 14.1% | 19.1% |
| Associate’s | 9.9% | 7.5% | 8.8% |
| Bachelor’s | 22.1% | 25.5% | 21.6% |
| Graduate | 17% | 21.8% | 14.1% |
U.S. Census Bureau · ACS 2020-2024 5-year estimates
Expected storm and flood damage is lower than in 56% of U.S. communities. Since 1984, 41 flood insurance claims have been paid out in Greenfield.
FEMA flood insurance claims · FEMA National Risk Index · OpenFEMA
1 within 15 miles of the center of Greenfield
About 4 of every 100 Greenfield residents are enrolled in college, against 8 across Massachusetts.
10 places in Greenfield on the National Register of Historic Places.
29 notable people were born in Greenfield.
City in Massachusetts, United States
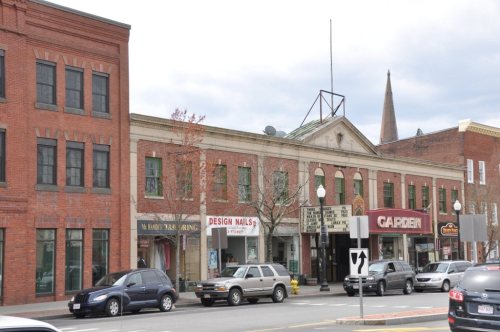
Greenfield is the county seat and sole city of Franklin County, Massachusetts, United States. Greenfield was first settled in 1686. The population was 17,768 at the 2020 census. Greenfield is home to Greenfield Community College, the Pioneer Valley Symphony Orchestra, the Franklin County Fair, and the Green River Festival. The city has a Main Street Historic District containing fine examples of Federal, Greek Revival, and Victorian architecture. Greenfield anchors the Greenfield Town, MA Micropolitan Statistical Area, which is included in the Springfield-Greenfield Town, MA Combined Statistical Area.
From Wikipedia, licensed CC BY-SA 4.0 · facts via Wikidata (CC0)
7 towns share a border with Greenfield.
| Town | MA rank | Overall | Cost | Safety | Schools | Health |
|---|---|---|---|---|---|---|
| Greenfield | #274 | D | C− | C− | D− | B |
| Gill | — | — | C− | B+ | D | A− |
| Deerfield | #137 | B+ | D | B | B− | A |
| Montague | #258 | D | C− | C+ | D | B+ |
| Turners Falls | — | — | — | — | — | — |
| Bernardston | — | — | C− | A− | C− | A− |
| Leyden | — | — | — | — | — | — |
| Shelburne | — | — | C− | A− | C− | A− |
Gill, Bernardston and Shelburne have fewer than 2,500 residents, so they get subject grades but no overall grade. Turners Falls and Leyden aren’t graded (fewer than 1,000 residents, or not enough data). Compare Greenfield with a neighbor →
Short answers, built from the data on this page.
Greenfield grades D overall, better than 5% of U.S. towns and #274 of 282 in Massachusetts. It grades B for health, C− for safety and D− for schools. Schools is its weak spot, with a D−.
Yes. That is 4.4 years of the area's median household income ($74,907 across the Greenfield, MA area). Cost of living, which also weighs rents, property taxes and how many households pay 30% or more of their income for housing, grades C−.
29 notable people were born here, including Jake Lacy and Penn Jillette.