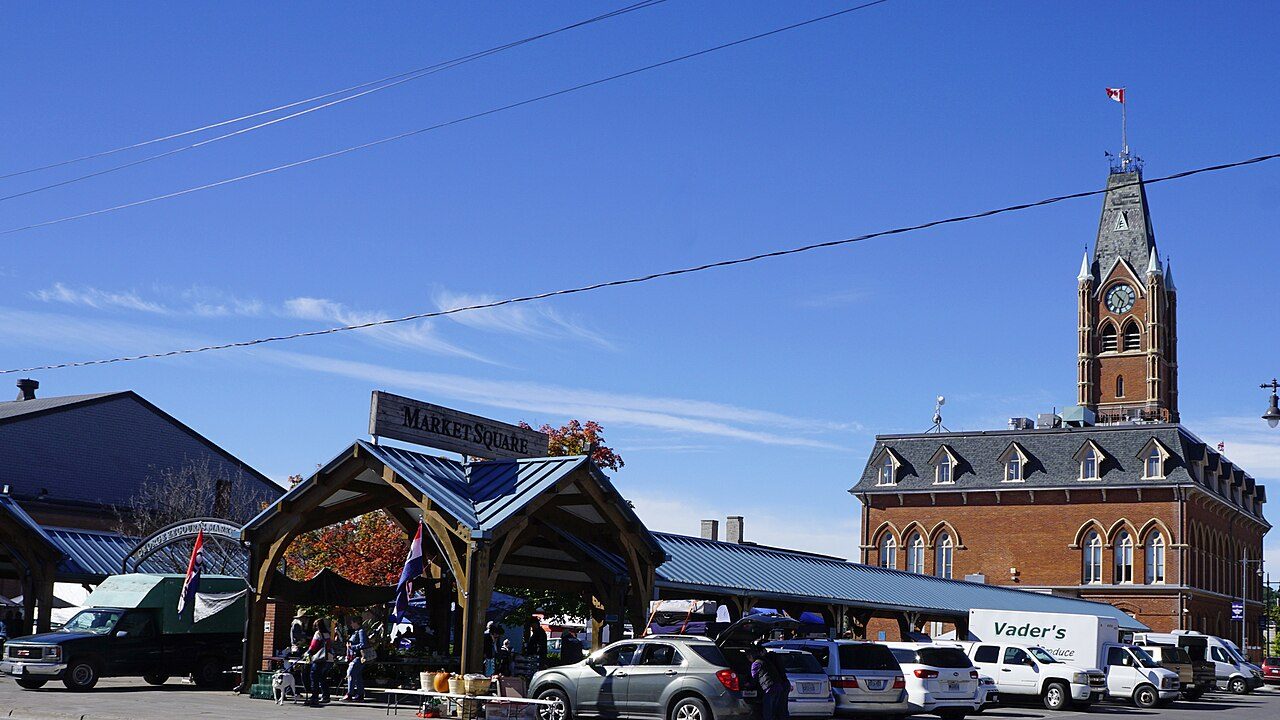
 Photo: JFVoll · CC BY-SA 4.0
18% of adults smoke in the health region around Belleville, against 12% for the typical Canadian town
Across the region, 45% of adults say their health is very good or excellent; Ontario as a whole reaches 51%. For Belleville itself the measure is access: 3.1 km to the nearest hospital, much like the typical 3.7 km. Health gives Belleville a grade of C−, #826 of 866 in Ontario and #2,387 of 2,583 Canadian towns.
What stands out about health in Belleville
Shorter lives in the region
Born around Belleville, a child can expect 1.7 fewer years than in the typical Canadian town’s region; at 65, another 20.0 (2022/2024). The wider area ↓
Fewer people feeling well
Adjusted for age, the region’s share in very good or excellent health is 6.7 points below the typical Canadian town’s; as answered, it is 43%. Health survey ↓
More chronic illness
High blood pressure (28%) and diabetes (11%) push the region’s chronic-condition figure above the typical Canadian town’s. Conditions and habits ↓
Plenty of pharmacies
With 11 pharmacies within 3 km of the average home and the nearest 1.7 km off, Belleville is well served for prescriptions. Getting care ↓
From Statistics Canada: the health survey and life expectancy for the health region, the deprivation index for the town; distances from the healthcare facilities database and OpenStreetMap.
Belleville grades C− for health
Each input ranked against Canadian towns of 2,500 or more: the region’s four, the town’s distance to a hospital.
The region’s four figures and the town’s distance to a hospital are each ranked against Canadian towns of 2,500 or more, then averaged. Its place: #826 of 866 in Ontario and #2,387 of 2,583 Canadian towns.
How the grade works
Health is graded as a regional score, labelled as such: very good or excellent self-rated health, chronic conditions (arthritis, diabetes and high blood pressure averaged) and smoking from the Canadian Community Health Survey, each age-standardised so an older region isn’t marked down for age alone, and life expectancy at birth, all for the health region. The residents’ average distance to a hospital is the one input measured for the town itself, so towns in one region can still differ.
How the 34 health regions in Ontario compare on life expectancy
Regional life expectancy in Ontario, then the town’s place on the national deprivation index.
Life expectancy at birth by health region · 2022/2024
Among the 34 regions in Ontario, from 73.7 to 86.3 years, this one is 26th.
Canadian Index of Multiple Deprivation · national quintile, 1 least to 5 most deprived
The index is context and never graded: it describes Belleville’s own areas, averaged over residents, on each of its four dimensions.
Life expectancy: Statistics Canada table 13-10-0988, three-year estimate 2022/2024, by health region.
43% in the region call their health very good or excellent, fewer than in Ontario (51%)
How adults in the health region answered the survey, not adjusted for age; the tick marks the province.
Share of adults, as answered · 2023/2024
Mental health looks weaker than in the province: 47% rate it very good or excellent, against 51% in Ontario, and 27% find most days quite stressful.
Canadian Community Health Survey 2023/2024 (Statistics Canada table 13-10-0972), adults 18 and over, as published.
In the region, high blood pressure (28%) and diabetes (11%)
What the survey finds on conditions, weight and habits for the region, the province as the tick.
Conditions and weight · 2023/2024
Habits · 2023/2024
Obesity runs higher than in the province, at 39% of adults against 30% for Ontario. Heavy drinking runs above the province, 25% to 17%.
Canadian Community Health Survey 2023/2024 (table 13-10-0972), as published, not adjusted for age; obesity from reported height and weight. The anxiety disorder figure is the 2021/2022 estimate: Statistics Canada found the latest too unreliable to publish here.
Getting to hospital from Belleville: 3.1 km on average
Measured from where the town’s residents live, so this part is Belleville’s own, not the region’s.
Nothing unusual for Belleville here: the typical town in Ontario is 3.3 km from a hospital and the typical Canadian town 3.7 km.
Hospitals and clinics: Statistics Canada, Open Database of Healthcare Facilities. Pharmacies: © OpenStreetMap contributors (ODbL). Straight-line distances from each dissemination area, weighted by its 2021 population.
Just under the trend for regions as deprived
The comparison runs between 102 health regions, each shared by its towns; Belleville’s region’s dot is close to the line.
Canada’s 102 health regions show life expectancy dropping as deprivation climbs (correlation −0.83); a region scored 3.2 would be expected to reach 80.0 years, and Belleville’s region is close, at 79.8. Narrow the field to the 10 regions most like it on deprivation and 7 still live longer, with 81.2 years in the middle.
Life expectancy: Statistics Canada table 13-10-0988, 2022/2024, by health region. Deprivation: Canadian Index of Multiple Deprivation 2021 (situational vulnerability), averaged over each region’s towns by their residents; income: 2021 Census median household income, averaged the same way. The averages and the line are TownRatings calculations.
Mid-table for hospital distance among towns its size: Belleville comes 15th of 40
Ordered by residents’ distance to a hospital: 40 Canadian towns of 49,863 to 79,371 people, median 4.0 km.
| # | Town | People | Hospital | Very good health |
|---|---|---|---|---|
| 1 | North Vancouver BC A+ | 66,624 | 1.1 km | 59% |
| 2 | Cornwall ON B− | 54,346 | 1.5 km | 49% |
| 3 | Whalley BC A | 52,642 | 1.8 km | 50% |
| 13 | North Bay ON C | 62,062 | 2.8 km | 47% |
| 14 | Pointe-aux-Trembles QC A | 49,869 | 3.0 km | 54% |
| 15 | Belleville ON C− | 62,914 | 3.1 km | 45% |
| 16 | Saint John NB C | 79,371 | 3.4 km | 43% |
| 17 | Port Coquitlam BC A | 67,724 | 3.4 km | 48% |
| 40 | Keswick ON B+ | 53,630 | 17 km | 51% |
The region’s very good or excellent health column is regional: towns in one region share it.
Health in the places around Belleville
Nearby places: distance to a hospital and each one’s regional figures. Tap a town for its health page.
| Town | Hospital | Very good health | Life exp. | Health |
|---|---|---|---|---|
| Belleville | 3.1 km | 45% | 79.8 | C− |
| Quinte West 16 km | 5.5 km | 45% | 79.8 | C− |
| Tyendinaga Mohawk Territory 18 km | 14 km | 45% | 79.8 | D |
Nothing in the regional columns separates Belleville from its neighbours; the hospital distance is what does. Residents of Tyendinaga Mohawk Territory live further from a hospital, at 14 km against 3.1 km in Belleville.
What this data can and can’t tell you
- Adjusted for age. Standardising for age lets a retirement region and a young one be set side by side; the charts keep the raw answers, the grade the standardised ones.
- Distances are straight lines. Each small census area is measured as the crow flies to the nearest facility and weighted by its 2021 residents, so real trips run longer.
- Deprivation is context. The Canadian Index of Multiple Deprivation (2021) is context, never graded, and the territories have none.
- Who the survey asks. Not everyone is in the survey’s sample: reserves, the Canadian Forces, institutions and two northern Québec regions are left out.
- Regional figures. Only the distances on this page belong to Belleville alone, because the health survey and life expectancy come for the whole health region.
- What counts as a hospital. Facility locations come from Statistics Canada’s open database; records without coordinates sit at their postal code, and not every hospital has an emergency room.
Questions about health in Belleville
How healthy is Belleville?
Self-rated health, chronic conditions, smoking and life expectancy all come out behind the typical Canadian town. Its chronic-condition figure, age-standardised, is 20%.
What is the life expectancy in Belleville?
There is no figure for Belleville alone; its health region’s is 81.8 for women and 77.8 for men in 2022/2024.
How is Belleville’s Health Grade worked out?
Not so far; the grade arrives with Canada’s grading run and will set the region’s figures, plus Belleville’s own distance to care, against the typical Canadian town.
How far is Belleville from a hospital?
Residents of Belleville have a clinic 2.1 km away on average and a pharmacy 1.7 km away, in straight lines.
Sources: Statistics Canada, Canadian Community Health Survey 2023/2024 (13-10-0972) · Statistics Canada, life expectancy 2022/2024 (13-10-0988) · Statistics Canada, health regions 2023 (82-402-X) · Statistics Canada, Open Database of Healthcare Facilities · pharmacies © OpenStreetMap contributors (ODbL) · Statistics Canada, Canadian Index of Multiple Deprivation 2021. Under the Statistics Canada Open Licence.
Adapted from Statistics Canada (Census of Population 2021, population estimates 2025, 2021 census boundaries) under the Statistics Canada Open Licence; this does not constitute an endorsement by Statistics Canada. Neighbourhood names in some cities © OpenStreetMap contributors (ODbL).