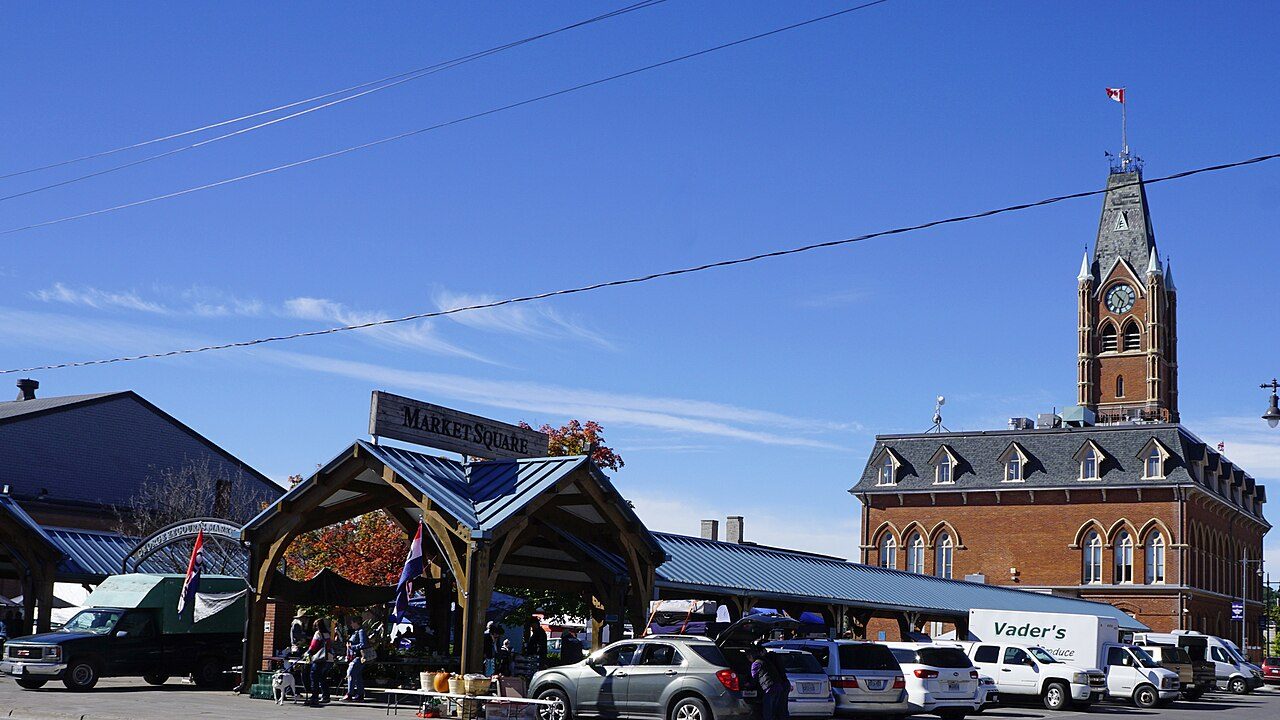
 Photo: JFVoll · CC BY-SA 4.0
In Belleville, July heat, January cold and precipitation all sit near the middle of Canadian towns
A typical July afternoon reaches 26.5°C, a January night drops to −11.2°C, and 941 mm of rain and snow falls in a year. Frost is rarer than in 68% of Canadian towns: about 146 nights a year drop below freezing. A year here swings 38°C from midwinter lows to midsummer highs. An umbrella or a shovel earns its place on about 116 days a year with 1 mm or more.
These are not Belleville’s own readings: ECCC keeps no normals there, so the page uses Trenton, 14 km south-west.
A year in Belleville at a glance
Each month’s typical high and low, in °C.
What stands out about Belleville’s climate
Compared with Canadian towns, with its place among towns of 2,500+ in Ontario beside it.
What a year in Belleville feels like
Typical highs and lows by season and by month, from ECCC’s 1991–2020 normals.
Frost on 146 days, 20°C on 124
The frost season runs October to May, and January freezes nearly every night. Some 9 nights a year drop under −20°C.
Frost days by month
Average days at 0°C or below
Days above 20°C by month
Average days
941 mm of precipitation in a typical year
The most falls in September, the least in February.
Rain and snow by month
Millimetres
Rain alone by month
Millimetres
Snowfall: about 155 cm in a normal year
The snow season runs November to April; January brings the most, about 44 cm.
Snowfall by month
Centimetres
Snow on the ground by month
Centimetres at month’s end
Heating a home in Belleville
92% of a year’s heating need falls between October and April. Months averaging under 10°C: October to April.
Behind the figure: the degrees each day’s mean falls under 18°C, summed for the year. By this count, homes here need less heating than 70% of Canadian towns.
Living with Belleville’s climate
What the normals mean for a garden, a day outside and the depth of winter.
From about 1 May to 10 October the garden is usually clear of frost, some 161 days.
The outdoor season by the averages is Jun, Jul, Aug and Sep, with highs of 17–27°C and lows of 8°C or more.
Parks & trails →About 28 days a year bring a wind chill under −20, when bare skin chills fast.
Summer brings about 51 days when the humidex passes 30.
A typical year is calm by definition; Belleville’s hazards page covers the exceptions.
Flood & hazards →ECCC’s normals location: Trenton
The page’s figures are ECCC’s 1991–2020 normals for Trenton, one of its 450 normals locations.
| Distance from the town | 14 km south-west |
| Station altitude | 86 m |
| Completeness | meets the WMO “3 and 5” rule |
| WMO standard normals | Yes |
| Coldest reading, 1991–2020 | −35.1°C |
| Hottest reading, 1991–2020 | 35.6°C |
| Average wind | 12.7 km/h on average, most often from the south-west |
| Next-nearest location | Point Petre, 44 km |
How Belleville compares
Against the 2,611 Canadian towns and neighbourhoods of 2,500 or more, each read from its own normals location; the dots are the other locations those towns use in Ontario.
Nearby towns’ climate
The nearest places on a normals location of their own: those that share Belleville’s would only repeat its figures. The nearest place to Belleville with figures is 20 km away.
| Town | July high | January low | Rain & snow |
|---|---|---|---|
| Belleville Trenton | 26.5°C | −11.2°C | 941 mm |
| Tyendinaga 20 km · Centreville | 27.2°C 0.7°C warmer | −12.4°C 1.2°C colder | 984 mm |
Belleville weather by month
Average daily high and low, mean temperature, rain and snow (as water) and snowfall by month, 1991–2020.
| Month | High | Low | Mean | Rain & snow | Snow |
|---|---|---|---|---|---|
| January | −1.6°C | −11.2°C | −6.4°C | 78 mm | 44 cm |
| February | −0.7°C | −10.6°C | −5.7°C | 60 mm | 39 cm |
| March | 4.4°C | −5.5°C | −0.6°C | 64 mm | 22 cm |
| April | 11.6°C | 0.9°C | 6.3°C | 84 mm | 6 cm |
| May | 18.9°C | 7.3°C | 13.1°C | 81 mm | 0 cm |
| June | 23.9°C | 12.7°C | 18.3°C | 83 mm | 0 cm |
| July | 26.5°C | 15.4°C | 21.0°C | 75 mm | 0 cm |
| August | 25.6°C | 14.4°C | 20.0°C | 70 mm | 0 cm |
| September | 21.6°C | 10.1°C | 15.8°C | 92 mm | 0 cm |
| October | 14.2°C | 4.2°C | 9.2°C | 91 mm | 1 cm |
| November | 7.4°C | −1.5°C | 3.0°C | 84 mm | 10 cm |
| December | 1.4°C | −6.9°C | −2.8°C | 77 mm | 33 cm |
| Year | 12.8°C | 2.4°C | 7.6°C | 941 mm | 155 cm |
January strays furthest from its normal year to year, by 3.0°C; June the least
Over 1991–2020, March saw both −25.6°C (2003) and 25.4°C (1998), the widest span of any month.
Where Belleville’s numbers come from
Averages over 30 years, not a forecast.
- Normals: Environment and Climate Change Canada’s 1991–2020 normals, Trenton: the nearest of its locations with every month’s temperatures.
- Comparisons: every place of 2,500+ in Canada but the city hubs and the reserves, each on its nearest ECCC location.
- Not on this page: sunshine (no 1991–2020 normals exist for it) and any altitude adjustment, since there is no elevation for the town itself.
Canadian Climate Normals 1991–2020 · ECCC Data Services End-use Licence. Data Source: Environment and Climate Change Canada
Questions about Belleville’s climate
How warm does Belleville get in summer?
On a normal day in July the thermometer climbs to 26.5°C, the warmest of the year.
How cold does Belleville get in winter?
January nights average −11.2°C, the coldest of the year.
How much rain and snow does Belleville get?
Around 941 mm a year in all, from 92 mm in September down to 60 mm in February.
How long does snow stay on the ground?
Expect snow on the ground, at least 1 cm, for about 75 days a year.
Are these figures for Belleville itself?
They are the closest available: the normals for Trenton, since Belleville has none.
Data Source: Environment and Climate Change Canada · ECCC Data Services End-use Licence Today’s forecast for Belleville →
Adapted from Statistics Canada (Census of Population 2021, population estimates 2025, 2021 census boundaries) under the Statistics Canada Open Licence; this does not constitute an endorsement by Statistics Canada. Neighbourhood names in some cities © OpenStreetMap contributors (ODbL).