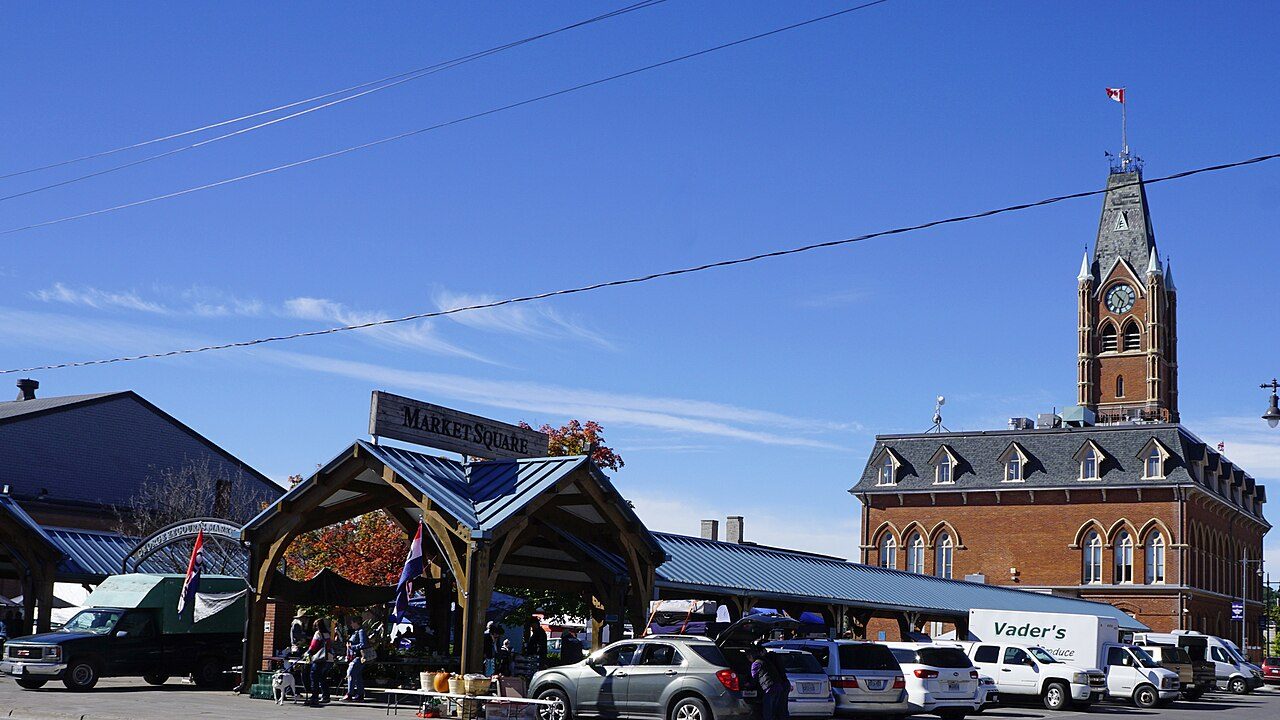
BellevilleOntario
62,914 residents make their home in this town in Ontario. It grew by 9% between the 2016 and 2021 censuses.
Is Belleville a good place to live?
Several subjects drag its grade down. Housing is expensive (D). Belleville’s overall grade is D, better than 12% of Canadian towns. That places it #826 of 858 in Ontario. It also trails on health (C−). Where it does best is walkability (A).
This town's rent is the 2021 census rent scaled to 2025 by its province's ratio of surveyed to census rents: no rental survey covers it, so its Cost Grade is less sure. Health is graded on the health region's survey figures and life expectancy, with the distance to hospital giving the town its own spread.
What makes Belleville stand out
The 3 things Belleville does most differently from other towns.
How Belleville grades
Each subject compares Belleville with Canadian towns of 2,500 or more, ordered by how far it is from the middle. Towns in other countries are graded separately.
How TownRatings grades Canadian towns →
The data
Data highlights are ordered by what stands out in Belleville.
Renting in Belleville eats 24% of household income, more than in Ontario’s towns and across Canadian towns
22% of households spent 30% or more of their income on shelter, near Ontario’s towns (22%) and higher than Canadian towns (18%). The median home value was $424,000, below Ontario’s towns ($695,000) and close to Canadian towns ($406,000).
What homes were worth · The median owner’s estimate at the 2021 census
| Census 2021 | Belleville | Ontario | Canada |
|---|---|---|---|
| Rent as a share of income | 24% | 22% | 20% |
| Median home value, 2021 | $424,000 | $695,000 | $406,000 |
| Households spending 30%+ on shelter | 22% | 22% | 18% |
Statistics Canada, Census 2021; CMHC Rental Market Survey via Statistics Canada · Home values are owners’ own estimates at the May 2021 census, and incomes are for 2020.
18% of adults smoke in the health region around Belleville, against 12% for the typical Canadian town
Source area for health survey and life expectancy: the Hastings and Prince Edward Counties Health Unit
For Belleville itself the measure is access: 3.1 km to the nearest hospital, much like the typical 3.7 km. The survey finds 45% of adults in very good or excellent health, below Ontario’s towns (51%) and Canadian towns (52%) alike. Statistics Canada puts the region’s life expectancy at 79.8, women 81.8 and men 77.8 (2022/2024).
Very good or excellent health · adults, age-standardised
| Health | Belleville | Ontario | Canada |
|---|---|---|---|
| Smokers | 18% | 10% | 12% |
| Chronic conditions (average share) | 20% | 17% | 17% |
| Very good or excellent health | 45% | 51% | 52% |
| Life expectancy at birth | 79.8 | 82.8 | 81.5 |
Statistics Canada, Canadian Community Health Survey 2023/2024 and life expectancy 2022/2024; Open Database of Healthcare Facilities
Hazards in Belleville: wildfire low, radon over the guideline in 12% of tested homes
Earthquake risk in Belleville is ordinary: NRCan’s model puts building losses at $0.045 a year per $1,000 of value, close to the typical town’s $0.030. No one has filed a flood map for Belleville on the national inventory.
Radon tests above the guideline · share of tested homes, 200 Bq/m³
| Hazards | Belleville | Ontario | Canada |
|---|---|---|---|
| Radon tests above the guideline | 12% | 4% | 6.6% |
| Earthquake loss per $1,000 of buildings a year | $0.045 | $0.043 | $0.030 |
NRCan seismic risk model and burned areas, Health Canada radon survey, the Flood Hazard Map Inventory
For safety, Belleville gets a C+
Police recorded 13.6 violent incidents per 1,000 residents a year, above both Ontario’s towns (10.5) and Canadian towns (12). For violence alone the index was 94, above both Ontario’s towns (76) and Canadian towns (86).
Year by year · Crime Severity Index for each year
| 2023–2025 | Belleville | Ontario | Canada |
|---|---|---|---|
| Violent crime | 13.6 | 10.5 | 12 |
| Violent Crime Severity Index | 94 | 76 | 86 |
Statistics Canada, Uniform Crime Reporting Survey, 2023–2025 average
Commuters in Belleville have a short way to work, 20 min on average, less than in Ontario’s towns and across Canadian towns
89% of commuters drove, close to both Ontario’s towns (88%) and Canadian towns (89%).
How working residents got to work · census 2021
| Census 2021 | Belleville | Ontario | Canada |
|---|---|---|---|
| Average trip | 20 min | 29 min | 26 min |
| Car or van | 89% | 88% | 89% |
Statistics Canada, Census 2021 (labour and commuting) · Census day was in May 2021, mid-pandemic, so commuting and work figures carry the lockdowns’ mark.
January lows in Belleville: −11.2°C, against −9.1°C in Ontario’s towns and −13.5°C in Canadian towns
Gardeners get 161 frost-free days, from 1 May to 10 October. A normal September brings 92 mm of precipitation, more than any other month. January is the snowiest month, with 44 cm on average. July afternoons reach 26.5°C on average, about level with Ontario’s towns (26.7°C) and above Canadian towns (25.5°C).
Average high by season · ECCC normals, 1991–2020
| Normals, 1991–2020 | Belleville | Ontario | Canada |
|---|---|---|---|
| January night low | −11.2°C | −9.1°C | −13.5°C |
| July afternoon high | 26.5°C | 26.7°C | 25.5°C |
| Days with frost a year | 146 | 139 | 159 |
| Snowfall a year | 155 cm | 146 cm | 141 cm |
Environment and Climate Change Canada, Canadian Climate Normals 1991–2020 (Trenton)
What November brings in Belleville: −2°C at night, 7°C by day
In November, the normal is 84 mm of rain and snow. The year peaks in July (27°C) and bottoms out in January (−11°C). ECCC’s forecast for Belleville is on the Weather page, hour by hour.
Normal highs, the months ahead · ECCC normals, 1991–2020
| Season | High | Low | Rain and snow |
|---|---|---|---|
| Winter | 0°C | −10°C | 215 mm |
| Spring | 12°C | 1°C | 230 mm |
| Summer | 25°C | 14°C | 228 mm |
| Autumn | 14°C | 4°C | 267 mm |
ECCC normals, 1991–2020 (Trenton); the forecast is on the Weather page
Belleville has one council seat for every 6,990 residents, more than 88% of municipalities in Ontario
Belleville’s council of 9 was elected in October 2022, with Neil Ellis as mayor.
| Turnout | Belleville | Ontario | Canada |
|---|---|---|---|
| Municipal election, 2022 | 40% | 31% | 31% |
Wikidata, MAMH, MMAH, Statistics Canada
At 6 loans per person served, Belleville Public Library lends more than four in five Ontario’s town libraries
Belleville Public Library has one location for the 55,071 people it serves.
Provincial library statistics, OpenStreetMap, the CRA and Statistics Canada
12 of Belleville’s 20 tested schools score in the lower two fifths in Ontario
No French-language school is among them; in Ontario, 10% of schools are. They come under 3 school boards. Within 3 km of Belleville are 18 elementary schools, 4 secondary schools and 4 alternative or adult schools, teaching 9,425 students.
| School | Level | Students | System |
|---|---|---|---|
| Harmony Public School Middle fifth in OntarioLargest elementary schoolElementary · Grades JK–8 | Elementary · Grades JK–8 | 720 | English public |
| Eastside Secondary School Fourth fifth in OntarioLargest secondary schoolSecondary · Grades 9–12 | Secondary · Grades 9–12 | 985 | English public |
Schools by system · Schools within 3 km
| Schools within 3 km | Belleville | Ontario | Canada |
|---|---|---|---|
| School boards | 2 | 4 | 3 |
Provincial school lists and results, 2024-25
Belleville is 57 km from Thousand Islands National Park
The Stirling Rail Trail is the one mapped walking route close by. 14 km from town is Stoco Fen Provincial Park, the nearest provincial park. 18 protected areas lie within 10 km. Protected areas cover 1.2% of the land within 10 km; for the typical Canadian town it is 2.3%.
Protected land · of the land within 10 km
| Outdoors | Belleville | Ontario | Canada |
|---|---|---|---|
| Public protected areas within 10 km | 0 | 4 | 4 |
| Protected land within 10 km | 1.2% | 2.3% | 2.3% |
Canadian Protected and Conserved Areas Database (CPCAD), OpenStreetMap routes and beaches
Belleville skews older, with 24% of residents 65 or over, more than in Ontario’s towns and across Canadian towns
5.6% of residents have an Indigenous identity, above both Ontario’s towns (1.6%) and Canadian towns (2.8%). The share of residents under 15 is 15%.
Ages · Share of residents in each age group, Census 2021
Schooling · Highest qualification, residents 15 and over
Women and men · all residents
51.6% of Belleville’s residents are women
Women numbered 28,445 and men 26,630 in 2021, next to a 50.9% share of women for Canada.
| Belleville | Ontario | Canada | |
|---|---|---|---|
| Under 15 | 15% | 15% | 16% |
| 15 to 64 | 61% | 65% | 64% |
| 65+ | 24% | 19% | 19% |
| No certificate, diploma or degree | 17% | 15% | 16% |
| Postsecondary qualification | 52% | 56% | 56% |
Statistics Canada, Census 2021; Ontario and Canada: medians of towns of 2,500+
The registers list 4 historic places in Belleville, 2 at the top
The earliest construction date, 1856, belongs to Belleville Railway Station (Grand Trunk). Before 1961 is when a third of the homes went up, above Ontario’s towns (22%) and Canadian towns (18%) alike.
Historic places by designation · inside the town
Among them
| Heritage | Belleville | Ontario | Canada |
|---|---|---|---|
| Homes built before 1961 | 33% | 22% | 18% |
Canadian Register of Historic Places, Directory of Federal Heritage Designations, Québec’s Répertoire du patrimoine culturel, Wikidata; Census 2021 homes by period
Everything we know about Belleville
Famous people from Belleville
114 notable people were born in Belleville.





Photo credits
Avril Lavigne: Raph_PH, CC BY 2.0 · Brett Hull: Johnmaxmena2, CC BY-SA 4.0 · Farley Mowat: Tabercil, CC BY 3.0 · Brian Orser: David W. Carmichael, CC BY-SA 3.0 · Lee Aaron: Jerry Fielden (user Slugguitar), CC BY-SA 3.0 · Andrew Raycroft: Josh & Sara from Seattle, CC BY-SA 2.0
Belleville’s neighbours
The nearest places of 1,000 or more. Statistics Canada
| Town | People | km | Overall | Cost | Safety | Health |
|---|---|---|---|---|---|---|
| Belleville | 62,914 | — | D | D | C+ | C− |
| Quinte West | 50,385 | 16 | C− | C− | B+ | C− |
| Tyendinaga Mohawk Territory | 3,028 | 18 | — | — | — | D |
People: Statistics Canada, Census 2021. Distances: centre to centre.
Questions about Belleville
Has Belleville grown?
It added people: 50,716 in 2016, 55,071 in 2021, 8.6% more, where the middle of Canadian towns grew 4.1%. Statistics Canada’s 2025 estimate is 62,914.
Who are the people of Belleville?
Visible minorities are 9% of the population, where the middle of Canadian towns is 15%. Immigrants make up 9%, and Indigenous people 6%.
What kind of homes are in Belleville?
59% of homes are single-detached houses, against 64% for the median of Canadian towns, and 9% are in apartment buildings of five storeys or more. A household averages 2.3 people; 31% are one person living alone.
Is Belleville a young town or an old one?
At 45.2, its median age compares with 45.2 across Canadian towns. Children make up 15% of the population and seniors 24%.
About Belleville
Town in Ontario
The boundary here is Statistics Canada’s: Belleville is one census subdivision in Ontario, and TownRatings describes all of it.
Statistics Canada: population estimates 2025 (17-10-0155), Census of Population 2021, 2021 census boundaries.
- Population
- 62,914 (people, 2025 estimate)
- Province or territory
- Ontario
- Census division
- Hastings
- Metro area
- Belleville - Quinte West
- Census subdivision
- 3512005
Sources: Statistics Canada, Census of Population 2021 · population estimates 2025 (17-10-0155) and 2021 census boundaries · Uniform Crime Reporting Survey 2023–25 (35-10-0026, 35-10-0183 to 35-10-0190) · CMHC rents as published by Statistics Canada (34-10-0133) · grades by TownRatings. Under the Statistics Canada Open Licence.
Adapted from Statistics Canada (Census of Population 2021, population estimates 2025, 2021 census boundaries) under the Statistics Canada Open Licence; this does not constitute an endorsement by Statistics Canada. Neighbourhood names in some cities © OpenStreetMap contributors (ODbL).