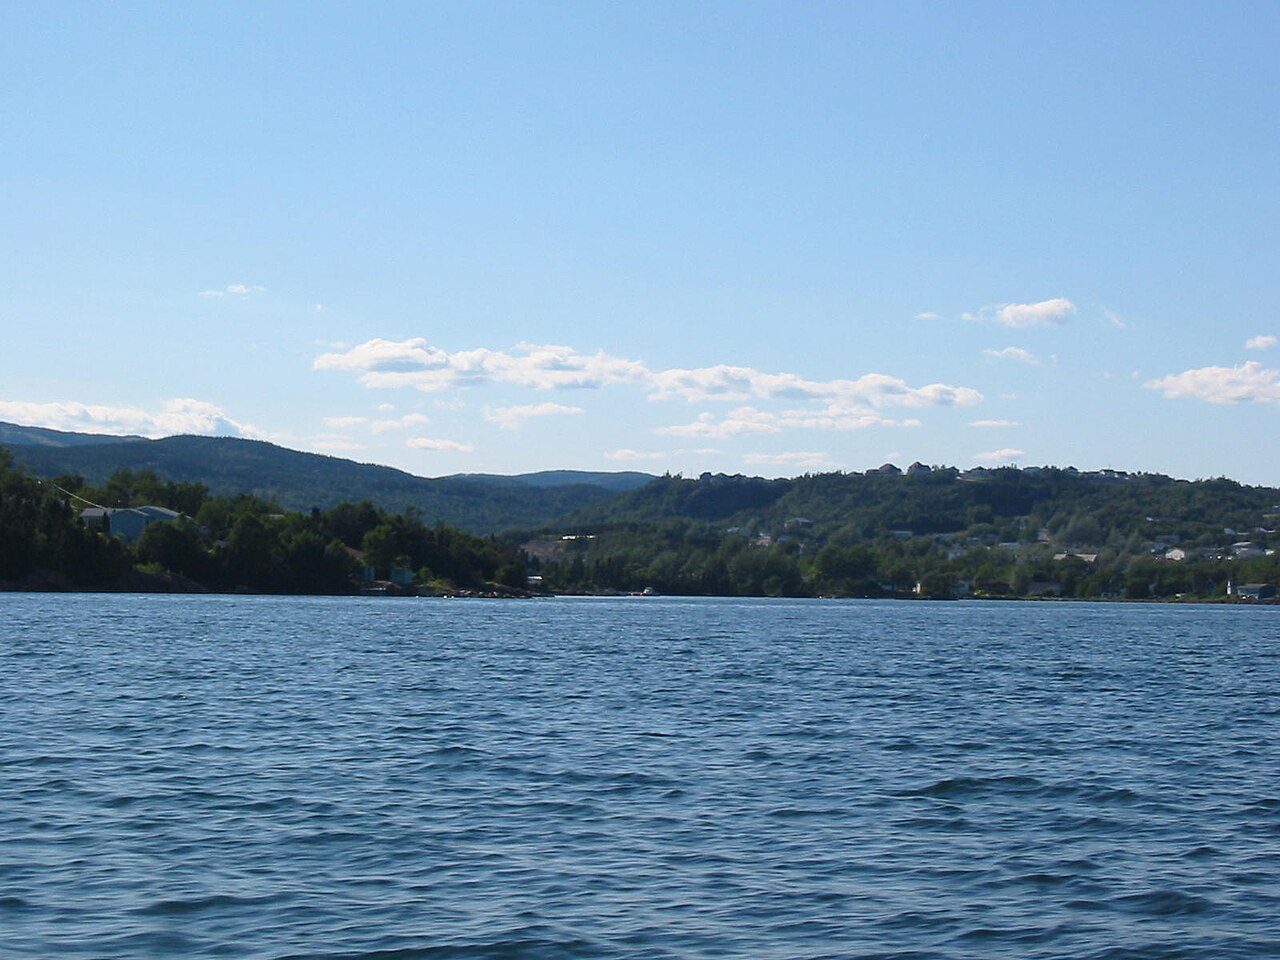
Home › Canada › Newfoundland and Labrador › Rankings › Lowest hazard risk Happy Valley-Goose Bay, #1 on this list · Photo: Shawn from Airdrie, Canada (CC BY-SA 2.0) Newfoundland and Labrador · 2026 Towns with the lowest hazard risk in Newfoundland and Labrador First place in Newfoundland and Labrador goes to Happy Valley-Goose Bay, with A+. Clarenville takes second place with A+; Bonavista is third with A+. An A of some kind goes to 27 of the 32 listed. Last comes Labrador City, at D−. Nationally, Happy Valley-Goose Bay ranks #19 of 2,589. A single place in Newfoundland and Labrador reaches the top 100 for all of Canada.
Hazard risk grade: earthquake loss and radon, with high wildfire as a ceiling How grades work
#1 Newfoundland and Labrador · 8,197 people A+ Hazard riskOverall B · #1,062 of 2,556
Strongest: hazard risk A+ , jobs & income A · lowest: safety D−
#2 Newfoundland and Labrador · 7,441 people A+ Hazard riskOverall B− · #1,486 of 2,556
Strongest: hazard risk A+ , cost of living B · lowest: health D
#3 Newfoundland and Labrador · 3,293 people A+ Hazard riskOverall C · #1,987 of 2,556
Strongest: hazard risk A+ , walkability B+ · lowest: health C−
All 32, ranked in Newfoundland and Labrador Best first in Newfoundland and Labrador; beside each place, its rank on the same list for all of Canada.
Every Newfoundland and Labrador list # Town Hazard risk Canada rank What drives it
2 Clarenville 7,441 people A+ #241 of 2,589 Strongest: hazard risk A+ , cost of living B · lowest: health D 3 Bonavista 3,293 people A+ #242 of 2,589 Strongest: hazard risk A+ , walkability B+ · lowest: health C− 4 Springdale 2,893 people A+ #245 of 2,589 Strongest: hazard risk A+ , safety B+ · lowest: jobs & income C− 5 Bay Roberts 6,407 people A #258 of 2,589 Strongest: hazard risk A , cost of living B · lowest: health D− 6 Carbonear 5,041 people A #259 of 2,589 Strongest: hazard risk A , walkability B · lowest: jobs & income D 7 Harbour Grace 2,872 people A #260 of 2,589 Strongest: hazard risk A , cost of living B · lowest: jobs & income D 8 Lewisporte 3,405 people A #272 of 2,589 Strongest: hazard risk A , cost of living B · lowest: health D 9 Botwood 2,884 people A #273 of 2,589 Strongest: hazard risk A , walkability B+ · lowest: jobs & income D 11 Torbay 8,297 people A #278 of 2,589 Strongest: hazard risk A , jobs & income A− · lowest: walkability C 12 Mount Pearl 24,266 people A #279 of 2,589 Strongest: hazard risk A , jobs & income B+ · lowest: cost of living C 13 St. John's 128,693 people A #280 of 2,589 Strongest: hazard risk A , walkability A · lowest: cost of living C− 14 Spaniard's Bay 2,664 people A #281 of 2,589 Strongest: hazard risk A , cost of living B− · lowest: jobs & income D− 18 Gander 12,707 people A #380 of 2,589 Strongest: hazard risk A , cost of living B+ · lowest: safety C− 19 Conception Bay South 29,725 people A #381 of 2,589 Strongest: hazard risk A , jobs & income B+ · lowest: safety C 20 Placentia 3,374 people A #382 of 2,589 Strongest: hazard risk A , cost of living A · lowest: health D 21 Marystown 5,196 people A #470 of 2,589 Strongest: hazard risk A , cost of living B · lowest: health D− 23 Paradise 26,155 people A #481 of 2,589 Strongest: jobs & income A , hazard risk A · lowest: safety C 24 Holyrood 2,749 people A #482 of 2,589 Strongest: hazard risk A , cost of living C+ · lowest: health D− 25 Pasadena 3,930 people A− #861 of 2,589 Strongest: hazard risk A− , cost of living A− · lowest: health D 26 Corner Brook 20,549 people A− #885 of 2,589 Strongest: hazard risk A− , walkability B+ · lowest: health C 27 Deer Lake 5,319 people A− #886 of 2,589 Strongest: walkability A− , hazard risk A− · lowest: health D 28 Stephenville 6,840 people B+ #1,096 of 2,589 Strongest: walkability A− , hazard risk B+ · lowest: safety D 30 Grand Falls-Windsor 14,510 people D #2,539 of 2,589 Strongest: walkability B , cost of living B · lowest: hazard risk D 31 Bishop's Falls 3,162 people D #2,540 of 2,589 Strongest: cost of living B , walkability C+ · lowest: hazard risk D 32 Labrador City 7,965 people D− #2,561 of 2,589 Strongest: jobs & income A+ , cost of living A+ · lowest: hazard risk D− Rankings
More lists for Newfoundland and Labrador Province by province
Lowest hazard risk elsewhere Photos: Happy Valley-Goose Bay, Shawn from Airdrie, Canada (CC BY-SA 2.0 ) · Clarenville, Rioux Photography Edmonton, AB (Public domain ) · Bonavista, Yergoneby (CC BY-SA 4.0 ), via Wikimedia Commons.
Sources: TownRatings grades: our own summary of the data, ranking Canadian towns against each other only, run #73 of 10 November 2026. Under the Statistics Canada Open Licence.
Adapted from Statistics Canada (Census of Population 2021, population estimates 2025, 2021 census boundaries) under the Statistics Canada Open Licence; this does not constitute an endorsement by Statistics Canada. Neighbourhood names in some cities © OpenStreetMap contributors (ODbL).
 #1
 #2
 #3